
Part of Investor presentation examples · Japanese investor presentation examples
K Line H1 FY2026 Earnings Presentation: Kawasaki Kisen Kaisha ("K" LINE) results for the first half of the fiscal year ending March 2027 (FY2026 = April 2026 to March 2027), dated November 4, 2026. This is a Japanese-language deck (決算説明会資料) released on TDnet, the Tokyo Stock Exchange timely disclosure system. It covers H1 revenue of ¥602.0 billion (6,020 億円) and ordinary profit of ¥118.3 billion (1,183 億円), a full-year ordinary profit forecast raised to ¥190.0 billion (1,900 億円, +550 億円 vs. the August forecast), segment results for dry bulk, energy resources and product logistics (car carriers and ONE container shipping), the ¥122.5 billion share buyback, and the Middle East / Hormuz / Suez operating environment.
Uses this deck’s cover as a style reference for slides made from your own content. Or pick any page below to use its layout as the reference.
Quick Navigation
Tags
Share the slides
K Line H1 FY2026 Earnings Presentation: Kawasaki Kisen Kaisha ("K" LINE) results for the first half of the fiscal year ending March 2027 (FY2026 = April 2026 to March 2027), dated November 4, 2026. This is a Japanese-language deck (決算説明会資料) released on TDnet, the Tokyo Stock Exchange timely disclosure system. It covers H1 revenue of ¥602.0 billion (6,020 億円) and ordinary profit of ¥118.3 billion (1,183 億円), a full-year ordinary profit forecast raised to ¥190.0 billion (1,900 億円, +550 億円 vs. the August forecast), segment results for dry bulk, energy resources and product logistics (car carriers and ONE container shipping), the ¥122.5 billion share buyback, and the Middle East / Hormuz / Suez operating environment.
Detailed view of each slide page, including layout, key content and visual elements.
Cover for Kawasaki Kisen Kaisha's FY2026 second-quarter results briefing (2026年度第2四半期 決算説明会資料), dated November 4, 2026, with the "K" LINE logo.
Full-bleed brand cover: an oversized red "K" monogram with grey diagonal shapes on the left, title and date right-aligned, logo at bottom right.
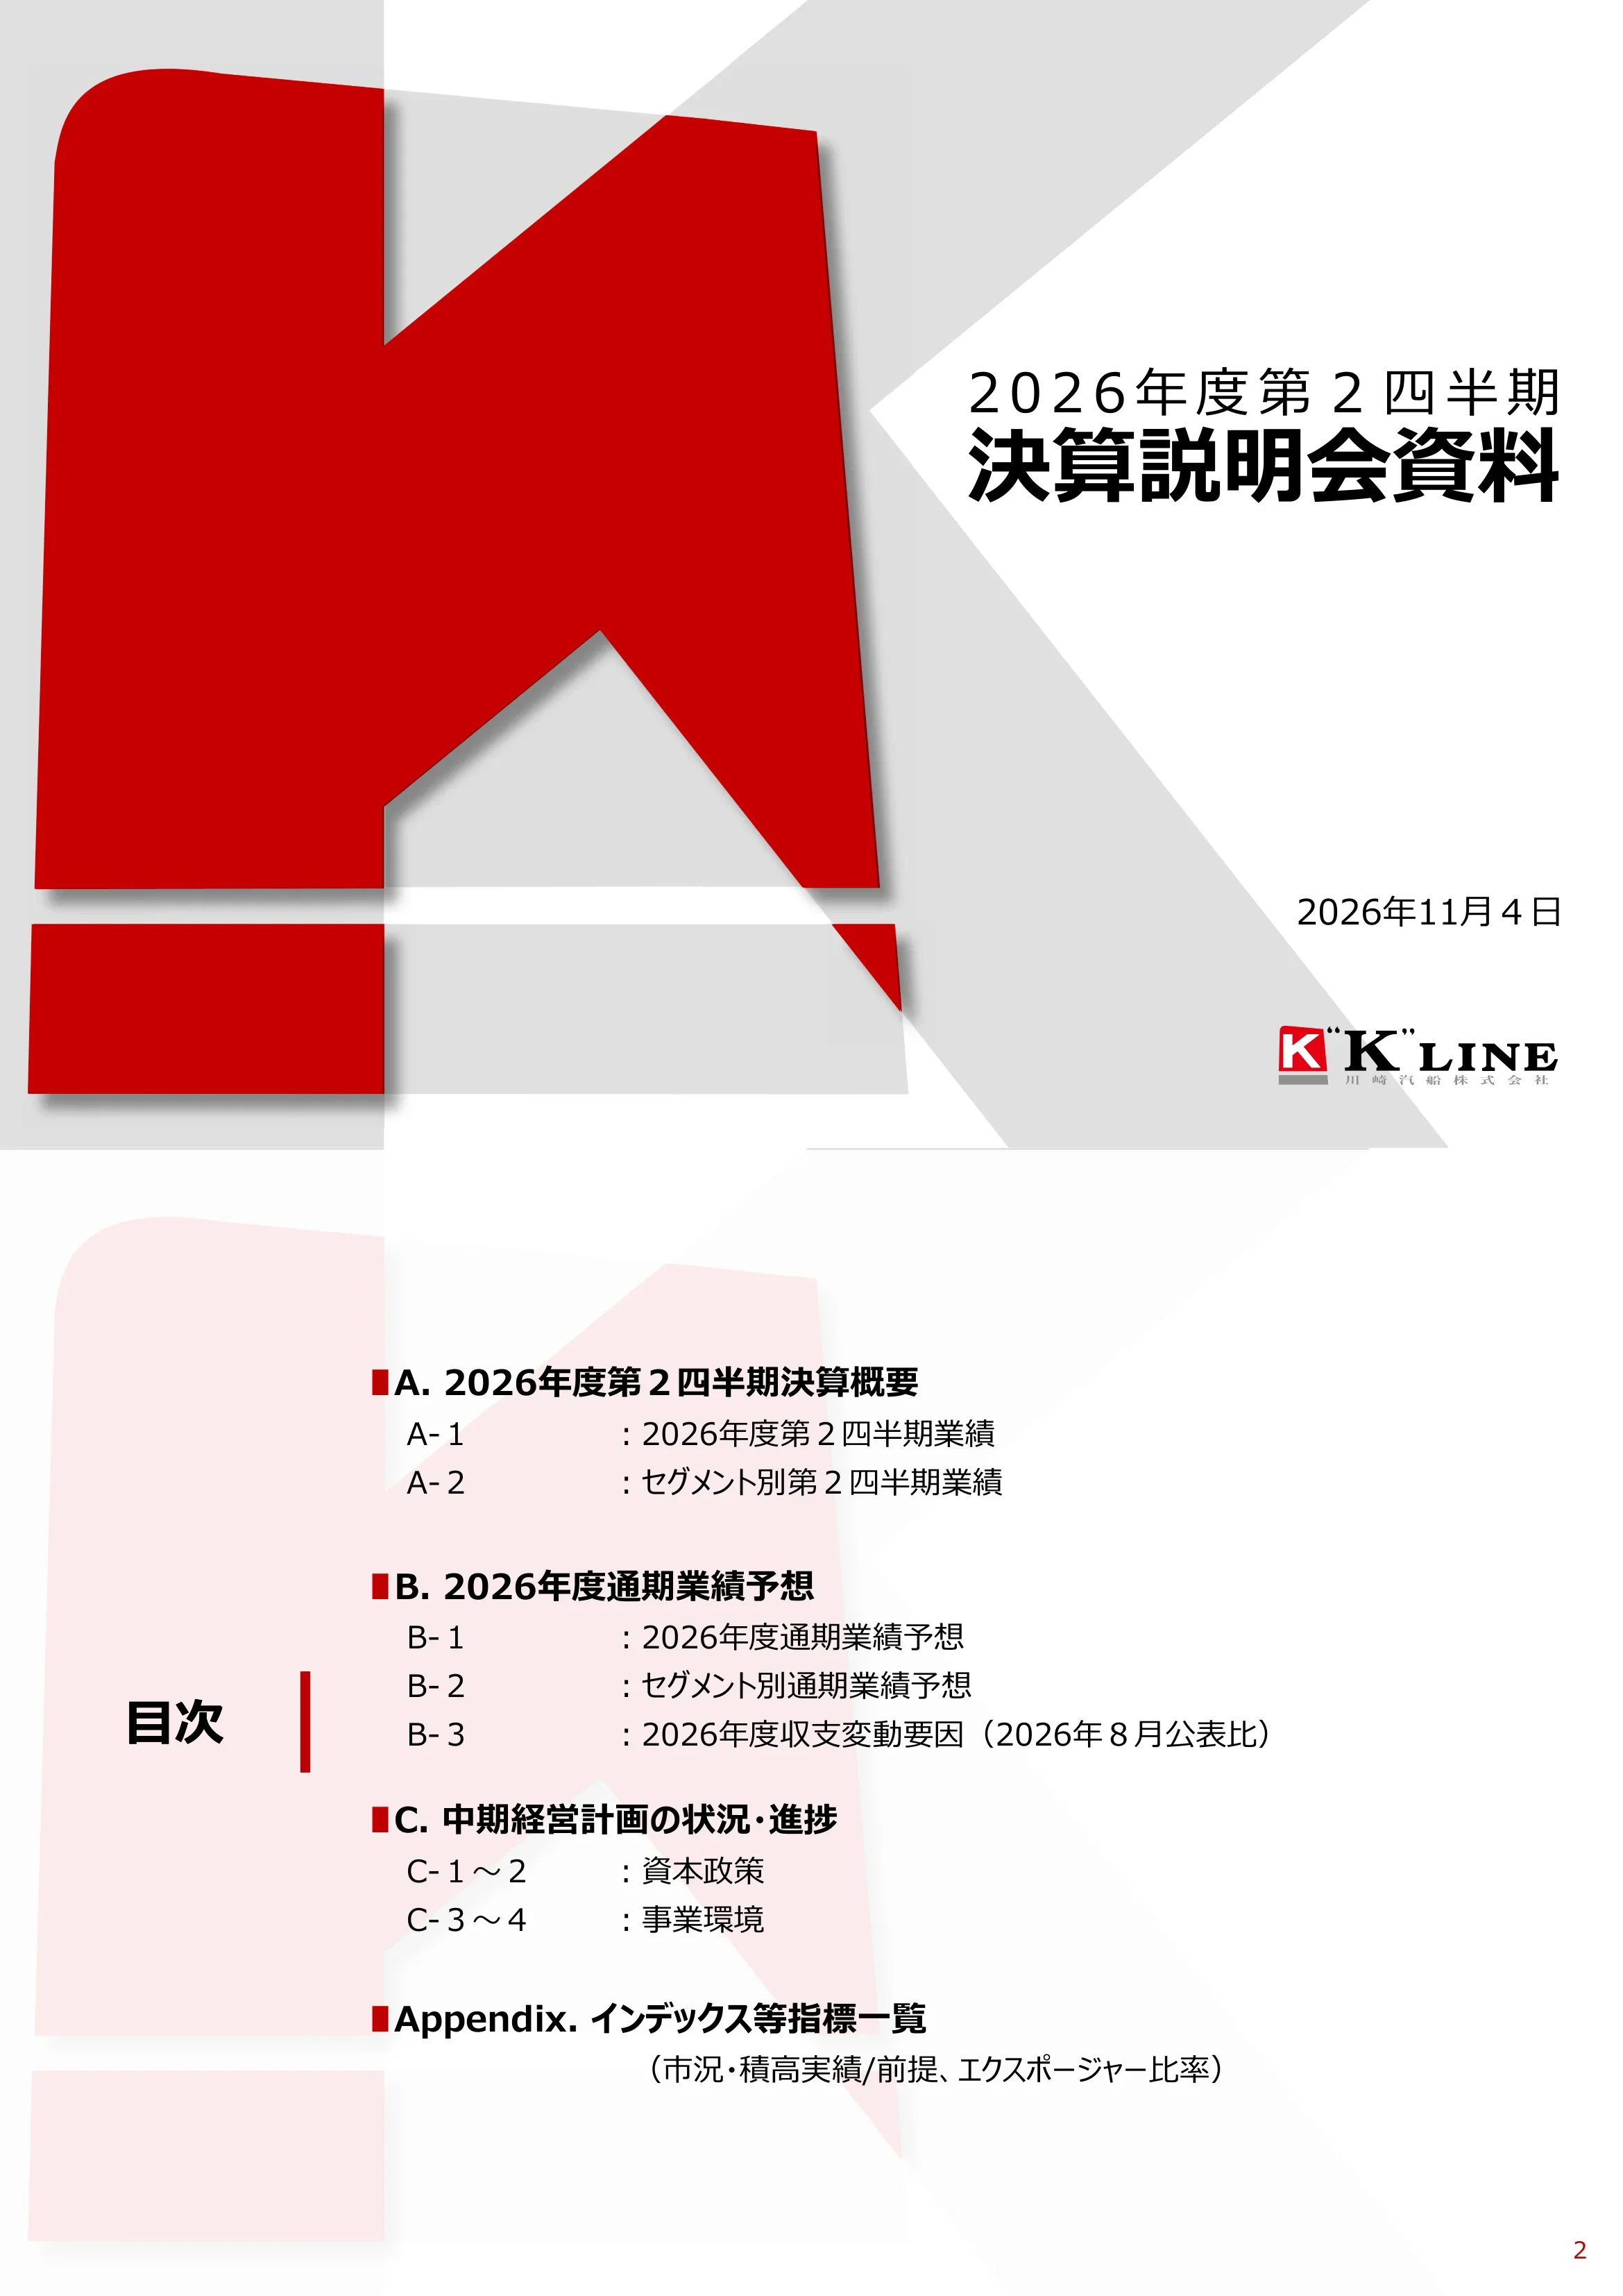
Agenda in four parts: A. FY2026 Q2 results summary (A-1 consolidated results, A-2 segment results); B. FY2026 full-year forecast (B-1 consolidated, B-2 by segment, B-3 changes vs. the August 2026 forecast); C. Mid-term plan status (C-1 to C-2 capital policy, C-3 to C-4 business environment); Appendix of market indices, volumes and exposure ratios.
Left label "目次" with a red vertical divider; right column lists sections with red square bullets and indented sub-items over a faded K watermark.
Section divider introducing the second-quarter (first-half) results summary.
White slide with a thick red vertical bar beside a two-line centered heading.
H1 FY2026 revenue ¥602.0 billion (6,020 億円; 1Q 2,868, 2Q 3,151), up 1,014 億円 year on year and 275 億円 above the August forecast of 5,745 億円. Operating profit 512 億円 (+82 YoY, +92 vs. forecast); ordinary profit 1,183 億円 (+587 YoY, +383 vs. the 800 億円 forecast), with 2Q alone at 943 億円; net income attributable to owners 1,245 億円 (+558 YoY, +385 vs. 860). Average FX ¥160.47/$ (vs. ¥146.18 a year earlier) and bunker $788/MT (vs. $547). Balance sheet at end of 2Q: equity 17,468 億円 (−558 from FY2025 end), interest-bearing debt 3,225 億円 (+264), D/E ratio 18.5% (+2.0pt), equity ratio 75.5% (−1.4pt); including off-balance charter liabilities of 5,500–6,500 億円 the equity ratio is 59–61%. Drivers: operating profit rose on firm dry bulk markets despite higher fuel costs from the Middle East situation; ordinary profit jumped on higher equity-method income from ONE; net income includes extraordinary gains from vessel sales.
Top: wide consolidated results table with dark-grey 2026 columns (1Q, 2Q, H1) and light-grey comparison columns (FY2025 H1, YoY change, August forecast, change vs. forecast). Bottom left: key financial indicators table; bottom right: three bullet points on main YoY drivers.
Segment revenue / ordinary profit for H1 (億円): Dry Bulk 1,895 / 160 (vs. 1,443 / 13 a year earlier; profit +146); Energy Resources 602 / 48 (profit −6 YoY); Product Logistics 3,515 / 981 (+407), of which Car Carriers 2,200 / 153 (profit −147 YoY) and Containerships 381 / 744 (+523, mainly ONE equity income; 2Q alone 689); Others 6 / 6; Corporate & adjustments −12. Total 6,020 / 1,183. Versus the August forecast, container profit was 309 億円 higher. Commentary: dry bulk capesize and mid/small-size markets stayed firm on active demand, plus FX tailwinds; energy saw strong LPG and tanker markets but lost a prior-year one-off tax-effect gain; car carriers were hit by lower fleet utilization and higher fuel and operating costs from the Middle East situation; container short-term freight rates rose as the Middle East situation and port congestion tightened supply. FY2025 figures are restated for the 2026 segment change.
Segment matrix with two rows per segment (upper revenue, lower ordinary profit) across 1Q, 2Q, H1, prior-year H1, YoY change, August forecast and variance; below, four text columns of segment commentary.
Section divider introducing the full-year forecast for FY2026 (year ending March 2027).
White slide with red vertical bar and two-line heading, matching the other dividers.
Full-year forecast (unchanged from the October 23, 2026 revision notice): revenue 11,700 億円 (H2 5,680; +1,517 vs. FY2025's 10,183; +1,000 vs. the August forecast of 10,700); operating profit 910 億円 (+60 vs. August); ordinary profit 1,900 億円 (H2 717; +809 YoY; +550 vs. 1,350); net income 1,900 億円 (H2 655; +571 YoY; +550 vs. 1,350). The upgrade comes from dry bulk profit growth and better container economics on higher short-term freight rates. Assumptions: ¥155.85/$ average (H2 ¥151.23), bunker $805/MT (H2 $821), Strait of Hormuz normalizing toward end-March 2027 with transits resuming from April 2027, and no Suez Canal transits for the full year (Cape of Good Hope routing continues; ONE plans to resume Suez on some routes). Six-month sensitivities: ±12 億円 per ¥1/$ (including ONE equity income) and ±5.0 億円 per $10/MT bunker. Shareholder returns: FY2026 dividend ¥120 per share (¥60 interim and ¥60 year-end); the buyback announced May 29, 2026 was completed at 44,429 thousand shares / 1,225 億円 and the shares were cancelled on October 2.
Wide forecast table with H1 and full-year forecast columns shaded pink, followed by a one-line key-driver statement and two rounded boxes: assumptions and sensitivities (left, grey border) and shareholder returns (right, red border) with a "Details: C-2" link button.
Full-year segment forecast, revenue / ordinary profit (億円): Dry Bulk 3,625 / 320 (+205 YoY; +105 vs. August); Energy Resources 1,125 / 60 (−47 YoY; −15 vs. August); Product Logistics 6,940 / 1,565 (+657 YoY; +475 vs. August), of which Car Carriers 4,405 / 330 (−181 YoY; −75 vs. August) and Containerships 720 / 1,070 (+830 YoY; +540 vs. August); Others 10 / 0; Corporate & adjustments −45. Total 11,700 / 1,900. Commentary: dry bulk markets expected above last year on solid demand; energy down on the loss of last year's one-off tax-effect gain; car carriers face a large profit drop from higher fuel and operating costs, so K Line will right-size the fleet and improve deployment; containers expected sharply higher on a strong first half, with ONE managing flexibly amid continued Middle East uncertainty.
Same two-tier segment matrix as A-2 but with H2 and full-year forecast columns (pink highlight) plus FY2025 actual, YoY change, August forecast and variance; four commentary columns below.
Waterfall bridge of full-year ordinary profit from the August forecast of 1,350 億円 (own businesses 820, container business 530) to the November forecast of 1,900 億円 (own businesses 830, container business 1,070). First half adds +383 (own businesses +74, containers +309); second half adds +167 (own businesses −64, containers +231). H1: own businesses gained from more high-margin cargo in car carriers and firm dry bulk; containers rose on tight supply lifting short-term rates. H2: own businesses expected lower on car-carrier operating costs from persistently high fuel prices despite firm dry bulk; containers expected well above the previous forecast as short-term rates run higher.
Waterfall chart with stacked start and end columns (red = own businesses, beige = container business) and floating grey/blue step bars, grouped by brackets into H1 and H2; two-column bullet explanation below.
Section divider for the progress update on the mid-term management plan.
White slide with red vertical bar and heading.
Headline: strengthen earning power while managing optimal capital structure and cash allocation, balancing capital efficiency with financial soundness. Earning power: mid-term plan operating cash flow ¥1.5 trillion (unchanged); final-year FY2026 ordinary profit expected at 1,900 億円 (+550 vs. August). Investment: investing cash flow of 6,100 億円 over the plan, focused on growth businesses and low/zero-carbon environmental investment. Optimal capital structure: target an equity ratio (including off-balance items) of around 50% in the short term. Shareholder returns: 8,800 億円 or more over the plan period; FY2026 dividend ¥120 per share; 44,429 thousand shares / 1,225 億円 bought back and fully cancelled. Corporate value: aim for ROE of 15%+ in the future and a sustained PBR of 1.0x or higher; moved to a company with a nominating committee structure on March 28, 2025. Side panel: ROIC 7% (FY2026 estimate) and management upgrades (segment financial statements, business value management, investment management).
Dark rounded headline banner; five stacked rows connected by red down-arrows, each with a grey label tile, a slate-blue KPI tile and bullet text; a grey side panel on the right for management-control initiatives.
Based on the policy of normalizing capital toward an off-balance-inclusive equity ratio of about 50%, K Line bought back 44,429 thousand shares for 1,225 億円 (cancelled October 2, 2026). Total returns over the mid-term plan are planned at 8,800 億円 or more; the FY2026 dividend is ¥120 per share (¥60 interim, ¥60 year-end), unchanged from August. Chart: FY2021–24 actual returns 5,960 億円 (buybacks 3,120, dividends 2,840); FY2025 770 億円 (¥120 per share = ¥40 base + ¥80 additional dividend); FY2026 plan 1,940 億円 (dividends 710 億円 at ¥120 per share plus the 1,225 億円 buyback). Totals are rounded to the nearest 億円. Policy: after securing needed investment and financial soundness, actively consider returns including buybacks for capital above the appropriate level.
Dark banner on top; left column of headline figures (total returns, dividend, buyback) and a grey policy box; right side a stacked-column return chart (actual vs. plan) with a legend of base dividend, additional dividend, buyback and flexible additional returns, plus a totals table underneath.
Geopolitical risks led by the Middle East keep weighing on the global economy, and trade and energy policies remain uncertain. Geopolitics: US–China rivalry, Russia–Ukraine and Middle East tensions continue to fragment the economy; tension around the Strait of Hormuz has destabilized energy supply chains; Japan–China relations need watching; K Line puts crew, cargo and vessel safety first for Hormuz transits and remains cautious about ending Suez avoidance. World economy: policy uncertainty, US/EU sentiment, China slowdown; risks of supply-chain realignment and inflation from wages and oil. Energy and environment: the October 2025 IMO extraordinary MEPC did not adopt the MARPOL amendment, delaying a global rule; uncertain national energy-mix policies; new CO2 rules; energy shortages and price spikes; risk of slower decarbonization but possible long-term opportunities. Response: pursue decarbonization as a business opportunity, leverage three strengths (environment and technology, safety and ship quality, DX), and prepare risk responses.
Dark banner, then a 3-column by 2-row matrix (geopolitical risk, world economy, energy and environmental policy × external environment, expected risks and opportunities) with icons, a red chevron, and a boxed company-response row.
Middle East: US–Iran military clashes and retaliation have sharply restricted passage through the Strait of Hormuz and Bab el-Mandeb amid attacks on merchant ships. Hormuz: K Line follows avoidance advisories and coordinates with customers; impact includes higher costs from congestion, fuel and war-risk insurance, with limited impact on dry bulk, rerouting of energy loadings away from the Middle East, and some impact on car carriers and containers. Suez: resumption requires confirmed safety (ONE plans to resume on some routes); rerouting absorbs about 1–2% of dry bulk supply, about 4–5% of car-carrier supply and about 10% of container supply, LNG is shielded by long-term contracts, and a reopening could increase scrapping of older ships. US tariffs: on July 24 the US announced new Section 301 tariffs on 60 countries and regions including Japan and the EU (12.5% for Japan in principle), with Section 232 items such as steel, aluminum and autos remaining under the existing regime; services are being redeployed. USTR measures on China-linked ships: port fees mutually postponed one year after the October 30, 2025 US–China talks, and USTR proposed extending the suspension by two months to January 9, 2027; new orders at Chinese yards are reviewed case by case.
Dark banner; table with red row headers (Middle East, US tariff policy, USTR China-ship measures) and three grey column headers (overview, shipping company response, business impact), with pink vertical sub-labels for Hormuz and Suez.
Divider introducing the appendix of market data, volumes and fleet information.
Minimal divider slide with red accent bar and the word Appendix.
Dry bulk daily charter rates: Capesize FY2025 average $23,800 vs. FY2026 1Q $39,800, 2Q $44,850, 3Q assumption $41,000, 4Q $27,000, full year $38,150; Panamax $14,800 vs. $18,850 FY2026; Handymax $13,300 vs. $17,150; Small Handy $12,750 vs. $15,100 (Capesize basis changes from 180k to 182k dwt). Tankers: VLCC (Middle East–Japan) FY2025 $110,150, FY2026 1Q $130,350, 2Q $336,350, H2 assumption $42,000, full year $137,700; Aframax $30,550 vs. $34,150. Operated fleet: dry bulk 178 (FY2024 end) → 163 (FY2025 end) → 165 (September 2026); energy 83 → 92 → 89, including LNG 54. Six-month market exposure: Capesize 12%, mid/small bulkers 21%, chip, VLCC, LPG and coal carriers 0%.
Two wide quarterly rate tables (dry bulk, tanker) with FY2026 columns shaded pink, then a fleet-count table and an exposure-ratio table side by side.
Car carrier volumes (thousand units): FY2025 total 3,390 (outbound 1,549, inbound 197, cross-trade 893, intra-Europe 751); FY2026 1Q 863 and 2Q 875 actual, 3Q 899 and 4Q 887 assumed, full year 3,524 (outbound 1,663, inbound 201, cross-trade 916, intra-Europe 744). Fleet size rises from 99 to 100 vessels. A stacked area chart from FY2019 to FY2026 by route (Japan/Far East–North America, –Europe, –others, cross-trade, inbound, intra-Europe) shows the COVID trough of 44 (10,000 units) in FY2020 1Q and a recovery to about 89–90 in FY2026.
Quarterly volume table on top with pink FY2026 columns; full-width stacked area chart below with quarterly labels and a route legend.
Group fleet of 439 vessels and 35.13 million dwt at end-September 2026 (215 owned, 224 chartered) vs. 440 vessels and 34.76 million dwt at FY2025 end. By segment: dry bulk 165 (20.84 million dwt), energy resources 96 (tankers 12, LNG 54, coal carriers 23, plus drilling, FPSO, survey and liquefied-CO2 vessels), car carriers 99, containerships 36, short-sea and coastal 42, and 1 LNG bunkering vessel. Owned counts include co-owned ships and charters include short-term and spot ships.
Horizontal stacked bar chart comparing the two dates by segment, then a detailed table of owned, chartered and total vessel counts and deadweight tonnage by ship type.
Operated vessels by segment and type: dry bulk 163 → 165 (Capesize 79, Panamax 38, Handymax 32, Small Handy 10, chip 6); energy resources 99 → 96 (VLCC 5, Aframax 2, LPG 5, LNG 54, coal 23, others); product logistics 177 (car carriers 99, with 30 of the 7,000-unit class; containerships 36, including 12 of 14,000 TEU; short-sea and coastal 42); total 440 → 439. Newbuilding deliveries: 16 in 2026, 16 in 2027 and 15 in 2028, including Capesizes (1 / 4 / 8), LNG carriers (8 / 5 / –), 7,000-unit car carriers (– / 3 / 1) and a liquefied-CO2 carrier in 2028.
Left: tall table with red header and pink segment blocks listing vessel types for two dates; right: compact grid of newbuilding deliveries by year with a grey total row.
Disclaimer: the material is for information only and is not a solicitation to buy or sell shares; investment decisions are the investor's own. Forward-looking statements are based on currently available information and may change with the economy, shipping supply and demand, fuel prices and exchange rates.
Text-only slide with two bracketed headings and short paragraphs.
Common questions about this slide and the underlying presentation content.
The original is a Japanese-language results briefing deck (決算説明会資料) from Kawasaki Kisen Kaisha ("K" LINE), released on November 4, 2026 through TDnet, the Tokyo Stock Exchange timely disclosure system. The page summaries here are written in English and keep amounts in yen and the company's own unit, 億円 (¥100 million).
FY2026 is K Line's fiscal year ending March 31, 2027, so it runs from April 2026 to March 2027. This deck reports the second quarter, i.e. the first half from April to September 2026, and the full-year forecast.
Revenue was 6,020 億円 (about ¥602 billion), operating profit 512 億円, ordinary profit 1,183 億円 and net income attributable to owners 1,245 億円. Ordinary profit was 587 億円 higher than a year earlier, mainly due to higher equity-method income from the ONE container joint venture and firm dry bulk markets.
The full-year ordinary profit and net income forecasts were both raised to 1,900 億円, 550 億円 above the August 2026 forecast, and revenue to 11,700 億円. The forecast was first revised on October 23, 2026 and is unchanged in this deck. The bridge on page 9 attributes +540 億円 to the container business and +10 億円 to K Line's own businesses.
An annual FY2026 dividend of ¥120 per share (¥60 interim and ¥60 year-end), completion of a 44,429 thousand share / 1,225 億円 buyback with the shares cancelled on October 2, 2026, and total returns of 8,800 億円 or more over the mid-term plan period.
The deck says Hormuz restrictions and Cape of Good Hope rerouting raise fuel, insurance and congestion costs. Car carriers take the biggest hit, while containerships benefit from tighter capacity and higher short-term rates. Rerouting absorbs about 1–2% of dry bulk supply, 4–5% of car-carrier supply and about 10% of container supply. The forecast assumes Hormuz normalizes toward end-March 2027 and no Suez transits for the year.
Yes. The PDF of the original Japanese presentation can be downloaded from this page. Its layouts, including the two-tier segment tables, the forecast waterfall, the capital-policy framework and the shareholder-return chart, are useful references for building your own earnings or IR slides.

Create Your Own Slides
Turn your ideas into professional presentations in seconds with 2slides AI.
Reference professional designs, choose your style, and generate slides with perfect text rendering. Powered by Nano Banana—start creating your presentation now.
Your AI Agent for slides. Save time, shine faster with intelligent presentation creation.


© 2026 2slides. All rights reserved.