
Part of Investor presentation examples
Itaú Unibanco Holding S.A. 3Q26 Results: the 27-slide deck used at the public meeting with analysts and investors and the 3Q26 earnings review in São Paulo on November 4, 2026, filed with the SEC as an exhibit to Form 6-K. All amounts are in R$ (Brazilian reais). The deck reports a recurring managerial result of R$12.6 billion (+2.5% vs 2Q26, +6.7% vs 3Q25), a consolidated recurring managerial ROE of 23.6% (24.5% in Brazil), a R$1,544 billion credit portfolio, R$33.3 billion of financial margin with clients, a 37.5% consolidated efficiency ratio and a 12.7% CET1 ratio, then walks through margin, fees, credit quality, expenses, capital, 2026 guidance and a six-part 'competitive advantages' section before an appendix with the full income statement and business-model breakdown.
Uses this deck’s cover as a style reference for slides made from your own content. Or pick any page below to use its layout as the reference.
Quick Navigation
Tags
Share the slides
Itaú Unibanco Holding S.A. 3Q26 Results: the 27-slide deck used at the public meeting with analysts and investors and the 3Q26 earnings review in São Paulo on November 4, 2026, filed with the SEC as an exhibit to Form 6-K. All amounts are in R$ (Brazilian reais). The deck reports a recurring managerial result of R$12.6 billion (+2.5% vs 2Q26, +6.7% vs 3Q25), a consolidated recurring managerial ROE of 23.6% (24.5% in Brazil), a R$1,544 billion credit portfolio, R$33.3 billion of financial margin with clients, a 37.5% consolidated efficiency ratio and a 12.7% CET1 ratio, then walks through margin, fees, credit quality, expenses, capital, 2026 guidance and a six-part 'competitive advantages' section before an appendix with the full income statement and business-model breakdown.
Detailed view of each slide page, including layout, key content and visual elements.
Cover slide. '3Q26 RESULTS' in large white type at top left, the white rounded-square Itaú logo at top right, and the meeting line 'Public meeting with analysts and 3Q26 earnings review', 'São Paulo, November 4th 2026', 'Itaú Unibanco Holding S.A.' at bottom right.
Full-bleed black background with a flowing orange dot-matrix wave sweeping across the lower half; title block top left, logo top right, event details right-aligned at bottom.
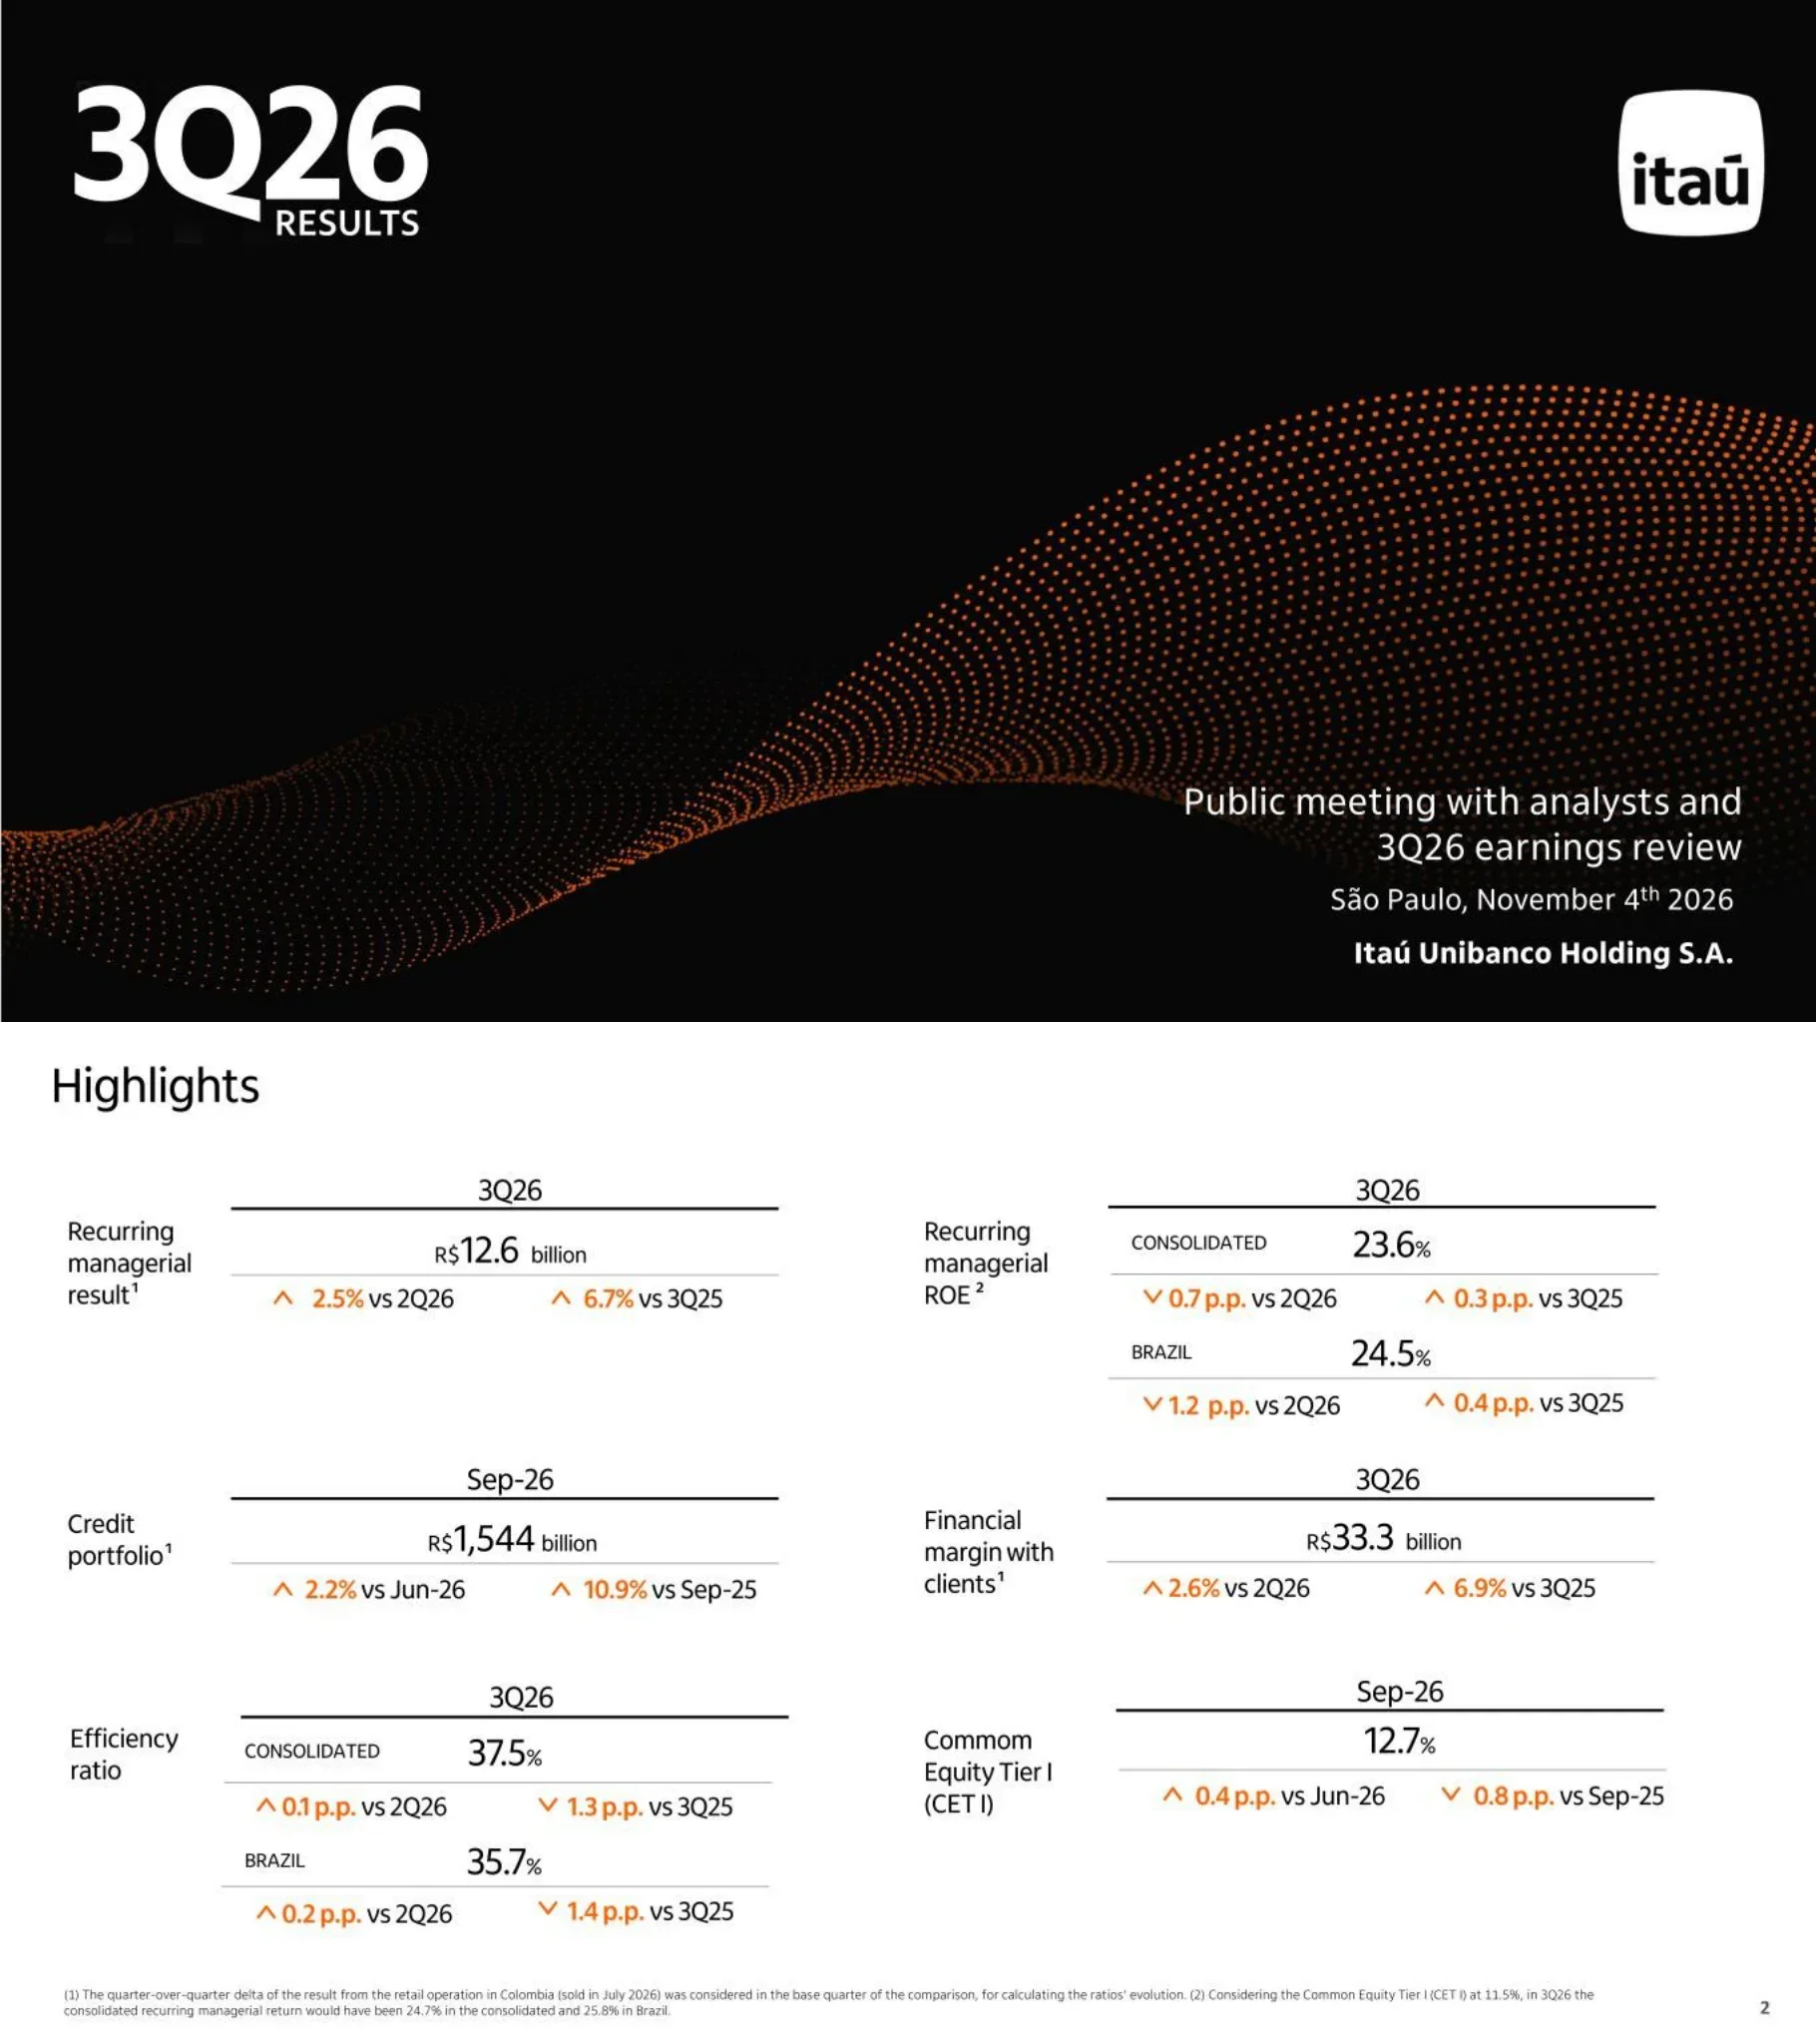
Six headline KPIs for 3Q26. Recurring managerial result R$12.6 billion (+2.5% vs 2Q26, +6.7% vs 3Q25). Recurring managerial ROE 23.6% consolidated (-0.7 p.p. vs 2Q26, +0.3 p.p. vs 3Q25) and 24.5% in Brazil (-1.2 p.p. vs 2Q26, +0.4 p.p. vs 3Q25). Credit portfolio R$1,544 billion at Sep-26 (+2.2% vs Jun-26, +10.9% vs Sep-25). Financial margin with clients R$33.3 billion (+2.6% vs 2Q26, +6.9% vs 3Q25). Efficiency ratio 37.5% consolidated (+0.1 p.p. vs 2Q26, -1.3 p.p. vs 3Q25) and 35.7% in Brazil (+0.2 p.p., -1.4 p.p.). CET1 12.7% (+0.4 p.p. vs Jun-26, -0.8 p.p. vs Sep-25). Footnotes: quarter-on-quarter deltas treat the result of the Colombian retail operation (sold in July 2026) as part of the base quarter; with CET1 at 11.5%, 3Q26 recurring managerial return would have been 24.7% consolidated and 25.8% in Brazil.
Two-column grid of six KPI blocks. Each block has a left-hand label, a period header over a rule, the headline figure, and two orange up/down arrow deltas underneath. Footnotes in small type along the bottom.
Loan book table in R$ billion, Sep-26 vs Jun-26 vs Sep-25. Individuals 500.4 (+2.7% QoQ, +9.6% YoY): credit card 153.4, personal 69.0, payroll 84.2, auto 35.0 (-0.1%, -3.6%), mortgage 158.8 (+4.4%, +15.8%). Very small, small and middle market 320.4 (+4.2%, +15.1%). Corporate 479.4 (+1.0%, +9.5%). Total Brazil 1,300.2 (+2.4%, +10.9%). Latin America 244.2 (-3.5%, +6.4%). Total 1,544.4 (+1.4%, +10.2%); ex-FX total growth +1.8% QoQ and +10.4% YoY. Side panel: Personnalité + Uniclass credit card +4.3% / +16.3% and auto +3.6% / +9.8%; leader in private payroll loans with portfolio +11.6% QoQ and +93.7% YoY; largest private bank in mortgage with R$41 billion trailing 12-month origination and 56% market share among private banks; SME government-sponsored facilities 9M26 leader in origination (+8.0% / +32.4%); portfolio growth ex-Colombia sale: Latin America +0.8% / +11.1%, total +2.2% / +10.9%.
Wide data table on the left two-thirds with an orange header row and shaded delta columns, totals highlighted in orange; narrow right-hand column of stacked mini-tables and callouts.
Waterfall in R$ billion from 2Q26 32.6 to 3Q26 33.3: Colombia retail -0.1 gives 2Q26 ex-Colombia 32.5; working capital and others 2Q26 -3.9 leaves spread-sensitive operations 2Q26 of 28.5; then average volume +0.4, product mix -0.4, spreads and liabilities margin -0.1, calendar and working days +0.4, Latin America and others +0.3 bring spread-sensitive operations to 29.0 in 3Q26; working capital and others 3Q26 +4.2 gives 33.3. Brackets above: +R$0.7 bn (+2.2%) total, +R$0.8 bn (+2.6%) ex-Colombia, +R$0.5 bn (+1.8%) on spread-sensitive operations. Below, annualized average margin, 3Q25 to 3Q26: consolidated margin with clients 9.2%, 9.1%, 9.1%, 9.1%, 9.0% and risk-adjusted 6.3%, 6.2%, 6.1%, 6.2%, 6.1%; Brazil 10.1%, 10.0%, 10.0%, 10.0%, 9.9% and risk-adjusted 6.8%, 6.8%, 6.6%, 6.7%, 6.6%.
Top half: horizontal waterfall with black anchor bars, orange subtotal bars and red/green delta bars, bracketed growth labels above. Bottom half: two side-by-side five-quarter line charts (orange vs blue lines).
Stacked bars in R$ billion, 3Q25 to 3Q26, split into Brazil, Latin America and capital index hedge. Totals 0.9, 0.6, 0.8, 0.9 and 1.3. Brazil component 1.3, 1.1, 1.3, 1.4, 1.7; Latin America 0.3, 0.2, 0.2, 0.2, 0.3; capital index hedge -0.7, -0.7, -0.7, -0.7, -0.6.
Single five-period stacked column chart centred on the slide, with positive stacks above a zero line and the negative hedge segment below; legend at upper left.
Fee table in R$ billion, 3Q26 / 2Q26 / 3Q25 / 9M26 / 9M25. Card issuance 3.5 (+7.1% QoQ, +5.8% YoY); current account for individuals 0.5 (-16.9% YoY; 9M -20.0%); credit operations and guarantees 0.6; payments and collections 1.9 (-5.8% YoY); asset management 2.2 (+17.8% YoY); advisory services and brokerage 0.9 (-26.3% QoQ, -26.6% YoY, but 9M +5.3%); other Brazil 0.4; Latin America 1.0 (+17.2% YoY). Commissions and fees 11.0 (+0.2% QoQ, -0.1% YoY; 9M26 33.1, +1.5%). Insurance, pension plans and premium bonds 3.0 (9M +8.7%). Commissions and insurance 14.1 (-0.2% QoQ, +0.2% YoY; 9M26 42.2 vs 41.0, +3.0%). Asset management includes fund and 'consórcio' management fees; insurance result is net of retained claims.
Full-width table with an orange header, quarterly and nine-month column groups, grey-shaded delta columns, bold subtotal rows and an orange grand-total row.
Four NPL line charts, Jun-24 to Sep-26, without securities. 15-90 day NPL consolidated: Latin America falls from 2.5% to 1.9% (sale of assets impact -0.14 p.p.), total around 1.7%-2.3% ending 1.7%, Brazil ending 1.7%. 90-day NPL consolidated: Brazil 3.0% in Jun-24 dropping to about 2.0%-2.1% and ending 2.1%; total 2.0%; Latin America 1.1% (-0.06 p.p. impact). Brazil 15-90 day: individuals around 3.0% (3.0% at Sep-26), SMEs 1.4%, corporate 0.02% (with a 1.0% spike in Sep-25). Brazil 90-day: individuals 3.7% (-0.02 p.p. impact), very small/small/middle market 2.1% (-0.05 p.p.), corporate 0.02%. Footnote: in 3Q26 Itaú sold loans with low recovery probability, without risk retention, that would have been over 90 days overdue: R$94 million individuals, R$140 million SMEs, R$17 million Latin America; the Colombian retail sale was also adjusted for.
2x2 grid of multi-series line charts with labelled data points; dark-blue callout tags showing the asset-sale impact; legends to the right of each row.
Stage ratios under Brazil's CMN Resolution 4,966 (IFRS 9-aligned), Mar-25 to Sep-26, for total, individuals, companies and Latin America. Stage 2 portfolio at Sep-26: individuals 7.3%, total 4.0%, Latin America 3.9%, companies 1.9%. Stage 3 portfolio: individuals 5.9%, total 4.0%, Latin America 3.4%, companies 3.0%. Stage 2 coverage: individuals 25.9%, total 22.4%, companies 19.6%, Latin America 13.8%. Stage 3 coverage: individuals 58.7%, total 52.5%, companies 49.5%, Latin America 39.2%. Most series drift modestly lower over the seven quarters.
2x2 grid of seven-period line charts with labels on every point, single shared legend at the bottom.
Cost of credit (expected loss expenses + recovery of loans + discounts granted) in R$ billion, 1Q25 to 3Q26: 9.5, 9.4, 9.4, 9.7, 10.0, 10.1, 10.4, with annualized cost of credit / loan portfolio flat at 2.7% in every quarter. Renegotiated portfolio (credit and securities), Mar-25 to Sep-26: 40.1, 38.8, 38.4, 35.1, 34.8, 36.3, 37.0 R$ billion, of which restructured 23.7, 22.6, 22.0, 18.3, 18.0, 19.0, 19.3; renegotiated / total portfolio 3.2%, 3.1%, 3.0%, 2.6%, 2.6%, 2.6%, 2.6%.
Two stacked chart rows, each a seven-period column chart with a ratio line floating above it; descriptive labels and legends on the left.
Over-15-day NPL for individuals since Dec-19: Itaú at 6.7% in Sep-26 versus 13.1% for the market ex-Itaú (both started near 7.9% and 10.0%). Over-15-day overdue change vs Dec-19 by product (market ex-Itaú vs Itaú): personal loans 17.2% (+2.6 p.p.) vs 9.4% (-0.2 p.p.); credit card 14.8% (+3.1 p.p.) vs 6.6% (-0.6 p.p.); auto 13.9% (+3.6 p.p.) vs 9.7% (+0.9 p.p.); private payroll 18.9% vs 6.9%. Stages 2 and 3 portfolio / over-15-day overdue balance: 240% at Sep-26. Provision table by overdue days: Itaú individuals ex-mortgage 4% performing, 58% at 31-60, 63% at 61-90, 66% at 91-120, 69% at 181-210, 100% from 331 days; versus BCB Resolution 352 minimums for S1-S3 (50%, 60%, 77%, 81%, 100% from 91 days) and S4-S5 (2%, 15%, 38% for early buckets).
Upper left: long-run dual line chart. Upper right: paired grey/orange columns by product with delta labels and a black-and-white KPI box (240%). Bottom band: full-width orange-header provisioning table.
Over-15-day NPL for SMEs and corporate since Dec-19: Itaú 2.9% at Sep-26 (from 3.3%) versus market ex-Itaú 5.8% (from 4.0%). SMEs collateralized portfolio rose from 36% (Dec-19) to 58% (Sep-26) overall, and from 37% to 72% for very small and small companies. Corporate: portfolio index 100 to 209; concentration of the 10 largest exposures down from 20% to 14%; investment-grade share up from 69% to 78% (internal criteria). Corporate Chapter 11 (Brazilian judicial or extrajudicial reorganization): share 2.3% in corporate and 4.3% in agribusiness; for the top 5 cases with approved plans, provision before filing was 4x the incurred loss.
Split slide: white left half with a long-run dual line chart; light-grey right half with three stacked panels (mini slope charts, before/after boxed bars, and a two-column stat panel).
Expense table in R$ billion: commercial and administrative (6.7), transactional (4.2), technology (3.3, +4.7% QoQ), other (0.8, +39.7% YoY); total Brazil (15.0), +2.8% QoQ, +1.5% YoY; Latin America (2.2); non-interest expenses (17.1), +2.4% QoQ, +1.7% YoY; 9M26 (50.0) vs 9M25 (48.5), +3.1%. Efficiency ratio 2Q24 to 3Q26: consolidated 37.7%, 39.3%, 39.6%, 37.0%, 38.0%, 38.8%, 38.3%, 37.1%, 37.4%, 37.5%; Brazil 36.2%, 37.9%, 37.4%, 35.1%, 36.3%, 37.1%, 36.4%, 34.9%, 35.5%, 35.7%. Nine-month view: consolidated 38.0% (9M25) to 37.3% (9M26), Brazil 36.2% to 35.4%.
Top: orange-header data table with quarterly and nine-month columns. Bottom: ten-quarter dual line chart with a shaded 9M25/9M26 inset and pill-shaped legend labels.
CET1 bridge from Jun-26 12.3%: net income for the quarter +0.8%, dividends and interest on own capital -0.1%, risk-weighted assets (including prudential and equity adjustments) -0.4%, to 12.7% CET1 at Sep-26. Adding 1.5% of Additional Tier 1 gives Tier I capital of 14.2%.
Single waterfall chart with black start and end bars, a green positive step and red negative steps; the final bar is stacked with an orange AT1 segment; legend centred below.
Previous vs new 2026 guidance. Total credit portfolio growth 5.5%-9.5% (Brazil 6.5%-10.5%): maintained. Financial margin with clients growth 5.0%-9.0%: maintained. Financial margin with the market R$2.5-5.5 bn: maintained. Cost of credit R$38.5-43.5 bn: maintained. Commissions and fees plus insurance results growth 2.0%-5.0%: maintained. Non-interest expenses growth 1.5%-5.5%: maintained. Effective tax rate revised from 29.5%-32.5% to 28.0%-29.0%.
Three-column guidance table (metric, previous, new) with ruled rows; the 'New' column sits on a pale blue rounded panel; ranges highlighted in orange.
Section opener. 'Customer centricity' sits at the centre of six orbiting pillars: culture and long-term vision; talent pool and execution capability; modern platform and data; balance sheet strength; results diversification; efficiency and value creation.
Centred hub-and-spoke diagram: six orange rounded-square tiles arranged in a hexagon around a central text label, linked by thin grey curved arcs.
Customer metrics: +12 points evolution of Itaú consolidated NPS between 2021 and 2026; about 80 points digital-channel NPS for individuals and companies (apps and internet banking); 83% of companies' segments and 80% of individuals' segments with NPS at the excellence level (above 70 points).
Left: the hub diagram greyed out with the centre highlighted in orange. Right: 2x2 grid of large orange stat figures with bold captions.
An ever-evolving culture timeline: 'Our culture' (2008-2021), 'Itubers culture' (2021-2025), new pillar (2025); eNPS of 85 points, in the excellence zone. Itubers culture pillars: we put the client first; we don't have all the answers; we have each other's back; we are driven by results; we treasure diversity and inclusion; for us ethics are non-negotiable; and the new pillar, we make choices and decisions.
Left: hub diagram with the culture tile highlighted. Right: rounded card with a three-dot timeline, an orange eNPS badge and a three-column grid of pillar statements in bold orange and navy type.
Future-ready talent: technical expertise and critical thinking to frame the right problems and guide the use of AI; 95K+ applicants for the 2026-2027 trainee programme. Talent rankings: recognized in Fast Company's international financial services-fintech categories, 1st in Brazil on LinkedIn Top Companies for the 8th consecutive year, 6th consecutive year among the top 5 Great Place to Work companies in Brazil, and in the Lugares Incríveis para Trabalhar ranking since its 2020 inception. Ability to execute: efficiency programme cut the efficiency ratio by 7 pts (9M26 vs 9M21); agribusiness project with a R$143 bn loan portfolio (Sep-26), growing 20% a year (CAGR 2026 vs 2021); One Itaú with 15 million customers migrated and NPS of 80; acquiring turnaround over the last four years with +5 p.p. market share, NPS up 40 points and profitability growing 7x more than TPV.
Left hub diagram with the talent tile highlighted. Right: two stacked cards, the upper with text plus four award logos, the lower with a three-column row of orange headline stats and a second row for the acquiring turnaround.
Three columns. Technology embedded in the business: 21k+ employees in cross-functional teams organized around the customer journey and 2.9K+ cross-functional squads. Modern platform and AI-ready data: 92%+ of generative AI initiatives in use (9M25 vs 9M26), 50% reduction in unit cost per token (1Q25 vs 3Q26), 100% modernized and cloud-based by 2028. Connection to the technology frontier: acquisition of NeoSpace to develop generative AI foundation models and personalization; Instituto de Ciência e Tecnologia Itaú with 39+ published patents including AI innovations; corporate venture capital stakes including PsiQuantum, Simile and Endeavor Catalyst plus 10 other investees.
Left hub diagram with the platform tile highlighted. Right: three equal columns with coloured header blocks (orange, royal blue, dark green) over stacked stat sections and partner logos.
Tangible equity R$138.7 billion (+6.7% vs 2Q26, +4.3% vs 3Q25), 60.6% of consolidated equity of R$228.9 bn, with goodwill and intangibles 8.2% and net deferred tax credits 31.2%. Deferred tax credits of R$71.5 bn: tax loss carryforwards 2.0% (R$1.4 bn, risk weight 1,250%), other temporary differences 24.8% (RWF 250%), expected loss 73.2% (R$52.3 bn, RWF 100%). Labor, civil and tax provisions R$16.9 billion (-2.1% vs 2Q26, -3.4% vs 3Q25): labor R$9.6 bn, civil R$3.0 bn, tax R$4.3 bn; coverage of the last 12 months' payments 3.1x labor and 1.9x civil (2021-2026 averages 2.9x and 2.3x). Balance sheet quality: LCR 205.8% (+3.8 p.p. vs Jun-26), NSFR 123.7% (+1.6 p.p.), loan portfolio / funding 78.6% (-1.7 p.p.).
Left hub diagram with the balance-sheet tile highlighted. Right: three stacked horizontal cards: equity composition with stacked percentage bars, a provisions mini-table, and a three-stat liquidity row.
Credit portfolio at Sep-26 by business: wholesale Brazil R$665 bn (43.1%), retail Brazil R$635 bn (41.1%), Latin America R$244 bn (15.8%). Recurring managerial result 9M26: retail Brazil R$16.2 bn (43.4%), wholesale Brazil R$14.5 bn (38.8%), corporation plus activities with the market R$4.2 bn (11.2%), Latin America R$2.5 bn (6.6%). Leadership among private players in credit card issuance, asset management, payments and acquiring, and investment banking, among others.
Left hub diagram with the diversification tile highlighted. Right: two donut charts side by side on a card, with a row of four line icons with captions in a second card below.
Nine-month trends, 9M21 to 9M26: ROE 19.0%, 20.7%, 20.9%, 22.2%, 22.9%, 24.1%; efficiency ratio 44.4%, 41.2%, 39.8%, 38.1%, 38.0%, 37.3%. Recurring managerial result in R$ billion split into cost of capital and value creation: 19.7 (12.8 + 6.9), 23.1 (15.1 + 8.0), 26.2 (17.3 + 9.0), 30.5 (18.1 + 12.4), 34.5 (21.2 + 13.3), 37.3 (21.5 + 15.8). CAGR: recurring result +14%, value creation +18%, cost of capital +11%.
Left hub diagram with the efficiency tile highlighted. Right: card with a diverging two-line chart (ROE rising, efficiency falling) above a six-period stacked column chart with a CAGR column at the right.
Repeat of the cover slide, closing the main presentation before the appendix: '3Q26 RESULTS', Itaú logo, 'Public meeting with analysts and 3Q26 earnings review', São Paulo, November 4th 2026, Itaú Unibanco Holding S.A.
Same as page 1: black background, orange dot-matrix wave, title top left, logo top right, details bottom right.
Appendix divider slide reading 'Additional information', with the Itaú logo.
Black background with a faint orange dot pattern fanning out on the right; two-line title at top left, logo at top right; rest of the slide left empty.
Managerial income statement in R$ million, 3Q26 / 2Q26 / 3Q25 / 9M26 / 9M25. Operating revenues 49,152 (+2.4% QoQ, +5.5% YoY); managerial financial margin 34,611, of which margin with clients 33,286 and with the market 1,325 (+42.3% QoQ); commissions and fees 11,048; revenues from insurance 3,494. Cost of credit (10,415), comprising expected loss expenses (10,720), discounts granted (1,260) and recoveries 1,565. Retained claims (479). Other operating expenses (20,110), including non-interest expenses (17,129) and ISS/PIS/Cofins and other taxes (2,981). Income before tax and minority interests 18,148; income tax and social contribution (5,192); minority interests (339). Recurring managerial result 12,617 (+1.7% QoQ, +6.2% YoY); 9M26 37,305 vs 34,513 (+8.1%).
Full-width income-statement table with an orange header, quarterly and nine-month column groups, shaded variance columns, bold section rows and an orange bottom line.
Recurring result by business in R$ billion for 9M26 vs 9M25: total, credit, trading, insurance and services, and excess capital. 9M26: operating revenues 144.0 (credit 81.3, trading 2.9, insurance and services 58.3, excess capital 1.5); recurring managerial result 37.3 (14.6, 1.5, 20.0, 1.2); average regulatory capital 206.4 (127.5, 8.1, 55.5, 15.3); value creation 15.8; recurring managerial ROE 24.1% overall, 15.3% credit, 24.2% trading, 47.9% insurance and services, 10.8% excess capital. 9M25: recurring result 34.5, ROE 22.9% (credit 14.3%, trading 30.3%, insurance and services 47.8%, excess capital 9.8%). The delta panel shows ROE +1.2 p.p. overall, +1.0 p.p. credit, -6.1 p.p. trading.
Three side-by-side table blocks (9M26, 9M25, delta), each with an orange header row of five columns; P&L rows above, capital and ROE rows below, totals in orange.
Back cover repeating the opening design: '3Q26 RESULTS', Itaú logo, 'Public meeting with analysts and 3Q26 earnings review', São Paulo, November 4th 2026, Itaú Unibanco Holding S.A.
Identical to pages 1 and 23: black field, orange dot wave, title block and logo at top, event details bottom right.
Common questions about this slide and the underlying presentation content.
It is the 27-slide 3Q26 results deck Itaú Unibanco Holding S.A. used at its public meeting with analysts and investors in São Paulo on November 4, 2026. It covers highlights, the credit portfolio, financial margins, fees and insurance, credit quality, expenses, capital, 2026 guidance, a strategy section on competitive advantages, and an appendix with the income statement and business-model tables.
Itaú Unibanco filed the presentation with the SEC as an exhibit to Form 6-K, the form foreign private issuers use to furnish material information to the SEC. All amounts are in R$ (Brazilian reais), mostly in billions; the appendix income statement is in R$ million. The slides were filed as images, so some very small footnote text can be hard to read at web resolution.
Recurring managerial result of R$12.6 billion (+2.5% vs 2Q26, +6.7% vs 3Q25), consolidated recurring managerial ROE of 23.6% (24.5% in Brazil), credit portfolio of R$1,544 billion (+10.9% year on year), financial margin with clients of R$33.3 billion, a 37.5% efficiency ratio and a 12.7% CET1 ratio. The quarter-on-quarter comparisons adjust for the sale of the retail operation in Colombia in July 2026.
Only one line changed. Guidance for credit portfolio growth, financial margin with clients, financial margin with the market, cost of credit, commissions and insurance, and non-interest expenses was maintained. The effective tax rate range was lowered from 29.5%-32.5% to 28.0%-29.0%.
15-90 day and over-90-day NPL ratios by segment, Stage 2 and Stage 3 portfolio and coverage ratios under Brazil's Resolution 4,966, cost of credit (R$10.4 billion in 3Q26, 2.7% of the portfolio), the renegotiated portfolio, Itaú-vs-market over-15-day NPL comparisons for individuals and companies, and a provisioning matrix compared with BCB Resolution 352 minimums.
Yes, as a structural reference. It is a good model for a bank or financial-services results deck: a KPI highlights page, variance tables with QoQ/YoY/nine-month columns, waterfall bridges for margin and capital, trend-line dashboards for asset quality, a previous-vs-new guidance table and a reusable hub-and-spoke strategy diagram. Replace the content and Itaú branding with your own; the original remains Itaú Unibanco's material.
This gallery entry offers the original PDF of the deck. You can download the PDF, and use 2Slides to build an editable presentation with a similar structure for your own company or analysis.
Original slide images as furnished by Itaú Unibanco Holding S.A. on Form 6-K

Create Your Own Slides
Turn your ideas into professional presentations in seconds with 2slides AI.
Reference professional designs, choose your style, and generate slides with perfect text rendering. Powered by Nano Banana—start creating your presentation now.
Your AI Agent for slides. Save time, shine faster with intelligent presentation creation.


© 2026 2slides. All rights reserved.