
Part of Investor presentation examples · Japanese investor presentation examples
Isetan Mitsukoshi Holdings H1 FY2026 Earnings Presentation — the Japanese department-store group's (TSE 3099) results briefing for the six months April–September 2026 (fiscal year ending March 2027), covering first-half results, the upward revision of the full-year plan and progress on Phase I of the current medium-term management plan. This is a Japanese-language deck (決算説明会資料) dated 13 November 2026 whose original was published on TDnet (Tokyo Stock Exchange timely disclosure); all text below is translated into English, with yen figures kept in the company's own unit of ¥100 million (億円).
Uses this deck’s cover as a style reference for slides made from your own content. Or pick any page below to use its layout as the reference.
Quick Navigation
Tags
Share the slides
Isetan Mitsukoshi Holdings H1 FY2026 Earnings Presentation — the Japanese department-store group's (TSE 3099) results briefing for the six months April–September 2026 (fiscal year ending March 2027), covering first-half results, the upward revision of the full-year plan and progress on Phase I of the current medium-term management plan. This is a Japanese-language deck (決算説明会資料) dated 13 November 2026 whose original was published on TDnet (Tokyo Stock Exchange timely disclosure); all text below is translated into English, with yen figures kept in the company's own unit of ¥100 million (億円).
Detailed view of each slide page, including layout, key content and visual elements.
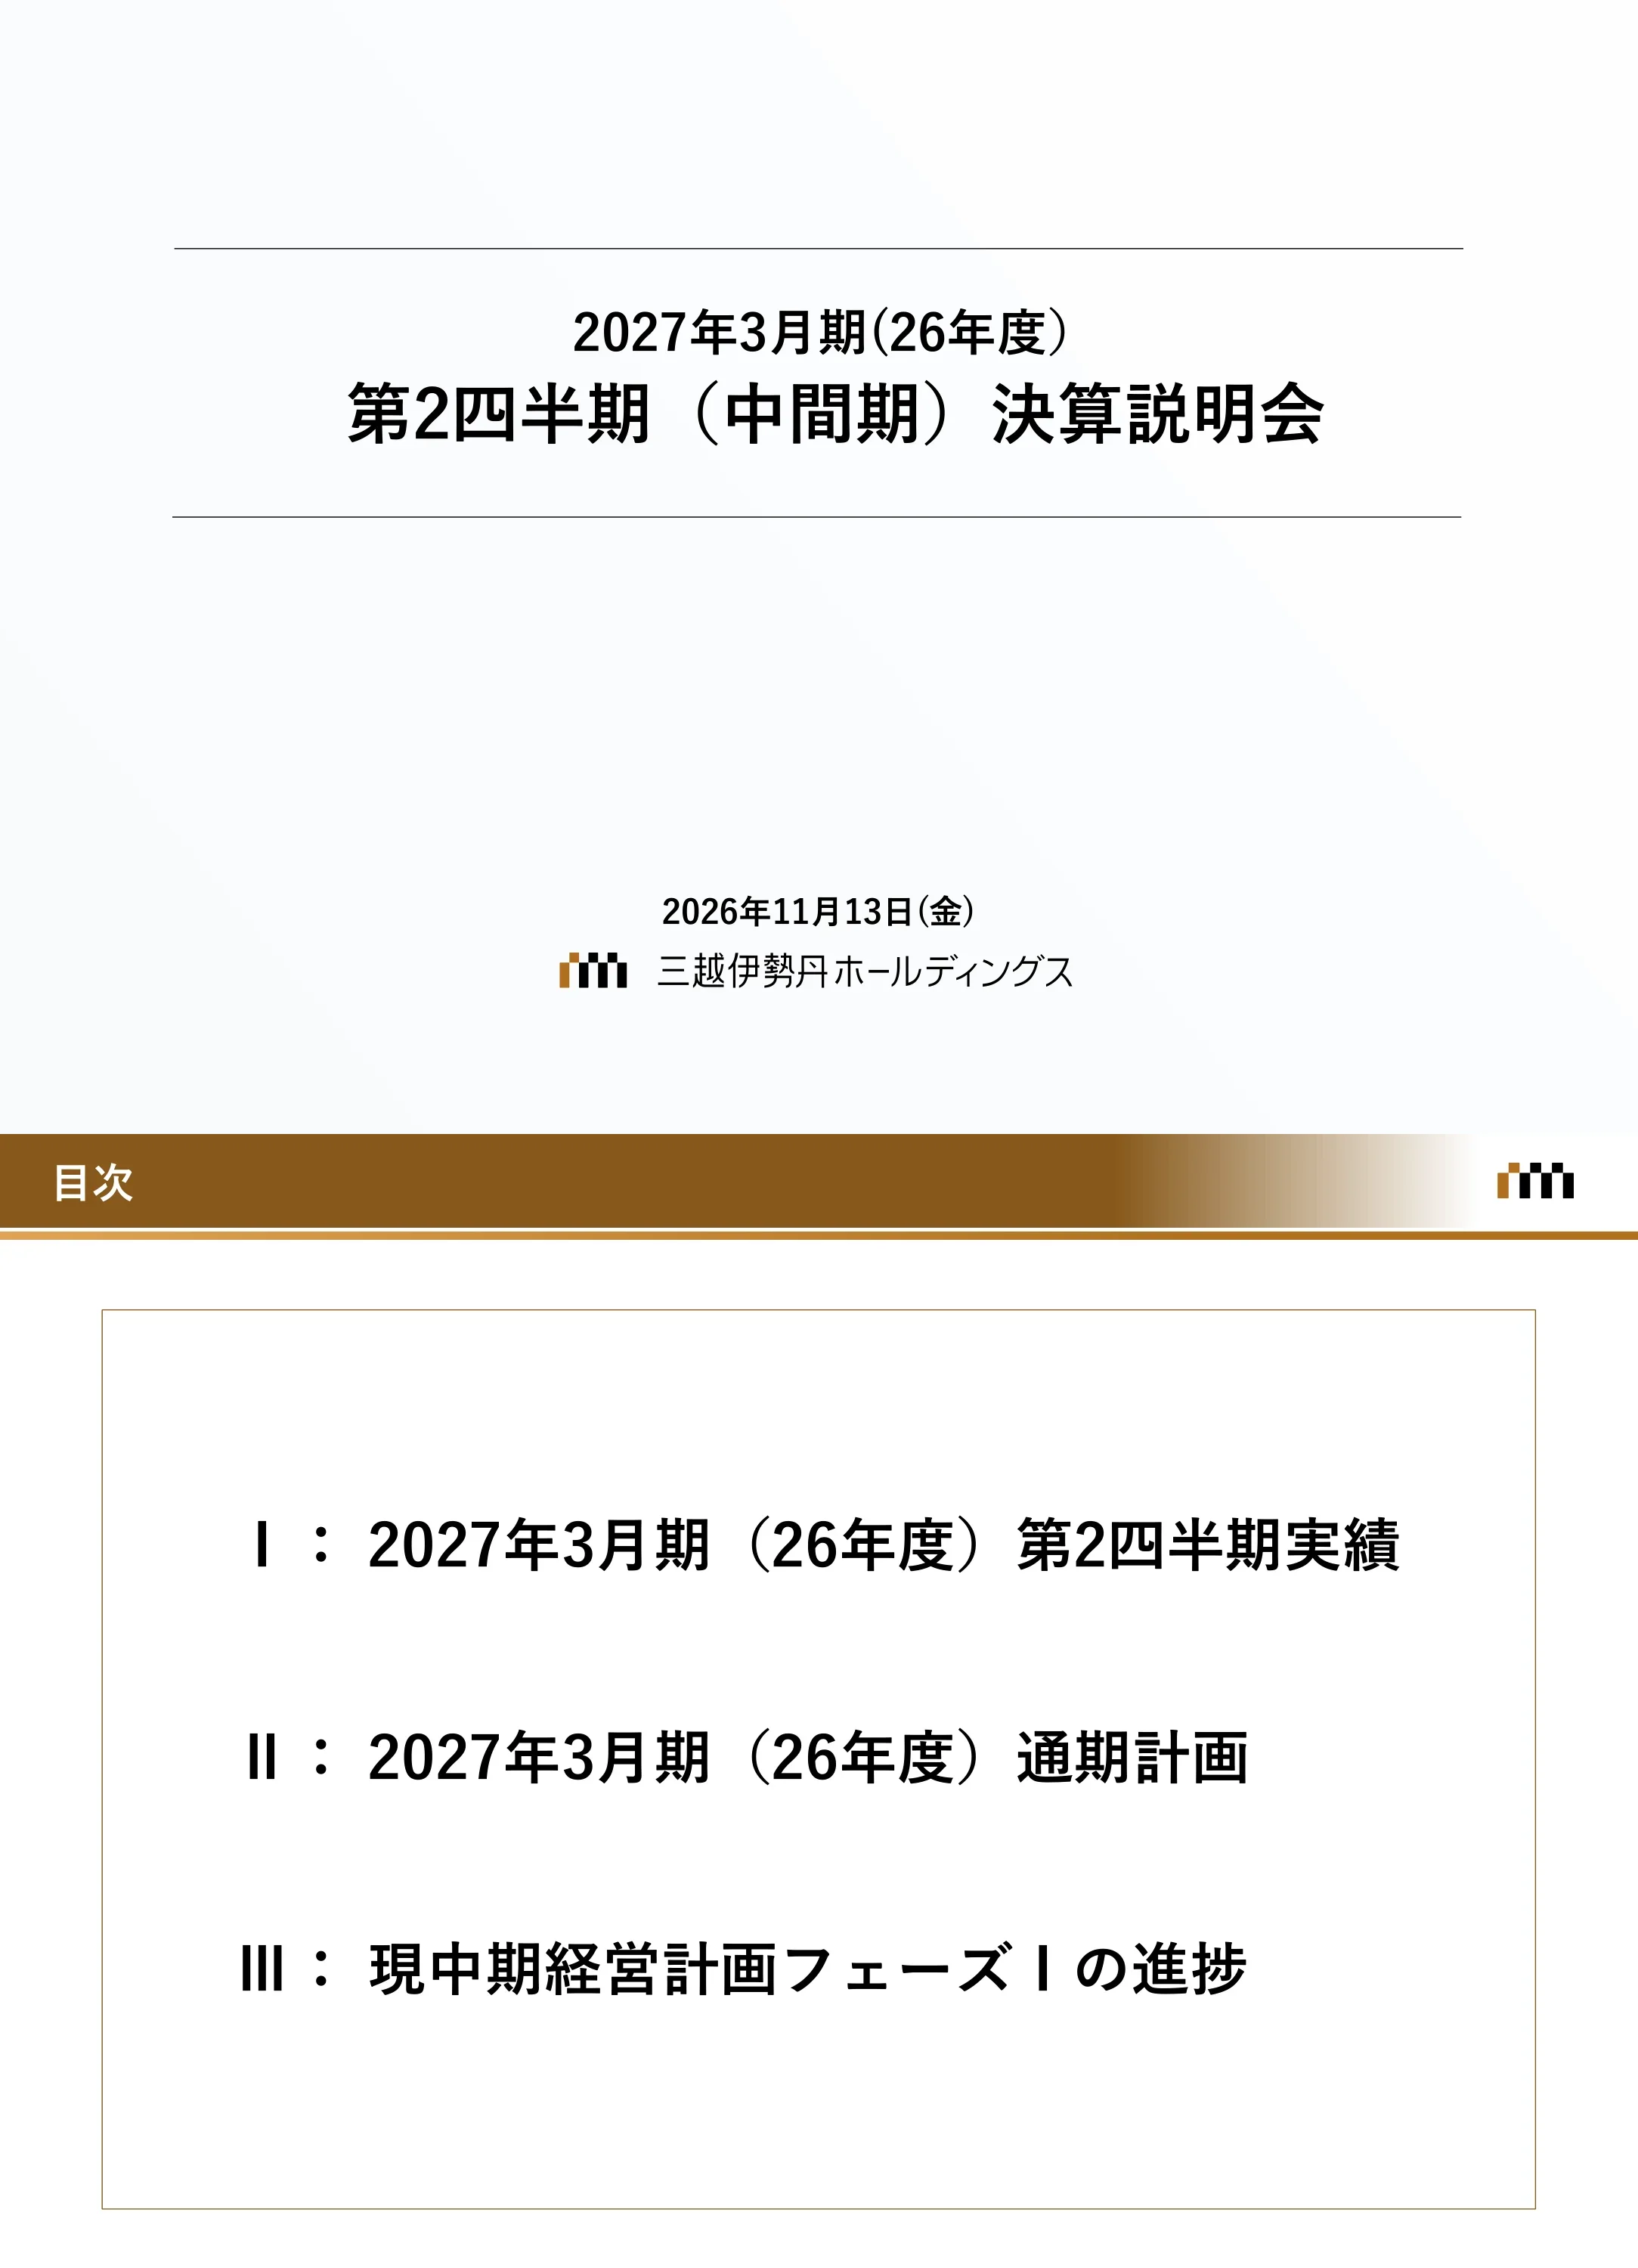
Title page reading 'Fiscal year ending March 2027 (FY2026) — Second Quarter (Interim) Results Briefing', dated Friday 13 November 2026, with the Isetan Mitsukoshi Holdings logo.
Centered title block between two horizontal rules on a near-white background; date and company logo centered at the bottom.
Agenda with three sections: I. FY2026 (year ending March 2027) Q2 results; II. FY2026 full-year plan; III. Progress on Phase I of the current medium-term management plan.
Brown header bar with title 'Contents'; single framed box listing three Roman-numeral items.
Section divider repeating the agenda with item I (FY2026 Q2 results) highlighted and items II and III greyed out.
Same agenda frame as page 2 with the active item in black and inactive items in light grey.
Three key messages: domestic-customer sales grew steadily through deeper relationships with identified customers; overseas-customer sales continued to grow above expectations after Q1, helped by more diverse visitor origins and the company's own CRM measures; with total sales growing and costs controlled as planned, the group achieved record operating profit and net income for a Q2 and for a first half.
Single large bordered text box with three bullet statements; key phrases in red.
H1 (Apr–Sep) in 億円 (¥100 million): gross handling sales (incl. fixed-term tenants) 6,549 (106.6%, +406); total sales 6,356 (106.6%, +394); net sales 2,632 (103.7%, +93); gross profit 1,643 (105.3%, +82); SG&A 1,267 (101.7%, +21); operating profit 375 (119.4%, +61); ordinary profit 400 (120.9%, +69); net income 371 (126.4%, +77). Reference quarters: Q1 operating profit 188 (120.6%), Q2 186 (118.2%); Q1 net income 223, Q2 148 (140.5%). Messages: sales growth led by domestic department stores; SG&A held well below sales growth; operating and net profit at record highs for Q2 and H1.
Grey summary box with three bullets on top; main table for H1 cumulative results on the left and reference Q1/Q2 tables on the right, each with actual, YoY % and YoY difference.
H1 domestic department-store total sales 5,595 億円 (106.2%, +324): domestic customers 4,765 (103.6%), overseas customers 829 (124.1%, +161). Isetan Mitsukoshi (Tokyo stores) total 3,879 (108.4%) — domestic 3,222 (105.9%), overseas 657 (122.5%). Regional companies total 1,715 (101.4%) — domestic 1,543 (99.0%, ▲16), overseas 172 (130.7%). Q1 and Q2 breakdowns shown for reference. Footnote: the overseas-sales capture system changed in FY2026, so FY2025 figures were re-extracted on the new system.
Two-bullet summary box; wide table with H1 cumulative (actual/YoY%/YoY diff) on the left and Q1 and Q2 reference blocks on the right; grey-shaded total rows.
H1 total sales (億円) by store: Isetan Shinjuku 2,118 (110.1%, +193); Mitsukoshi Nihombashi 838 (108.7%); Mitsukoshi Ginza 625 (108.3%); Isetan Tachikawa 137 (96.1%); Isetan Urawa 159 (98.3%); Tokyo five-store total 3,879 (108.4%). Regional: Sapporo Marui Mitsukoshi 277 (101.1%); Sendai Mitsukoshi 114 (98.0%); Nagoya Mitsukoshi 275 (97.7%, affected by remodelling); Niigata Mitsukoshi Isetan 160 (100.8%); Iwataya Mitsukoshi 646 (106.6%); five regional companies 1,475 (102.5%). Gross handling sales also shown (e.g., Shinjuku 2,119).
Two side-by-side tables (Tokyo stores left, regional companies right) with gross handling sales, total sales, YoY % and YoY difference; total rows below each.
H1 SG&A 1,267 億円 (+21 YoY): personnel 436 (+0), advertising 42 (▲0), rent 152 (+3), outsourcing 142 (+4), depreciation 114 (+0), utilities 49 (+1), other 328 (+10). Breakdown of the YoY change: cost-structure reform ▲23, sales-linked +10, strategic spending +7, inflation +23, new consolidation +4, other ▲1. Cost-structure reform is on track against the annual plan of ▲41 億円 (about 56% progress in H1).
Summary box on top; left table of SG&A items with H1 actual and YoY difference; right matrix decomposing the YoY change into six drivers.
H1 (億円): Department stores — total sales 5,869 (106.2%), net sales 2,138, operating profit 308 (+53); Credit, finance & Tomo-no-kai — 188 (103.2%), 176, OP 35 (+6); Real estate — 154 (135.4%), 154, OP 23 (+4); Other — 143 (102.4%), 163, OP 7 (▲3); Total 6,356 (106.6%), 2,632, OP 375 (+61). Commentary: department stores gained 53 億円 from above-plan sales and cost optimisation; in-house credit card usage expanded; real estate absorbed higher costs via steady orders at the interior-construction subsidiary.
Three-bullet segment commentary above a five-row segment table.
Section divider with item II (FY2026 full-year plan) highlighted.
Agenda frame with the active item in black.
Expecting the strong H1 trend to continue in H2, the company raises domestic department-store total sales; operating profit is revised up to 860 億円, achieving the Phase I final-year (FY2027) target of 850 億円 one year early; net income is revised up to 655 億円, which, excluding prior-year special factors (tax-effect accounting etc.), maintains the previous year's record level.
Single bordered box with three bullet statements; revisions in red.
FY2026 plan (億円, YoY %, YoY diff, change vs. Q1-time plan): gross handling sales 14,150 (105.0%, +670, +100); total sales 13,700 (105.4%, +704, +100); net sales 5,630 (103.2%, +173, +10); gross profit 3,490 (103.6%, +122, +30); SG&A 2,630 (102.5%, +62, +10); operating profit 860 (107.5%, +59, +20); ordinary profit 870 (100.5%, +4, +40); net income attributable to owners 655 (86.1%, ▲105, +25). Footnote: prior-year net income included special factors.
Summary box with two bullets; single table with plan, YoY %, YoY difference and difference vs. Q1 plan.
Domestic customers: initial plan maintained given steady H1 and October trends. Overseas customers: full-year plan raised to 116.4% YoY. Full-year (億円): domestic department-store total 12,150 (105.6%, +124 vs. Q1 plan) — domestic customers 10,425 (104.0%), overseas customers 1,725 (116.4%, +124 vs. Q1 plan). Isetan Mitsukoshi total 8,410 (107.4%); regional companies total 3,740 (101.9%). H2 plan: domestic department stores 6,554 (105.2%), overseas 895 (110.1%).
Two-bullet summary; table split into H1 actual, H2 plan and full-year plan blocks for the Tokyo company, regional companies and total, each with domestic/overseas sub-rows.
Plan assumes a steady trend for domestic customers through the year (104.0% YoY) and a continued, if moderated, strong trend for overseas customers in H2 (116.4% YoY). A line chart compares FY2026 (solid) vs. FY2025 (dotted) for domestic (green) and overseas (orange) customer sales across April–March, with event labels for Golden Week, China's National Day holiday, Christmas and Lunar New Year. The chart has no y-axis values, so the plotted levels cannot be read as figures.
Two-bullet summary; quarter labels Q1–Q4 above a month-by-month line chart divided by dotted quarter lines.
Full-year plan total sales (億円): Isetan Shinjuku 4,596 (108.1%, +346); Mitsukoshi Nihombashi 1,795 (106.2%); Mitsukoshi Ginza 1,359 (110.8%); Isetan Tachikawa 304 (97.4%); Isetan Urawa 355 (101.0%); Tokyo five stores 8,410 (107.4%). Regional: Sapporo Marui Mitsukoshi 609 (101.7%); Sendai 249 (97.8%); Nagoya 576 (94.8%, remodel impact); Niigata 348 (102.0%); Iwataya 1,409 (106.5%); five regional companies 3,192 (102.1%).
Same two-table format as page 7, showing full-year plan instead of H1 results.
Full-year SG&A plan revised to 2,630 億円 (+62 YoY), reflecting higher sales-linked costs. Cost-structure reform target revised to ▲46 億円 (▲5 vs. the Q1-time plan). Items: personnel 914 (▲5), advertising 96 (+8), rent 307 (+3), outsourcing 285 (+10), depreciation 231 (+2), utilities 96 (+6), other 701 (+38). Drivers: reform ▲46, sales-linked +31, strategic +24, inflation +43, new consolidation +9, other +2.
Summary box; left item table and right driver-breakdown matrix, mirroring page 8.
Full-year (億円): Department stores — total sales 12,680 (105.2%), net sales 4,590, OP 705 (margin 5.6%, +49 YoY, +15 vs. Q1 plan); Credit/finance/Tomo-no-kai — 396, 366, OP 73 (18.4%, +9, +3); Real estate — 330 (121.4%), 330, OP 46 (13.9%, ▲0, +3); Other — 301, 351, OP 36 (12.0%, +1, ▲1); Total — 13,700, 5,630, OP 860 (6.3%, +59, +20). Operating-profit plans raised for department stores (+15), credit/finance and real estate.
Three-bullet commentary above a segment table with OP plan, OP margin, YoY and Q1-plan difference.
Section divider with item III highlighted.
Agenda frame with active item III.
The previous medium-term plan aimed to dispel concerns about the future of department stores ('department store revival'); the current plan pursues a distinct strategy to secure accelerated growth. Previous-plan concerns (low profitability, external shocks, shrinking population) and results: breakeven ratio 75.7% in FY2024 (▲25.2pt vs. FY2021); identified customers 7.61 million (+3.16 million); identified-customer sales 6,395 億円 (+2,136 億円). Recent investor concerns (overseas-customer volatility, group companies' contribution to LTV, the next plan) are answered with actions: upgrading individual-customer process activities and extending them to overseas customers, expanding 'group federation' activities, and long-term 'machika' (town-making) real-estate development.
Grey header box; left column of past concerns and results, large arrow, right column of recent concerns and current actions.
Uses the scarce asset of a 'customer base seeking high-sensitivity quality' through people, systems and digital. Flow: attracting customers to special department stores → identification via cards and apps → accumulated customer data and personal relationships → three uses (cost/investment optimisation, LTV expansion, worldwide business opportunities). FY2026 H1 status: SG&A-to-sales ratio 21.2% (▲1.2pt) and operating margin 5.4% (+0.6pt) for domestic department stores; three flagship remodels at 114% sales YoY; identified customers 8.67 million (+0.73 million); identified-customer sales 106%; group customers buying ¥3 million+ 116%; overseas app members 1.28 million; overseas app sales 149%; overseas gaisho (account sales) handling 162%.
Left-to-right process diagram with vertical text banners, icons, red-outlined initiative boxes and right-hand results panels; long-term box at bottom.
Operating profit has grown steadily in proportion to identified customers: 763 億円 (FY2024 actual), 800 (FY2025 actual), 860 (FY2026 plan), exceeding the original FY2027 plan of 850 億円 a year early. Identified-customer sales: 6,395, 6,786 and 6,960 億円. The company plans to strengthen identification of overseas customers for strong growth; the FY2027 plan will be disclosed in May 2027. The identified-customer count line and FY2027 bars carry no data labels, so those values are not legible.
Summary bullets above a combined bar-and-line chart with two y-axes (億円 left, 10,000 people right) and FY2024–FY2027 on the x-axis; Phase I bracket highlighted in yellow.
Per-customer spending rises with relationship depth. Domestic customers (FY2026 H1, half-year spend per person): stepping from non-identified to MI app members (~2x), MI card members (~3x), MI W members (app + card, ~2x) and domestic gaisho customers (~2x). Overseas: gaisho customers spend roughly 6x tax-free customers; identified overseas customers are to be created from FY2027 via two-way communication. October 2026 overseas sales grew strongly on diverse visitor origins, apps and gaisho. Bars have no absolute values; only the multiples are given.
Summary box above two side-by-side bar charts (domestic left, overseas right) with red curved arrows labelled with multiples.
FY2026 table — H1 actual / YoY H1 diff / full-year plan: gross handling sales 6,549 / +406 / 14,150 億円; total sales 6,356 / +394 / 13,700; SG&A 1,267 / +21 / 2,630; operating profit 375 / +61 / 860; net income 371 / +77 / 655; ROE planned at 10.7% (0.6pt above the May 2026 announcement). Customer KPIs: identified-customer sales 3,292 億円 (+191) vs. 6,960 full-year; group ¥3 million+ purchaser sales 936 億円 (+128) vs. 2,520 full-year.
Summary box; KPI table split into financial and customer KPI groups with red boxes around ROE and customer-KPI growth.
H1: domestic department-store foot traffic held at 101% YoY via 'high-sensitivity quality' remodels. Isetan Shinjuku's Western-confectionery remodel lifted like-for-like sales from 86% (April, construction-affected) to 98%, 121%, 143%, 142% and 142% (May–September) across three remodel phases. Next: food as the core draw, world-class brand development and an own supply chain to capture both department-store and group-company margins; a food SPA brand with French chocolatier Bernachon opens on 17 March 2027 in the Isetan Shinjuku main building B1.
Two panels: left H1 results with a foot-traffic box and a monthly line chart; right future plans with a stacked-bar diagram comparing general vs. own supply-chain profit structure and a launch announcement box.
FY2026 remodel investment for the three flagship stores about 60 億円; remodelled like-for-like sales 114% YoY. Isetan Shinjuku: PB and re-edit of Western confectionery (45 brands by March 2027), then a fragrance remodel with 60+ brands. Mitsukoshi Nihombashi: VIP salon-style boutiques (Delvaux on 3F, then Rolex on 1F) and food re-organisation (confectionery refreshed for the first time in 19 years; fresh grocery and experiential eat-in next). Mitsukoshi Ginza: luxury boutiques and global-scale proposals, then an immersive event floor with culture, IP and food events.
Header banner with investment figure; table with store photos and concepts in rows, H1 remodels and H2-onward remodels in columns.
H1 results: identified customers 8.67 million (109%); gold card members 320,000 (103%, +7,510); basic card members 170,000 (217%); overseas app members 1.28 million (overseas app + WeChat). Next: full card lineup with the top-tier MICARD+ THE ONE (issuance from February 2027) and a two-tier point system from February 2027 splitting points into department-store and credit points (e.g., MICARD+ GOLD 10% total, THE ONE 11% total).
Left panel of KPI tables; right panel with four card images and a point-rate comparison table (current vs. new).
H1: GCP (Group Customer Program) platinum customers 584 億円 sales (106%); premium diamond customers 653 億円 (119%); regional base-network handling 81 億円 (132%); federation contribution 1,187 億円 (104%). Next: app-based communication — expanded personal marketing (started), store-information AI assistant (from FY2026 H2), purchase requests (started); integrating related-business IDs into the Isetan Mitsukoshi ID — Nikko Travel (planned March of FY2026), MI Food Style (FY2027 onward).
Left results tables; right schedule tables in yellow and light blue.
H1: domestic gaisho customer handling 1,186 億円 (105%); overseas gaisho 131 億円 (162%). ONE Group gaisho × Tanseikai invitation event held twice yearly at Isetan Shinjuku; the 4 September 2026 Tanseikai generated 54 億円, above the 28 億円 first-day New Year sale of 2 January 2008. Next: a new hospitality event 'TANSEIKAI THE NIGHT' in February 2027 for top domestic and overseas customers, held the night before Tanseikai, under the mission 'Moving hearts through the power of people'.
Left results table and event-comparison boxes; right event-concept table.
Funnel of five stages: (1) revival phase — from 'building' business to 'individual-customer' business; (2) current plan Phase I (FY2025–27) — transformation via 'federation'; (3) Phase II (FY2028–30) — evolve process activities and start 'machika' preparation; (4) fruition phase (FY2031+) — realise Isetan Mitsukoshi 'machika'; (5) long term — an outstanding global individual-customer business. Shift from 1:1 to 1:20 proposals across department store, finance, real estate, related and new businesses, aiming to create retail-media revenue.
Left inverted funnel with numbered phases; right panel with 'until now/from now' comparison and overlapping-circle Venn diagram centred on 'group federation'.
About 70% of owned real estate (site area about 130,000 m²) will be held to pursue the essence of department stores and increase asset value; for the remaining 30%, structural reform from a scientific viewpoint will weigh value-up (redevelopment, about 8 assumed projects) against sale, to expand earnings or improve efficiency — e.g., conversion to hotels and other uses, and right-sizing store scale.
Brown-headed process flowchart: 70%/30% split bar feeding into hold, redevelopment and sale boxes, then outcome boxes and rounded explanation panels.
The group's first hotel development, integrating five company-owned office buildings, to attract high-quality customers from around the world. Opening planned for 2032; a hotel brand making its first entry into Japan, with a façade linked to Isetan Shinjuku. Disclosed content may change with business or economic conditions; exterior images are illustrative.
Title with site map inset; brown banner; area map with circle around Shinjuku 3-chome station area; two architectural renderings (north side and east entrance side).
Layer 0: creating (real-estate) capital through scientific structural reform. Layer 1: property profit (hotel operation). Layer 2: machika operation/federation profit (payments, travel referrals, interiors). Layer 3: mutual customer referral profit with the department store (pre/post-opening premium tours). Layer 4: retail-media profit (+α). Aim: returns well above the cost of shareholders' equity and well above land-sale gains, turning hotel stays into a top buying experience.
Stacked layer diagram from 0 to 4 with an upward 'profit accumulation' arrow and a horizontal 'value amplification' arrow; result boxes on the right.
Build an 'individual-customer IT platform' connecting domestic/overseas touchpoints with group content and data, using AI × people. Four platforms: membership integration (who), content (what), EC/app (where), data (how). Growth steps: Phase I (FY2025–27) platform build-out, e.g., unified domestic/overseas department-store ID and AI prediction models for gaisho; Phase II (FY2028–30) group-wide ID, content accumulation, personalisation, AI marketing; fruition phase (FY2031+) machika touchpoints, external content and new value creation.
Summary box; matrix table with four platform rows and three phase columns.
Clarify the desired talent profile and promote growth via training and exchange. Talent types: group management talent; 'trinity' individual-customer talent combining the power to grasp (customer understanding), create (value creation) and connect (experience design); and business specialists. Phased: Phase I — systematise individual-customer talent development and cross-business mobility; Phase II — develop talent who find opportunities across the value chain; fruition phase — create new businesses and markets.
Left panel with nested talent boxes and a three-row definition table; right panel with three phase columns in vertical text separated by grey chevrons.
Four materialities progressing, including inclusion in the FTSE4Good Index Series. FY2026 progress → FY2027 plan: think good partner companies 549 (as of 30 Sep 2026) → 600; virtually 100% renewable-energy stores expanded by 2 stores and on-site checks of secondary-supplier factories → GHG Scope 1+2 ▲24% vs. FY2023, renewable ratio 30%, 100% supplier code notification; female manager ratio 32.0% (1 Apr 2026) → 34%; female director ratio 33.3% → 30% or more. Sustainability briefing scheduled for 4 December 2026 and sustainability report for 15 January 2027.
Table with four colour-banded materiality rows and columns for main initiatives, FY2026 progress and FY2027 plan; red event line at the bottom.
With an assumed cost of equity of 8–9%, the company pursues ROIC improvement toward ROE of 10% or more and monitors ROIC by business after HQ cost allocation. FY2026 progress (Q2 full-year forecast) vs. initial plan: ROE 10.7% vs. 10.1%; consolidated OP 860 vs. 815 億円, ROIC 8.7% vs. 8.3%; department store business (incl. MI Tomo-no-kai) OP 703 vs. 663, ROIC 10.7% vs. 10.1%; finance OP 75 vs. 74, ROIC 3.8% vs. 3.7%; real estate OP 52 vs. 48, ROIC 6.6% vs. 6.2%; related businesses OP 31 vs. 31, ROIC 8.2%. Reference: FY2027 plan at plan launch — OP 850 億円, ROIC 7.8%.
Summary box; left ROE/OP/ROIC table by business; right reference diagram of inter-business linkages with ROIC circles.
Targets ROE of around 12% in the medium term. Phase I (FY2025–27) cash-in: operating cash generation about 2,600 億円 and asset replacement about 700 億円; cash-out: growth/maintenance investment about 1,200 億円 and shareholder returns about 1,500 億円, plus additional consideration. FY2026 forecasts: operating cash 980 億円 (+60 vs. May forecast; FY2025 actual 900); asset replacement 250 億円 (FY2025 370); investment 442 億円 (FY2025 380); shareholder returns about 560 億円 — dividends about 290 and buybacks 270 (FY2025 545: dividends 215, buybacks 330). Policy: total payout of 70%+ (cumulative), progressive dividends, DOE of 5%+ from FY2027.
Cash-in and cash-out halves, each with Phase I plan boxes and FY2026 progress boxes, connected by a grey arrow.
Strengthening growth investment with discipline. Phase I total vs. FY2025 actual vs. FY2026 plan (億円): content (department-store remodels, machika investment) 530 / 136 / 173; DX & systems 130 / 40 / 51; real-estate value-up 170 / 68 / 74; productivity (human capital, operational DX) 30 / 9 / 17; safety (LCC building repairs, existing system upgrades) 360 / 127 / 127; total 1,220 / 380 / 442. Pay improvements and training are budgeted in SG&A and excluded.
Investment table grouped into growth and maintenance investment, with Phase I total and FY2025/FY2026 columns.
With the upward revision, FY2026 interim and year-end dividend forecasts are each raised by ¥2, from ¥20 to ¥22 (split-adjusted), lifting the annual forecast from ¥40 to ¥44 and DOE to 5.0% (previous forecast 4.5%). Dividends per share: FY2021 ¥5, FY2022 ¥7, FY2023 ¥17, FY2024 ¥27, FY2025 ¥35; DOE 0.8%, 1.0%, 2.3%, 3.3%, 4.0%. Buybacks: FY2023 150, FY2024 250, FY2025 330, FY2026 270 億円 (in progress; about 80 億円 remaining from November 2026). Total payout ratio 31%, 17%, 50%, 85%, 76%, 88% (FY2026 forecast). Policy: progressive dividends and DOE 5%+, total payout 70%+ across Phase I. FY2027–30 bars carry no values.
Summary box; combo chart of dividend bars and DOE line with a dotted projection, plus a table of buybacks and total payout ratio below.
Introduces four investor questions and the answers that follow: (1) domestic customers are strong — any concern about sustainability? → efforts to capture and expand high-sensitivity quality consumption; (2) progress and expected results of CRM for overseas customers? → initiatives for overseas customers; (3) improving regional store profitability and their new role? → group federation without silos for regional customers; (4) are group companies' preparations for the fruition phase on track? → functional evolution of affiliates.
Title box on light background; framed table with four question/answer rows highlighted in yellow.
Targets the global 'high-sensitivity quality' (discerning) consumption market and aims to raise LTV through deeper individual relationships. External environment: domestic population and retail market shrinking, but world population growing and the domestic discerning-consumption market expanding with polarisation. Approach: market creation (focus on how people buy), content creation (unique remodels), customer creation (mass to individual), and a step flow from attracting worldwide customers to identification, two-way communication, personal outreach and long-term LTV growth.
Summary box; left panel on macro environment and opportunities; right panel with three creation themes and a stepped downward flow.
Building an overseas customer base like the domestic one through gaisho, overseas apps and GCP, and offering personal service via two-way communication. Customer journey from before travel to repeat visits: attracting (brand communication for overseas customers from March 2027), identification at purchase (from April 2027), expanded usage via two-way communication (from April 2027) and lifetime customers via GCP for overseas customers (from April 2027).
Summary box; two framework headers; four-stage journey row with arrow-shaped stage labels and dated initiatives.
The 'science of department stores' cut the regional stores' breakeven ratio from 98.5% (FY2022) to 85.9% (FY2026 plan), a 12.6-point improvement; regional operating profit rose from 10 億円 (FY2022) to 102 億円 (FY2026 plan). Base-network handling grew 132% YoY, about 5% of regional department-store sales; regional real sales rose 103% in FY2026 H1 vs. FY2025 H1 (total sales 101%). Intermediate-year profit bars and breakeven ratios (FY2023–25) are unlabeled and not legible as figures.
Summary box; left combo chart of operating-profit bars and breakeven-ratio line; right stacked-bar chart comparing H1 2025 vs. H1 2026 real sales.
Three federation initiatives progressing. Breaking silos: Business Support (logistics efficiency for suppliers), System Solutions (IT service platform), Studio Alta (in-group advertising). Mass to individual: MI Card (full card lineup incl. MICARD+ THE ONE), Nikko Travel (high-end tours for gaisho customers), Property Design (renovation projects for gaisho customers). Vertical to horizontal: MI Food Style (food SPA brands and supply-chain links), Property Design (group living-space proposals), Gift Solutions (high-quality gifts with department stores).
Summary box; three brown-headed columns each listing three subsidiary cards with a one-line role.
Forward-looking statements are based on information available at the time of disclosure and involve risks and uncertainties; actual results may differ due to changes in business operations or economic conditions.
Header bar with logo; single bordered text box centered on the page.
Common questions about this slide and the underlying presentation content.
The original is a Japanese-language results briefing deck (決算説明会資料) from Isetan Mitsukoshi Holdings, dated 13 November 2026 and published on TDnet, the Tokyo Stock Exchange's timely disclosure system. The page descriptions here are English translations, with yen kept in the company's unit of ¥100 million (億円).
It covers the first half of FY2026 (April–September 2026), i.e. the second quarter (interim) of the fiscal year ending March 2027, plus the revised full-year plan and progress on Phase I (FY2025–27) of the medium-term management plan.
Total sales were 6,356 億円 (106.6% YoY), operating profit 375 億円 (119.4%) and net income 371 億円 (126.4%), all record highs for a first half and Q2 according to the deck.
Operating profit was raised to 860 億円 (+20 vs. the Q1-time plan), reaching the FY2027 medium-term target of 850 億円 a year early, and net income was raised to 655 億円. Domestic department-store total sales are planned at 12,150 億円, with overseas-customer sales up 116.4%.
No. It is a department-store retailer operating stores such as Isetan Shinjuku, Mitsukoshi Nihombashi and Mitsukoshi Ginza plus regional department stores, with credit/finance, real estate and other related businesses. Apps and EC appear in the deck as customer touchpoints for its store-centred CRM strategy.
Interim and year-end dividend forecasts were each raised from ¥20 to ¥22 per share (split-adjusted), for ¥44 annually and a DOE of 5.0%. Buybacks of 270 億円 are in progress, and the FY2026 total payout ratio is forecast at 88%.
Pages 5–9 (consolidated, store-level, SG&A and segment results), pages 12–17 (revised plan), page 23 (financial and customer KPIs), and pages 36–39 (ROE/ROIC, capital allocation, investment plan and shareholder returns).

Create Your Own Slides
Turn your ideas into professional presentations in seconds with 2slides AI.
Reference professional designs, choose your style, and generate slides with perfect text rendering. Powered by Nano Banana—start creating your presentation now.
Your AI Agent for slides. Save time, shine faster with intelligent presentation creation.


© 2026 2slides. All rights reserved.