
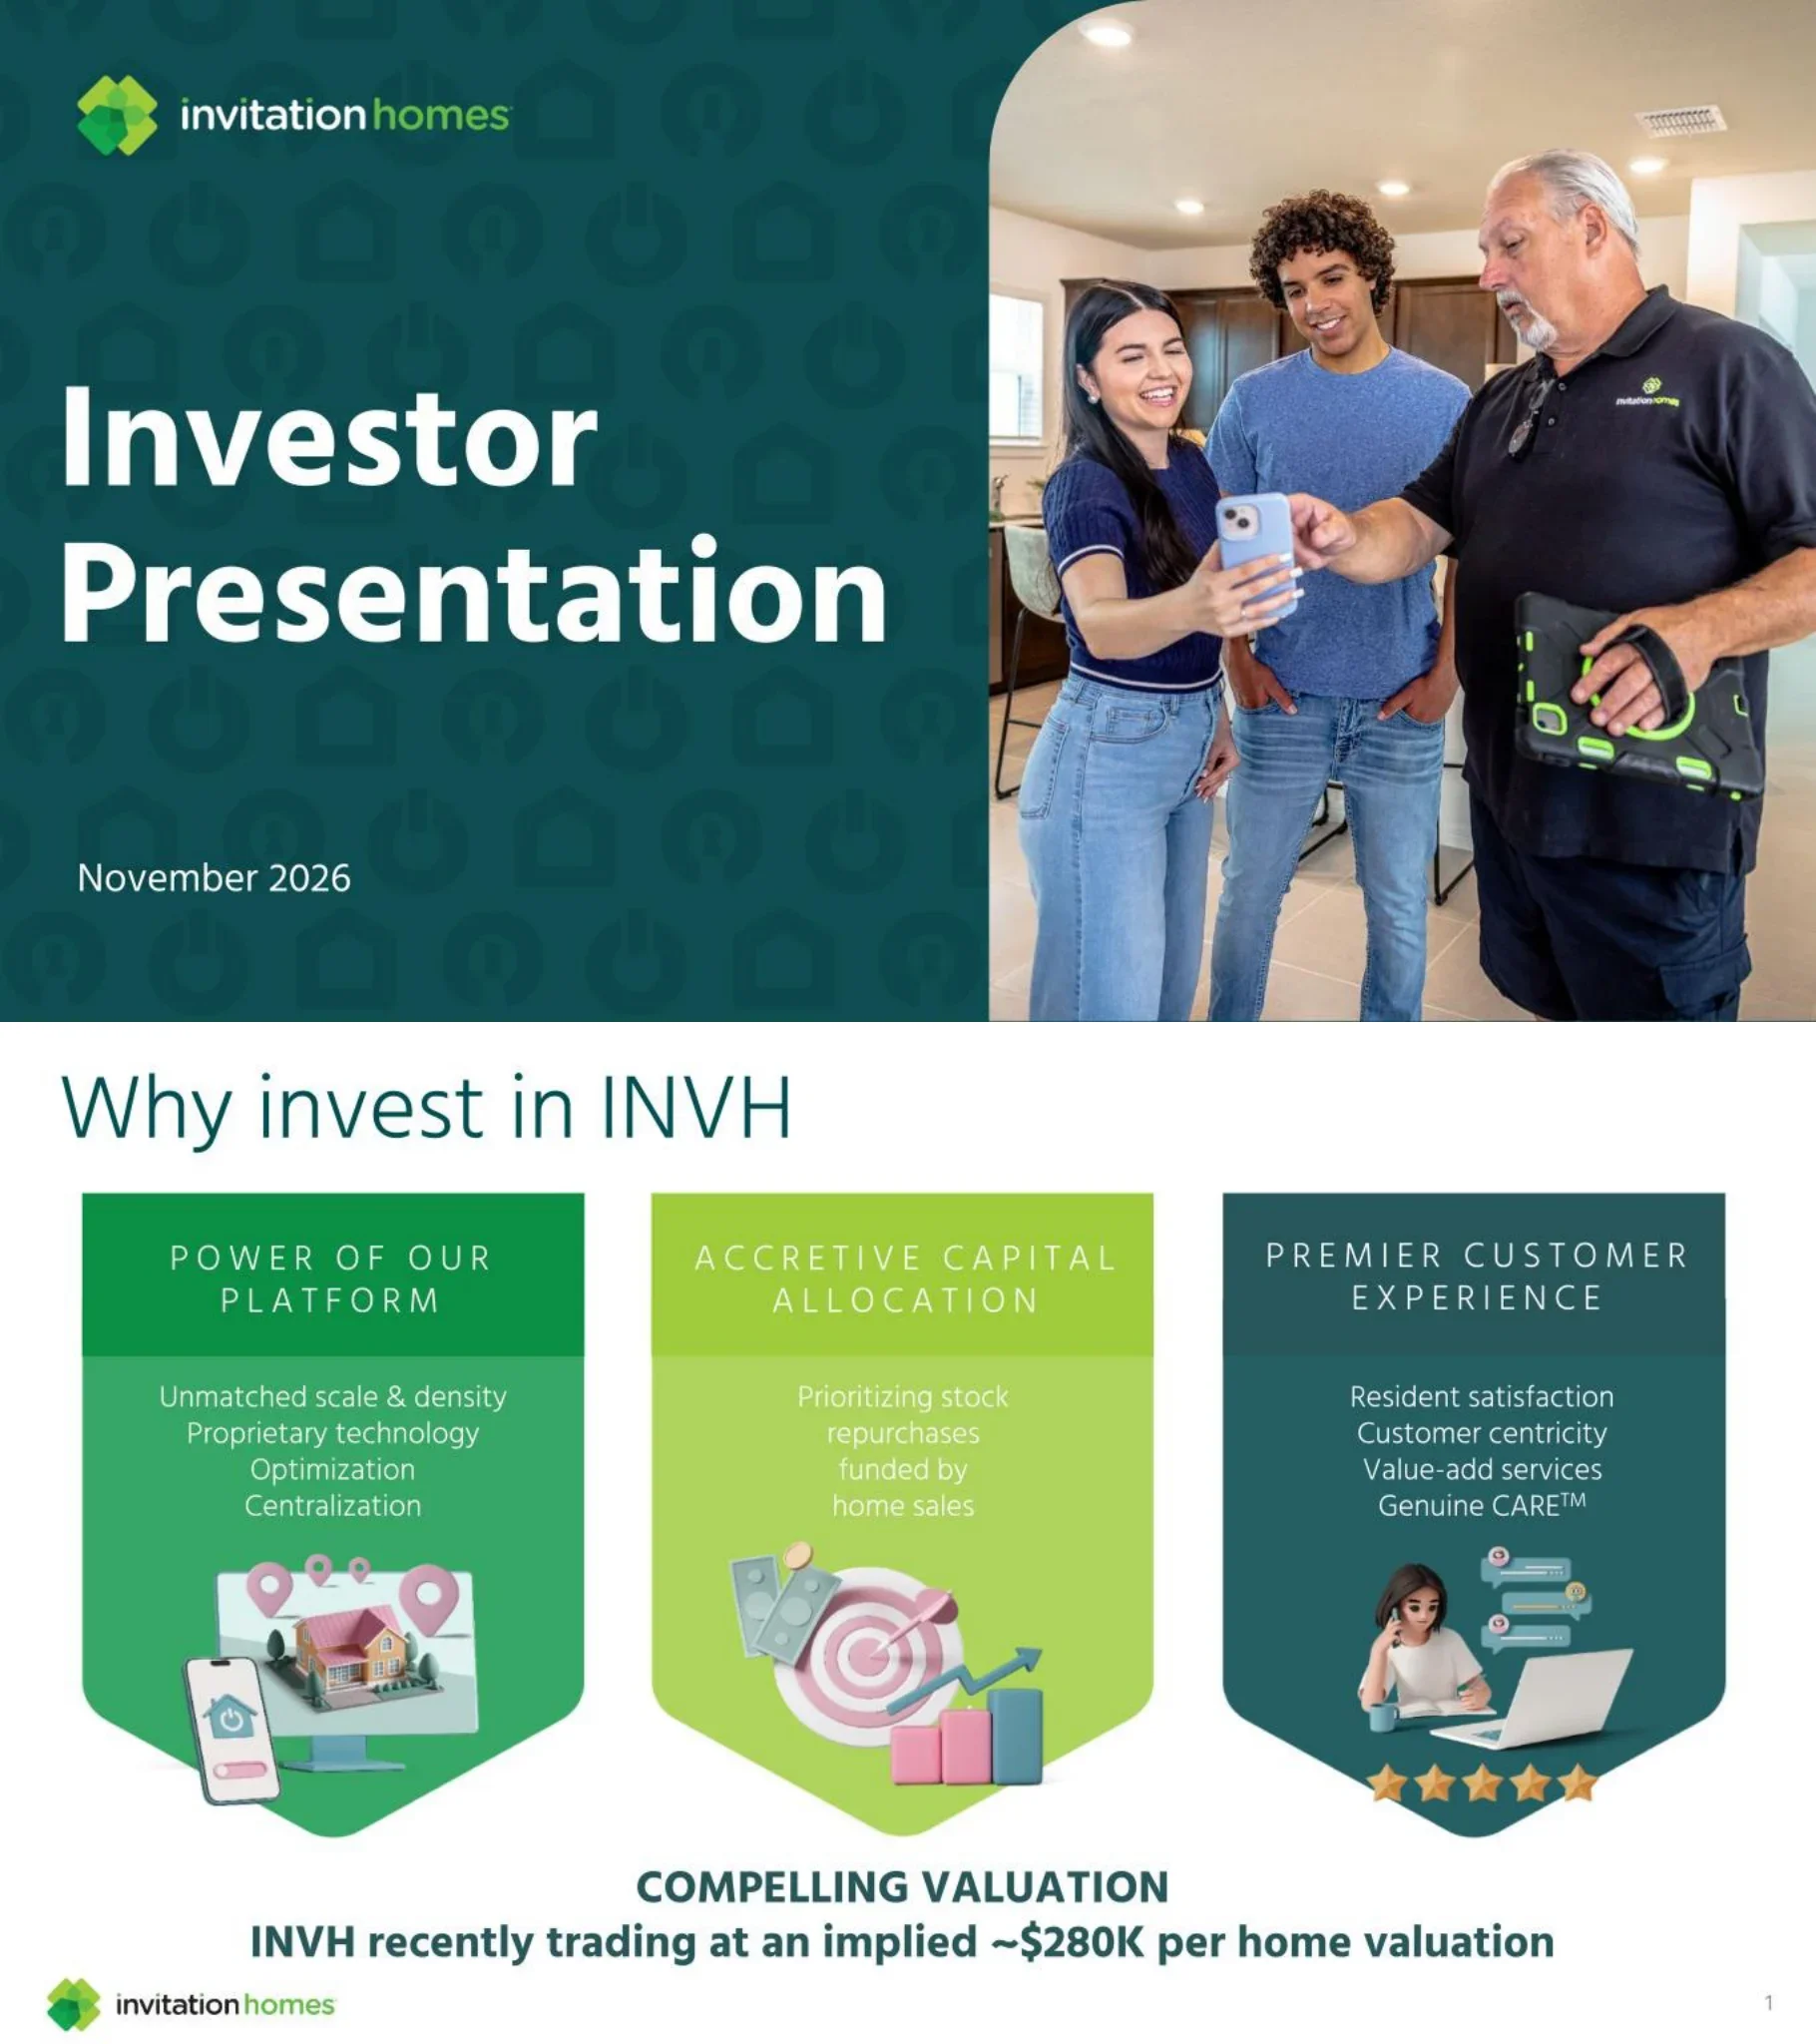
Part of Investor presentation examples
Invitation Homes Investor Presentation November 2026 - a 14-page investor deck from Invitation Homes (NYSE: INVH), the single-family rental (SFR) REIT, filed with the SEC as an exhibit to Form 8-K. It covers the investment thesis, $1 billion of stock buybacks since December 2025, the case for single-family rental, market footprint by 3Q26 revenue, resident satisfaction metrics, October 2026 same-store leasing stats, balance sheet targets, demographic and affordability data, SFR ownership fragmentation, national supply trends, and the forward-looking statements disclaimer.
Uses this deck’s cover as a style reference for slides made from your own content. Or pick any page below to use its layout as the reference.
Quick Navigation
Tags
Share the slides
Invitation Homes Investor Presentation November 2026 - a 14-page investor deck from Invitation Homes (NYSE: INVH), the single-family rental (SFR) REIT, filed with the SEC as an exhibit to Form 8-K. It covers the investment thesis, $1 billion of stock buybacks since December 2025, the case for single-family rental, market footprint by 3Q26 revenue, resident satisfaction metrics, October 2026 same-store leasing stats, balance sheet targets, demographic and affordability data, SFR ownership fragmentation, national supply trends, and the forward-looking statements disclaimer.
Detailed view of each slide page, including layout, key content and visual elements.
Title slide for the Invitation Homes Investor Presentation dated November 2026. The Invitation Homes logo sits at the top left of a dark-teal panel with a subtle house-and-keyhole icon pattern, and the date appears at the bottom left.
Split layout: dark-teal text panel on the left (about 55% width) with a large white two-line title, and a full-height photograph on the right with a curved top-left corner.
Three pillars: Power of Our Platform (unmatched scale and density, proprietary technology, optimization, centralization), Accretive Capital Allocation (prioritizing stock repurchases funded by home sales) and Premier Customer Experience (resident satisfaction, customer centricity, value-add services, Genuine CARE). A bottom banner states 'Compelling Valuation' with INVH recently trading at an implied ~$280K per home valuation.
Three shield-shaped columns in green, lime and dark teal, each with a letter-spaced header, short bullet lines and a 3D illustration, followed by a bold centered valuation statement and the logo footer.
A Capital Allocation Update table shows $1.0B of stock repurchases since Dec. '25 at $26.78 avg/sh, $1.5B of repurchase authorizations with $500M remaining, an FY26 disposition guidance midpoint of $950M (up $100M at 3Q), YTD dispositions of $918M (up $85M since 3Q) and a YTD average disposition price of ~$460K per home, with ~65% of proceeds from SoCal, NorCal and SoFlo. Bullets say dispositions are the primary funding source and that ~6% of shares outstanding have been repurchased since December 2025, which the slide describes as leading Residential REITs this year. All figures are as of 11/1/2026.
Left column of four arrow bullets (first one bold) and a right-hand green-headed data table with Metric, Value and Detail columns separated by dashed row lines.
Three arguments: demographics drive long-term demand (Millennials and Gen Z fueling household formation for the next decade), leasing is more affordable and often preferred (average monthly savings of over $1,000 and increasing preference for leasing), and access to quality housing and services (~93% of SFR homes owned by small operators, most of whom cannot offer what Invitation Homes does). The closing line says the company believes SFR is poised for continued outsized growth versus other residential sector peers.
Three dark-teal rounded shield cards in a row with letter-spaced headings, short supporting text and a 3D illustration each; bold takeaway statement centered underneath.
A U.S. map with bubbles sized by percent of 3Q26 revenue. Atlanta is the largest at 13%, followed by Southern California, Tampa and South Florida at 11% each, Phoenix 9%, Orlando 8%, Seattle and Carolinas 6% each, Northern California 5%, Las Vegas, Denver and Dallas 4% each, Chicago 3%, Jacksonville and Houston 2% each, and Minneapolis 1%.
Large heading at left; grey U.S. state map at right with overlapping dark-teal circles labeled by market and percent, plus a small legend 'Percent of 3Q26 revenue' at lower left of the map.
A map of metro Atlanta shows owned and managed home counts as of 9/30/2026, split into four pods: Pod 1 with 4,576 homes, Pod 2 with 4,191 homes, Pod 3 with 4,788 homes and Pod 4 with 4,782 homes. Thousands of green dots show how tightly the homes cluster within the metro area.
Heading at left; right half is a full-bleed street map with a dark 'ATLANTA' tab, shaded pod regions, a dense dot overlay and four white callout boxes labeling each pod.
Five KPIs are shown: >41 months same-store average resident tenure, 96.4% same-store average occupancy, 75.8% same-store average renewal rate, 4.75 / 5.0 average stars on post-maintenance surveys, and 4.09 / 5.0 cumulative all-time Google / Yelp rating. A footnote says the figures are as of or for the quarter ended 9/30/2026.
Two-line centered title above a KPI grid: three circular-icon metrics on the top row and two on the bottom row, each with a large number and a short caption.
A comparison table covers INVH 3Q 2026, Oct 2025 and Oct 2026. Average occupancy is 96.4%, 96.1% and 96.1%; renewals rental rate growth is +4.3%, +4.2% and +4.2%; new leases rental rate growth is -0.2%, -3.2% and -2.2%; blended rental rate growth is +3.0%, +2.1% and +2.2%.
Single centered four-column table with a dark-teal header, green row labels, alternating white and light-blue cells, and the Oct 2026 column highlighted with a green gradient.
A 'Fortress Balance Sheet' with 5.5x Net Debt / TTM Adj. EBITDAre, over $1.3B of liquidity, no debt maturing before June 2027, ~90% of real estate unencumbered and ~90% of debt fixed or swapped to fixed rate. The table lists 5.5x vs a 5.5x-6.0x target, secured debt / gross RE assets of 3.9% vs <10%, unencumbered assets / gross RE assets of 91.5% vs >90%, and credit ratings of Baa2 / BBB / BBB+. A stacked bar chart of secured and unsecured debt maturities runs 2026-2036, peaking at $2,235M in 2029.
Left column with a bold subheading and six arrow bullets; right side has a green-headed panel with a metrics table above a bar chart of debt maturities by year.
A bar chart of U.S. 10-year net population change by age group (2025-2035) shows large gains for ages 40-44, 45-49 and 50-54 (roughly 2M to 3M) and declines for several younger and older groups. A highlighted 'INVH sweet spot' box spans ages 25-29 through 45-49 and notes an average age of new resident of ~39 years. Source: John Burns Research & Consulting, tabulations of U.S. Census Bureau Population Estimates and Congressional Budget Office Projections, published September 2026.
Full-width column chart with green positive bars and red negative bars, a rounded dark-teal outline box highlighting the sweet-spot age range, chart title above and source note below.
A line chart of the nationwide cost of home ownership (payment and maintenance) versus single-family rent from 2008 to current shows a widening gap, with a callout that the $1k+ nationwide monthly gap matches what the company sees within its own markets. Side panels say 39% of BTR residents prefer to rent versus own, up from 27% in 2023, and only 37% of renters plan to move within the next three years, down from 57% in 2016. Sources: John Burns Real Estate Consulting (Oct 2026 cost data, Sept 2026 BTR survey) and Federal Reserve Bank of New York (Feb 2026).
Left two-thirds is a red and green line chart with a shaded delta area and a dark speech-bubble callout; right side stacks a green stat card (39%) over a grey-teal stat card (37%).
A chain of charts narrows from 149 million housing units (91% households, 9% vacant) to 135 million households (65% owned, 35% rented), to 47 million rental households (66% apartments, 30% single-family, 4% mobile homes, boats, etc.), to 14 million SFR homes. A stacked ownership bar shows 'Mom & Pop Owners' at 92.8%, with legend tiers for owners of 1-9, 10-99, 100-349 and 350+ homes. Source: John Burns Research & Consulting, Single-Family Rental Analysis and Forecast, September 2026.
Three pie charts connected by lime arrows from left to right, ending in a 100% stacked bar with a bracket and callout; letter-spaced headings above each chart and a legend at the lower right.
Three panels: build-to-rent deliveries -47% (2027E vs 2024 peak), with annual deliveries of 60K in 2023, 74K in 2024, 58K in 2025, 56K in 2026E and 39K in 2027E; for-sale supply +50% (unsold new homes vs seasonal norm), with resale months of supply of 6.7 in S. Florida, 5.1 Houston, 4.9 Orlando, 4.8 Dallas and 4.5 Tampa; and for-lease listings -12% for large operators year over year, versus +3% for all vacant SFR (2Q26). A dense footnote cites John Burns Research & Consulting; parts of the footnote text are small and only partly legible at this resolution.
Three equal columns, each with a bold caps heading, a huge headline percentage, a one-line descriptor and a small chart (vertical bars, horizontal bars, diverging bars); full-width notes at the bottom.
A two-column legal disclaimer stating that the presentation contains forward-looking statements within the meaning of Section 27A of the Securities Act of 1933 and Section 21E of the Exchange Act. It lists risk categories (including single-family rental industry risks, macroeconomic factors, regulation including the 21st Century ROAD to Housing Act, competition, property taxes, HOA fees and insurance costs, indebtedness) and points to Item 1A Risk Factors in the Annual Report on Form 10-K for the year ended December 31, 2025 and other SEC filings.
Title at top with two justified text columns of dense body copy beneath and the logo and page number in the footer.
Common questions about this slide and the underlying presentation content.
It is a 14-page investor deck from Invitation Homes (NYSE: INVH), a single-family rental REIT. It covers the investment thesis, $1 billion of stock buybacks since December 2025, the case for SFR, a market footprint map, resident satisfaction KPIs, October 2026 same-store leasing stats, balance sheet metrics, demographic and affordability charts, SFR ownership structure, national supply trends and a forward-looking statements disclaimer.
It was filed with the SEC as an exhibit to Form 8-K in November 2026. It is a public company document published by Invitation Homes for investors, and the slides cite third-party sources such as John Burns Research & Consulting and the Federal Reserve Bank of New York where applicable.
Yes. The deck is offered on 2slides.com/gallery as a PDF for reading and printing and as an editable PPTX that you can open in PowerPoint, Keynote or Google Slides.
Keep the structure: a cover, a three-pillar thesis slide, a capital allocation table, market-opportunity cards, a footprint map, KPI icon grid, leasing table, balance sheet with debt maturity chart, supporting market-data charts and a closing disclaimer. Replace the text and numbers with your own figures and use your own logo and brand colors.
Printed figures include $1.0B of stock repurchases since December 2025 at $26.78 average per share, an implied ~$280K per home valuation, 96.4% same-store average occupancy, 75.8% average renewal rate, 5.5x net debt to TTM Adj. EBITDAre, and Baa2 / BBB / BBB+ credit ratings. Check the original slides for exact definitions and footnotes before citing them.
No. It is a company-published presentation provided for information. The final slide contains the company's forward-looking statements disclaimer, and some footnotes and source notes are small. Review the original SEC filing and the company's periodic reports for full context before making any decision.
The three-card thesis slides (pages 2 and 4), the KPI icon grid (page 7), the comparison tables (pages 3 and 8), the bubble map (page 5), the multi-panel statistics slide (page 13) and the pie-chart funnel (page 12) are the most reusable layouts for real estate, REIT and other investor presentations.
The PPTX is provided so you can edit and restyle the slides. Some charts, maps and photos may arrive as images rather than native chart objects, so you may need to rebuild chart data in PowerPoint when adapting them with your own numbers.

Create Your Own Slides
Turn your ideas into professional presentations in seconds with 2slides AI.
Reference professional designs, choose your style, and generate slides with perfect text rendering. Powered by Nano Banana—start creating your presentation now.
Your AI Agent for slides. Save time, shine faster with intelligent presentation creation.


© 2026 2slides. All rights reserved.