
Part of Investor presentation examples · Japanese investor presentation examples
IHI H1 FY2026 Earnings Presentation: IHI Corporation's first-half results for the fiscal year ending March 2027 (IFRS), released November 4, 2026. This is a Japanese-language deck (第2四半期決算説明資料) published on TDnet, the Tokyo Stock Exchange's timely disclosure system; this page summarizes every slide in English. IHI posted record first-half operating profit of ¥114.9 billion (1,149億円, 14.8% margin) on revenue of ¥779.3 billion (+¥65.6 billion YoY), driven by commercial aero-engine aftermarket growth plus ¥42.6 billion of real-estate gains, and raised its full-year FY2026 guidance (April 2026 to March 2027) to revenue of ¥1.88 trillion, operating profit of ¥270 billion and a ¥25 annual dividend.
Uses this deck’s cover as a style reference for slides made from your own content. Or pick any page below to use its layout as the reference.
Quick Navigation
Tags
Share the slides
IHI H1 FY2026 Earnings Presentation: IHI Corporation's first-half results for the fiscal year ending March 2027 (IFRS), released November 4, 2026. This is a Japanese-language deck (第2四半期決算説明資料) published on TDnet, the Tokyo Stock Exchange's timely disclosure system; this page summarizes every slide in English. IHI posted record first-half operating profit of ¥114.9 billion (1,149億円, 14.8% margin) on revenue of ¥779.3 billion (+¥65.6 billion YoY), driven by commercial aero-engine aftermarket growth plus ¥42.6 billion of real-estate gains, and raised its full-year FY2026 guidance (April 2026 to March 2027) to revenue of ¥1.88 trillion, operating profit of ¥270 billion and a ¥25 annual dividend.
Detailed view of each slide page, including layout, key content and visual elements.
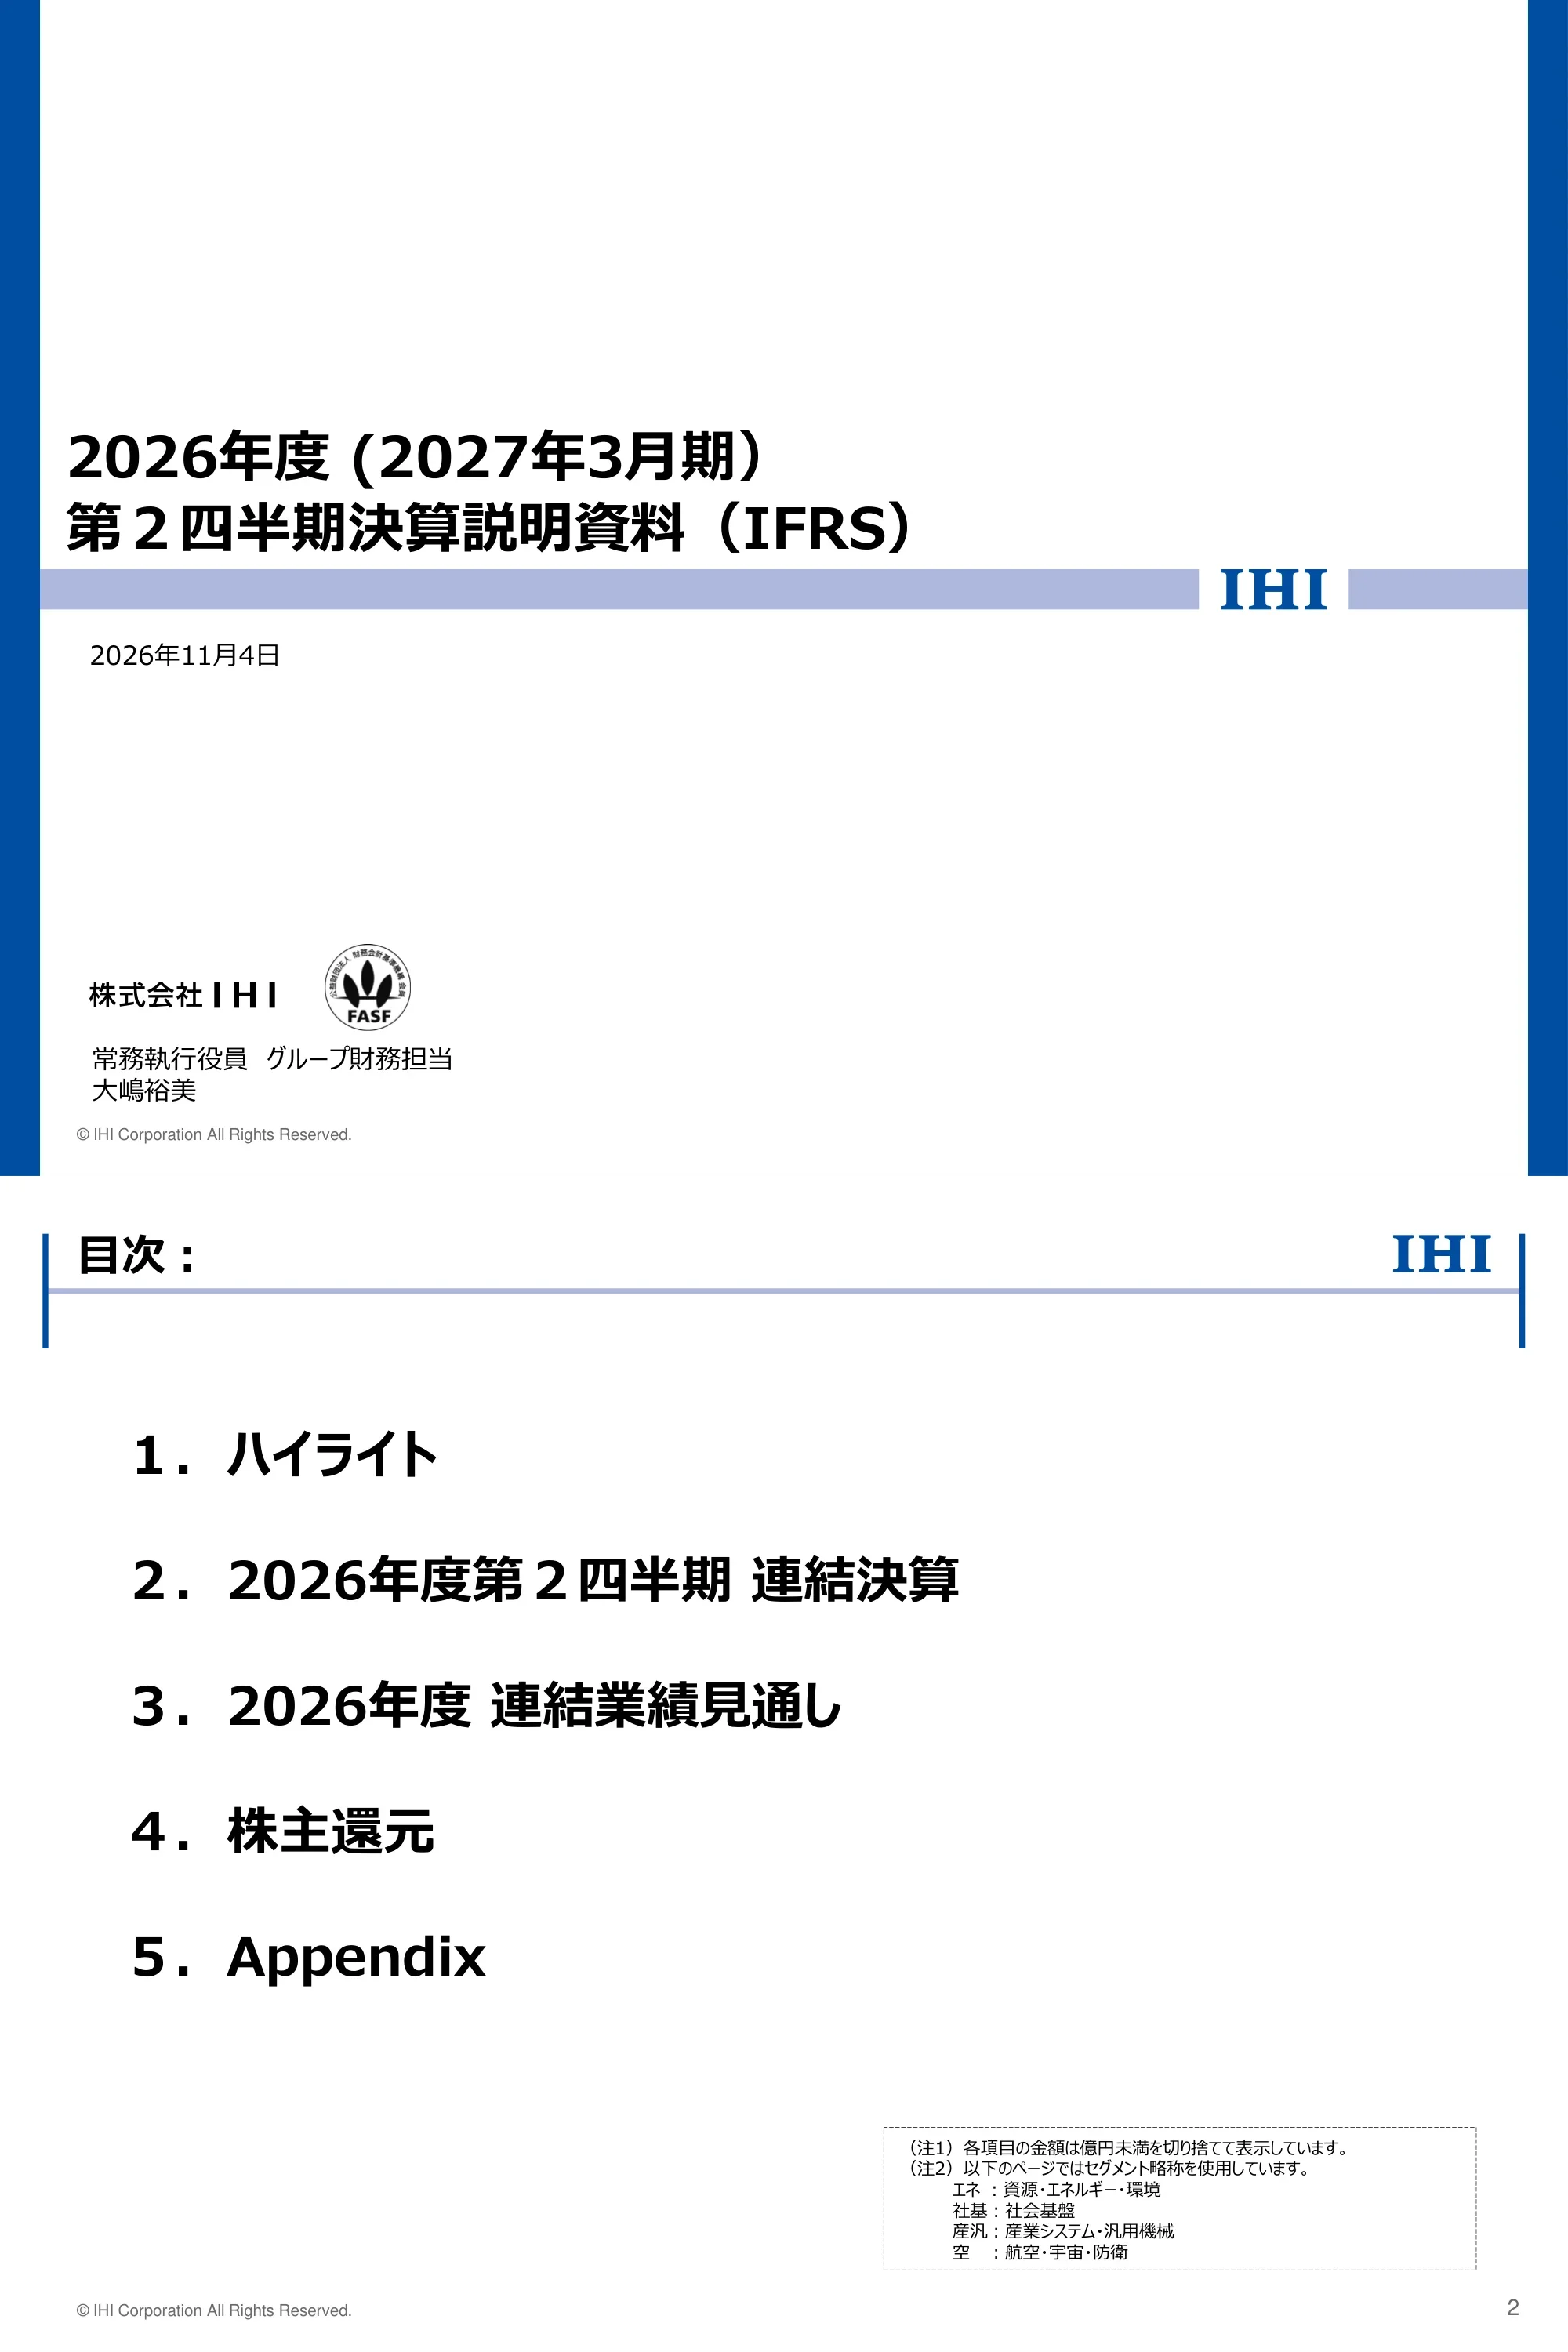
Title slide for IHI's second-quarter (first-half) FY2026 results under IFRS, dated November 4, 2026, presented by Yumi Oshima, Managing Executive Officer in charge of Group Finance; carries the IHI wordmark and the FASF (Financial Accounting Standards Foundation) membership seal.
White canvas framed by thick blue side bars; large black two-line title on the left above a lavender horizontal band with the IHI logo at right; date below the band; company name, FASF seal and presenter at the bottom left.
Agenda with five sections: 1. Highlights, 2. FY2026 Q2 Consolidated Results, 3. FY2026 Consolidated Forecast, 4. Shareholder Returns, 5. Appendix. A boxed note says amounts are truncated below ¥100 million (億円) and defines segment abbreviations: Resources, Energy & Environment; Social Infrastructure; Industrial Systems & General-Purpose Machinery; Aero Engine, Space & Defense.
Standard content header (title left, IHI logo right, lavender rule with blue brackets); numbered agenda list in large bold type; dashed-border footnote box at bottom right.
H1: orders fell to ¥778.7 billion (7,787億円, ▲¥114.6 billion) as a large energy order last year was not repeated despite strong defense and commercial engines; revenue rose to ¥779.3 billion (+¥65.6 billion), operating profit to ¥114.9 billion (14.8%, +¥45.5 billion) and net profit to ¥84.9 billion (+¥29.0 billion), a record for a first half; operating profit excluding real-estate gains was ¥72.3 billion (9.3%); operating cash flow was ▲¥65.0 billion. FY2026 forecast, raised again after August: orders ¥1.89 trillion, revenue ¥1.88 trillion, operating profit ¥270.0 billion (14.4%), net profit ¥185.0 billion, operating CF ¥100.0 billion, dividend raised ¥2 to ¥25 per share, as the first year of the 'Medium- to Long-term Direction (Phase 1)'.
Two stacked blocks, H1 actuals on top and full-year outlook below; each has a light-blue 'Overview' label with bold bullet commentary, then a 3x2 grid of cyan-bordered KPI cards showing the value in large type with YoY (and revision vs August) underneath.
Section break introducing the first-half consolidated results.
Centered bold black section title on a white field framed by blue side bars, with the lavender band and IHI logo near the bottom.
Table comparing H1 FY2025 with H1 FY2026 (¥100 million): orders 8,934 to 7,787 (▲12.8%); revenue 7,136 to 7,793 (+9.2%); operating profit excluding real-estate gains 656 to 723 (9.3%); real-estate gains 38 to 426; operating profit 694 to 1,149 (14.8%, +5.1pt); profit before tax 747 to 1,227; net profit attributable to owners 559 to 849; operating CF ▲571 to ▲650; free cash flow ▲801 to ▲560; average USD rate ¥146.57 to ¥160.03. A reference table strips out FX (+156) and business-transfer gains/losses (▲140) to show underlying operating profit of 707 (9.1%, +186). Footnote: revenue includes FX revaluation effects from the PW1100G-JM additional inspection program (+8 and +7), with no change to its estimated total USD cost.
Full-width financial table with gray header row and the current-period column highlighted in solid blue / light-blue fill; margins in italic parentheses; smaller reference table below with the same column structure.
Waterfall from H1 FY2025 revenue of ¥713.6 billion to ¥779.3 billion: divested businesses ▲180 (¥100 million), then business expansion of +836 made up of commercial engines +516, defense +110, nuclear +58 and stable-earnings businesses +152. Headline: commercial engines led revenue growth, with defense, nuclear and stable businesses also contributing.
Two-line navy headline under the slide title; horizontal waterfall chart with light-blue start/end bars, red negative bar and bright-blue positive bars; a rounded navy outline groups the growth bars with a navy label 'Business expansion +836'.
Waterfall from ¥69.4 billion to ¥114.9 billion: removing last year's one-offs (▲173: prior business transfer ▲113, real-estate gains ▲38, FX ▲22) gives 521; business environment +113 (commercial engine and nuclear demand), lifecycle business (LCB) expansion +68 (carbon solutions, power systems), cost structure +58 (carbon-solutions project margins, turbocharger pricing and cost cuts), SG&A ▲75 (R&D and personnel), other +22, for underlying profit of 707 (+186); this year's one-offs (restructuring ▲140, FX +156) give 723, plus real-estate gains +426 for 1,149, a record.
Waterfall chart spanning the slide with checkmark callout boxes linked to each bar; navy banner 'Underlying operating profit +186' bracketing the core bars; navy tag for 'Real-estate gains +426' on the final step; bracket labels for one-off groups along the axis.
Segment profit rose from ¥54.7 billion to ¥72.2 billion: FX +134 (¥100 million; average-rate difference +135, foreign-currency liability revaluation ▲1 tied to the PW1100G-JM program), new engines ▲20 (more PW1100G and GE units), aftermarket +110 (higher PW1100G and V2500 sales), margin improvement +15 (more commercial MRO part repairs), SG&A ▲63 (R&D and personnel investment). Message: sustained strong aftermarket growth, with new-engine sales and up-front investment on plan.
Two-line navy headline; waterfall chart with checkmark callout boxes above and below bars; brace grouping new engines and aftermarket as 'business environment change'; footnote at bottom right.
Commercial engine revenue (GAAP basis, excluding the PW1100G-JM inspection program) grew 28% YoY in H1, with both new engines and aftermarket (spare parts plus MRO) up. Mix in H1 FY2025 and FY2026: spare parts 63%, new engines 30%, MRO 7%. Annual mix FY2022 to FY2026 forecast: spare parts 61%, 58%, 60%, 60%, 60%; new engines 36%, 37%, 34%, 33%, 33%; MRO 3%, 5%, 6%, 7%, 7%, with the FY2026 forecast bar near ¥500 billion.
Split layout divided by a dashed line: left stacked-column chart for H1 YoY with a navy '+28% YoY' badge and curved arrow; right stacked-column chart for FY2022 to FY2026 forecast; mix-percentage tables beneath each chart; legend and footnotes at bottom.
Spare-parts revenue in millions of USD, shown as gross sales volume above zero and program maintenance costs below zero, split PW1100G and other programs, with net spare-parts revenue as a line. H1 net revenue rose 20% YoY, led by PW1100G-JM. FY2022 to FY2026 forecast: despite geopolitical risk and high fuel prices, air-travel demand remains firm and the revenue growth outlook is maintained. Exact bar values are not labeled on the chart.
Split layout: left H1 comparison chart with '+20% Net YoY' badge; right five-year chart; positive/negative stacked bars in green and teal with a navy net-revenue line (dotted for forecast); side labels for gross sales and maintenance cost; definitions in footnotes.
Total assets rose from ¥2,428.5 billion at FY2025 year-end to ¥2,540.9 billion (+¥112.4 billion); D/E ratio 0.72x to 0.75x; equity ratio attributable to owners 26.9% to 28.4%; JCR issuer and bond rating upgraded one notch from A to A+ (announced October 28). Balance-sheet blocks (¥100 million) at H1-end: cash 1,370, receivables 6,987, inventories 5,906, other 1,284, non-current assets 9,860; payables 3,509, contract liabilities 3,251, refund liabilities 1,021, other 4,508, interest-bearing debt 5,632, equity 7,486. Message: profit growth plus real-estate sales strengthened the balance sheet.
Two side-by-side periods separated by a gray arrow; each has a gray header, four key-ratio lines, and paired stacked blocks for assets versus liabilities and equity in graded teal shades with values inside.
Operating CF worsened to ▲¥65.0 billion (▲78 in ¥100 million) as working capital grew with the business (▲1,499 vs ▲669), with profit before tax 1,227, depreciation 413, real-estate gains removed ▲426, PW1100G-JM inspection program spending ▲224, taxes ▲152 and other 11. Investing CF turned positive at +89 (capex ▲329) thanks to property sale proceeds, so free cash flow improved to ▲560 from ▲801.
Two-line headline; full-width cash-flow table with the current-period column in blue / light-blue; indented sub-items; footnotes defining working capital and the separate disclosure of inspection-program spending.
Timeline table of divestitures and exits: general-purpose boilers to Takuma, conveyor systems to Tadano, turf equipment to Kyoeisha, concrete building materials to Vertex, a 15% stake in Japan Marine United to Imabari Shipbuilding, Niigata Transys to J-Will Partners, Meisei Electric to Nohmi Bosai, Kotobuki Iron Works to Tsuneishi, liquidation of IHI Energy Solutions and IHI Solid Biomass Malaysia, IHI Power Services Corp. to the Kyushu Electric group, IHI Logistics & Industrial Systems to Toyota Industries (80% on April 1, 2027), and, newly added, IHI VTN GmbH to a European buyer (September 17, 2026) and Steinmüller Engineering to Mutares (October 15, 2026). Message: the restructuring planned in the previous medium-term plan is complete and profitability is much higher.
Two-line headline; three-column table (announcement date, business, summary) with light-blue header; the two newest rows outlined in red.
Section break introducing the full-year FY2026 outlook.
Same centered-title divider layout as the other section breaks.
Revised FY2026 forecast versus August forecast and FY2025 actual (¥100 million): orders 18,900 (+1,200 vs August; ▲647 vs FY2025's 19,547); revenue 18,800 (+400; +2,365); operating profit excluding real-estate gains 1,770 (9.4%); real-estate gains 930 (unchanged); operating profit 2,700 (14.4%, +200; +1,044); profit before tax 2,600; net profit 1,850 (+130); EPS ¥173.88; EBITDA 3,500 (18.6%); annual dividend ¥25.00 (+¥2.00); assumed USD rate ¥150 (from ¥145). FX sensitivity: ¥1 per USD moves H2 operating profit by about ¥1.0 billion. Message: a second straight year of record profit on strong commercial engine and energy LCB growth.
Two-line headline; wide comparison table with August forecast, current forecast (blue highlight), change, FY2025 actual and change vs FY2025; navy outlines around both change columns; FX sensitivity footnote.
Waterfall from FY2025 operating profit of ¥165.5 billion to the ¥270.0 billion target: FY2025 FX and one-offs ▲248 (FX ▲62, real-estate gains ▲224, other +38) give underlying 1,407 (¥100 million); aero +238, energy +220, R&D and other ▲95 give underlying 1,770 (+363); restructuring ▲140, FX and other one-offs +140, and planned asset sales +930 (to fund investment and strengthen finances) reach 2,700.
Three-line navy headline; framed waterfall chart with hatched bars for underlying totals, axis-break marks on tall bars, a navy banner for 'Underlying operating profit +363', and callout boxes for one-offs and asset sales.
Section break introducing the dividend policy.
Same centered-title divider layout.
Dividend per share (split-adjusted for the 7-for-1 split in October 2025): ¥10.0 (FY2021), ¥12.9, ¥14.3, ¥17.1, ¥20.0 (FY2025), ¥23.0 in the August FY2026 forecast and ¥25.0 in the current forecast (interim ¥11.5, year-end ¥13.5), raised ¥2 on strong results. FY2027 and FY2028 bars are shown faded with no values; the aim is sustained growth in dividend per share.
Single headline; column chart with a large sweeping arrow behind it, dashed divider before forecast bars, navy '+2 yen' tag and boxed 25.0 label; inset box with the interim / year-end breakdown; gray banner at bottom.
Section break introducing the appendix data slides.
Same centered-title divider layout.
Segment table (¥100 million): Resources, Energy & Environment orders 3,261 to 1,780 (▲1,481), revenue 1,591 to 1,787, operating profit ▲1 to 7 (0.4%); Social Infrastructure orders 591 to 249, revenue 592 to 393, profit ▲33 to ▲44; Industrial Systems & General-Purpose Machinery orders 2,234 to 2,266, revenue 2,094 to 2,105, profit 170 to 114 (5.4%); Aero Engine, Space & Defense orders 2,703 to 3,314, revenue 2,739 to 3,348, profit 547 to 722 (21.6%); segment total profit 683 to 799; Other profit 68 to 457 (real-estate gains); adjustments ▲57 to ▲107; group operating profit 694 to 1,149.
Dense nine-column table grouped under orders, revenue and operating profit, each with prior, current (blue) and change; segment-total row shaded cyan; margins shown in italic parentheses under profit figures.
Matrix of drivers by segment (¥100 million): business environment +113, LCB expansion +68, cost structure +58, FX +134, SG&A ▲75, restructuring ▲140 (all in Resources, Energy & Environment), other +298, total +455. Aero contributed +175 (environment +90, cost +15, FX +135, SG&A ▲63, inspection-program FX ▲1); Industrial Systems ▲56 after ▲143 in other items, which includes the ▲113 reversal of last year's business-transfer gain; Other +388 includes the +387 change in real-estate gains.
Grid table with drivers as columns and segments as rows; dashed sub-row for the PW1100G-JM FX effect; cyan segment-total row; footnotes explaining starred items and rounding.
Full-year segment forecast (¥100 million): Resources, Energy & Environment orders 4,500 (▲1,747), revenue 4,000, profit 240 (6.0%, +180); Social Infrastructure orders and revenue 1,100, profit 70 (6.4%); Industrial Systems orders 4,600, revenue 4,500, profit 320 (7.1%); Aero Engine, Space & Defense orders 8,400 (+1,368), revenue 8,900 (+2,382), profit 1,500 (16.9%, +375); Other profit 980 (+621); adjustments ▲410; total orders 18,900, revenue 18,800, operating profit 2,700 (14.4%).
Same nine-column grouped table as the H1 segment slide, comparing FY2025 actual, current forecast (blue) and change.
Full-year driver matrix (¥100 million): business environment +250 (aero +280), LCB expansion +80, cost structure +201 (energy +110, aero +70), FX +138, SG&A ▲168, restructuring ▲200 (energy ▲140, adjustments ▲60), other +744 (mostly real-estate gains in Other, +640), total +1,044. Segment totals: energy +180, social infrastructure +32, industrial +12, aero +375, Other +621, adjustments ▲177.
Driver-by-segment grid matching the H1 version, with cyan segment-total row and a rounding footnote.
Revisions since August (¥100 million): Resources, Energy & Environment orders raised 3,600 to 4,500 and revenue 3,900 to 4,000, but profit cut 330 to 240 (8.5% to 6.0%) on restructuring; Social Infrastructure unchanged at 1,100 and 70; Industrial Systems orders 4,600, revenue 4,500, profit 300 to 320; Aero Engine, Space & Defense orders 8,200 to 8,400, revenue 8,700 to 8,900, profit 1,370 to 1,500 (16.9%); adjustments improved ▲550 to ▲410; total orders 17,700 to 18,900, revenue 18,400 to 18,800, operating profit 2,500 to 2,700.
Grouped nine-column table comparing the August forecast, current forecast (blue) and change, with segment-total row in cyan.
The +¥20.0 billion revision breaks down as LCB expansion +50 (energy), cost structure +20 (industrial), FX +130 (aero) and restructuring ▲140 in energy offset by +140 in adjustments (overseas subsidiary restructuring cost booked in the segment rather than corporate), giving +200 in total (¥100 million).
Sparse driver-by-segment grid with mostly empty cells, highlighting only the few revised drivers; cyan total row; rounding footnote.
Orders (¥100 million) H1 1,780 vs 3,261 and FY forecast 4,500 (August 3,600); revenue H1 1,787 and FY 4,000 (August 3,900); operating profit H1 7 (0.4%) and FY 240 (6.0%, August 330). By business, FY orders / revenue: power systems 1,100 / 1,050, carbon solutions 2,000 / 1,350, nuclear 800 / 750, Asia EPC and other 600 / 850. Notes: orders fall after large prior-year carbon-solutions and Asia EPC projects; a ¥14.0 billion overseas restructuring charge is booked, but LCB growth in power systems, carbon solutions and nuclear still lifts revenue and profit.
Three blue-header chart panels (orders, revenue, operating profit) with stacked columns for H1 and full year plus outlined 'previous forecast' bars; data tables for orders and revenue by business below; green 'Supplementary notes' panel at bottom right.
Orders (¥100 million) H1 249 vs 591, FY forecast 1,100 (FY2025 1,332); revenue H1 393 vs 592, FY 1,100 (FY2025 1,319); operating profit H1 ▲44 (▲11.2%), FY 70 (6.4%). By business, FY orders / revenue: bridges and water gates 850 / 880, shield systems 230 / 200, other 20 / 20. Notes: bridges and water gates flat, shield systems down after last year's projects, and orders and revenue lower after the transport-systems and concrete building-materials divestitures.
Same three-panel chart layout with stacked columns, profit bars dipping below zero for H1, business tables and green notes panel.
Orders (¥100 million) H1 2,266, FY 4,600 (August 4,500); revenue H1 2,105, FY 4,500 (August 4,400); operating profit H1 114 (5.4%), FY 320 (7.1%, August 300). By business, FY revenue: vehicle turbochargers 2,100, parking 680, rotating machinery 650, heat and surface treatment 530, logistics and industrial systems 390. Notes: turbochargers improve margins through pricing and fixed-cost cuts despite lower volumes; parking and rotating machinery grow via LCB; profit guidance raised ¥2.0 billion despite the conveyor-business divestiture.
Three-panel chart layout with six-layer stacked columns, outlined previous-forecast bars, business tables and green notes panel.
Orders (¥100 million) H1 3,314, FY 8,400 (August 8,200); revenue H1 3,348, FY 8,900 (August 8,700); operating profit H1 722 (21.6%), FY 1,500 (16.9%, August 1,370). By business, FY orders / revenue: defense aero engines and equipment 2,800 / 3,000, commercial engines 5,000 / 5,000, space 400 / 550, other 200 / 350. Notes: defense orders and sales expand in H2; commercial engine orders and revenue raised ¥20.0 billion and operating profit ¥13.0 billion.
Three-panel chart layout with stacked columns and outlined previous-forecast bars, business tables and green notes panel.
Quarterly segment profit (¥100 million) Q1 FY2025 to Q2 FY2026: 279, 267, 159, 417, 291, 430, with a Q3-Q4 FY2026 average of 388. Adjusted to a ¥145 per USD basis and excluding PW1100G-JM program FX: 240, 284, 155, 381, 223, 341, with a 363 H2 average. Adjusted quarterly averages: FY2023 141, FY2024 286 (including an 18 adjustment for a US airline bad-debt allowance), FY2025 265, FY2026 323.
Wide table with blue header split into quarterly and annual-average blocks; adjustment rows grouped under a vertical label; adjusted-profit row in bold on light blue; footnotes defining the two FX adjustments.
LCB revenue across the energy, social infrastructure and industrial segments indexed to FY2019 = 100%: 113% (FY2020), 118%, 137%, 154% (FY2023), 144%, 155% (FY2025), and 171% forecast for FY2026, shown with stacked LCB and non-LCB revenue of roughly ¥800 to ¥950 billion per year. Divested businesses and urban development are removed from past figures.
Stacked column chart (cyan LCB, blue non-LCB) with a green index line and percentage labels, dotted for the forecast year; legend and two footnotes below.
Three donut charts for H1 FY2026: revenue of ¥779.3 billion split 56% energy, social infrastructure and industrial combined versus 44% aero, space and defense; operating profit excluding real-estate gains of ¥72.3 billion split 10% versus 90%; EBITDA excluding real-estate gains of ¥113.7 billion split 16% versus 84%. Segment EBITDA is segment operating profit plus segment depreciation.
Three donut charts arranged in a triangle, each with its total in the center and underlined segment labels; blue for the three land-based segments, green for aero; footnotes at bottom right.
Regional revenue mix: H1 FY2025 Japan 44%, North America 29%, Asia 12%, China 7%, Europe 6%, other 2%, with overseas revenue of ¥396.2 billion; H1 FY2026 Japan 42%, North America 32%, Asia 11%, Europe 7%, China 4%, other 4%, with overseas revenue of ¥448.5 billion.
Two side-by-side pie charts with underlined period titles, percentage labels inside slices, region labels outside and overseas revenue totals beneath.
Balance sheet (¥100 million), FY2025 year-end to H1-end: total assets 24,285 to 25,409; cash 1,550 to 1,370; trade receivables and contract assets 6,808 to 6,987; inventories 5,042 to 5,906 (+864); total liabilities 17,470 to 17,923; payables 4,014 to 3,509; contract liabilities 3,114 to 3,251; refund liabilities 1,106 to 1,021; interest-bearing debt 4,898 to 5,632 (bonds and loans 4,257, lease liabilities 1,375); total equity 6,815 to 7,486, of which owners' equity 7,221 and non-controlling interests 265.
Full-width three-column table with bold cyan total rows, indented sub-items and the current period highlighted in blue.
Full-year cash flow forecast (¥100 million), unchanged in total: profit before tax 2,600 (+200 vs August), depreciation 800, real-estate gains removed ▲930, PW1100G-JM program spending ▲500, working capital ▲1,000, other 30 (▲200); operating CF 1,000 (FY2025 1,213); investing CF ▲250 (capex ▲1,300); free cash flow 750 (FY2025 1,029). R&D 500 (FY2025 396), capital expenditure 1,300 (976), depreciation 800 (763).
Two stacked tables, cash flow on top and R&D / capex / depreciation below, each comparing FY2025, August forecast, current forecast (blue) and change; working-capital footnotes between them.
Seven-year KPI table FY2020 to FY2026 forecast: orders ¥1,097.0 billion to ¥1,890.0 billion; revenue ¥1,112.9 billion to ¥1,880.0 billion; operating profit from ¥27.9 billion (and a ▲¥70.1 billion loss in FY2023) to ¥270.0 billion; net profit ¥185.0 billion forecast; EPS ¥173.88; EBITDA ¥350.0 billion; FCF ¥75.0 billion; dividend ¥25.00; operating margin 14.4%; ROIC 10.8% (excluding one-offs); ROE 25.6%; CCC 117 days; D/E 0.53x; equity ratio 32.9%. H1 FY2026: operating margin 14.8%, D/E 0.75x, equity ratio 28.4%. Definitions for ROIC, ROE, CCC and D/E are given in footnotes.
Wide striped table with years as columns and KPIs as rows, alternating light-blue bands, plus a separated column for the August forecast; dense definition footnotes below.
Units delivered FY2016 to FY2025 and FY2026: GE engines (GE90, GEnx, CF34, Passport20, GE9X) 810 down to 390 in FY2025 and 236 in H1 FY2026; V2500 340 down to 22 and 15; PW1100G-JM 132 up to 666 and 347; totals 1,282, 1,206, 1,521, 1,571, 842, 789, 918, 1,012, 1,030, 1,078, with 598 in H1 and 1,330 forecast for FY2026. Illustrative pies show new-engine sales of second-generation engines expanding in Phase 1 (2026-2028), and aftermarket scale and share rising in Phase 2 (2029-2031) as profit growth accelerates.
Unit table at top with a diagonal-lined forecast column; three growing pie charts below for 2025, Phase 1 and Phase 2 joined by dashed lines; generation definitions at bottom right.
Turbocharger revenue (¥100 million, Japanese GAAP through FY2018, IFRS after): total 1,746 (FY2016) to 2,237 (FY2025), 1,044 in H1 FY2026 and 2,100 forecast; FY2026 forecast by region Japan 530, China 460, North America 510, Latin America 330, Europe 160, Asia 110. Unit sales 610 (FY2016), peaking at 790, 598 in FY2025, 247 in H1 and 500 forecast (10,000 units).
Single wide table split under 'Japanese GAAP' and 'IFRS' headers, with a light-blue total row and a separate unit-sales row.
Quarterly-average turbocharger revenue (¥100 million) by region: 389 (FY2019), 367, 374, 474, 523, 522, 559 (FY2025), then 527 in Q1 and 517 in Q2 FY2026; units per quarter (10,000) 150, 138, 123, 140, 145, 142, 150, then 126 and 121.
Stacked column chart in green and blue shades by region on the left axis, with a black unit-volume line on the right axis; legend box below.
Toyosu district rental income (¥100 million): 93, 92, 93 (FY2016-FY2018, Japanese GAAP), then 94, 123, 121, 122, 120, 122, 129 (FY2019-FY2025, IFRS) and 57 in H1 FY2026; H1 FY2026 rental income 57 less depreciation 20 and other costs 21 leaves +15. Group investment property at FY2025 year-end: carrying amount 1,448, fair value 3,571, unrealized gain 2,123.
Three numbered sub-sections, each with a compact gray-header table: rental income history, H1 income versus costs, and investment-property fair value.
Property sales: two Koto-ku land and building sales of about ¥15.3 billion and ¥24.0 billion in Q1 (announced April 20, 2026) plus about ¥3.3 billion of other sales give ¥42.6 billion booked in H1; planned for H2 are Koto-ku land (about ¥14.6 billion, Q3), Koto-ku land and building (about ¥8.8 billion, Q4) and other properties (about ¥27.0 billion), totaling ¥50.4 billion, for a full-year plan of ¥93.0 billion in gains.
Single five-column table (No., property, gain, timing, announcement date) with light-blue header and gray subtotal and total rows.
Closing slide with the IHI logo and 'Realize your dreams' tagline, plus a disclaimer that forecasts are based on currently available information, involve risks and uncertainties including political and economic conditions and the yen exchange rate, and should not be relied on alone for investment decisions.
White field with blue side bars; centered logo and tagline; bordered disclaimer text box in the lower third.
Common questions about this slide and the underlying presentation content.
It is IHI Corporation's 42-page results deck for the first half (April to September 2026) of fiscal year 2026, which runs from April 2026 to March 2027. Released on November 4, 2026 under IFRS, it covers H1 results, the revised full-year forecast, shareholder returns and an appendix of segment and KPI data.
The original is a Japanese-language document (第2四半期決算説明資料, the Q2 financial results presentation) that IHI filed on TDnet, the Tokyo Stock Exchange's timely disclosure system. The slides are in Japanese; this page gives an English summary of every slide, keeping IHI's own ¥100 million (億円) units so the figures match the original.
Revenue rose 9.2% to ¥779.3 billion and operating profit to a record ¥114.9 billion (14.8% margin), including ¥42.6 billion of real-estate gains. Excluding those gains, operating profit was ¥72.3 billion (9.3%). Net profit attributable to owners was ¥84.9 billion, while orders fell 12.8% to ¥778.7 billion after a large energy order in the prior year.
For the second time this year, IHI raised its forecast above the August figures: orders to ¥1.89 trillion (+¥120 billion), revenue to ¥1.88 trillion (+¥40 billion), operating profit to ¥270 billion (+¥20 billion) and net profit to ¥185 billion (+¥13 billion). The annual dividend goes up ¥2 to ¥25 per share, and the assumed exchange rate moves to ¥150 per US dollar.
Mainly the Aero Engine, Space & Defense segment, where commercial engine aftermarket sales (spare parts and MRO, led by the PW1100G-JM) lifted H1 segment profit to ¥72.2 billion at a 21.6% margin. Lifecycle business growth in energy (power systems, carbon solutions, nuclear) and planned real-estate sales of ¥93.0 billion for the full year also contribute.
Yes. It shows the program's FX revaluation effect on revenue, its cash spending (▲¥22.4 billion in H1 and ▲¥50.0 billion planned for the year) as a separate cash-flow line, and states that the estimated total USD cost is unchanged. The quarterly aero profit table also strips out the program's FX effect.
Yes. The original PDF is free to download from this page, and you can view each slide image here. Copyright in the content belongs to IHI Corporation, so use it for research and reference.
Its structure works well as a model: a KPI-card highlights page, summary tables with a highlighted current period, profit-bridge waterfalls that separate underlying earnings from one-offs, segment pages pairing charts with tables, and a multi-year KPI appendix. You can recreate that layout with your own data in 2Slides.
Original Japanese-language deck filed on TDnet on November 4, 2026

Create Your Own Slides
Turn your ideas into professional presentations in seconds with 2slides AI.
Reference professional designs, choose your style, and generate slides with perfect text rendering. Powered by Nano Banana—start creating your presentation now.
Your AI Agent for slides. Save time, shine faster with intelligent presentation creation.


© 2026 2slides. All rights reserved.