
Part of Investor presentation examples
ICL Q3 2026 Earnings Presentation: the 26-slide third quarter 2026 financial results deck of ICL Group Ltd. (Israel-based specialty minerals company covering potash, bromine, phosphate solutions and growing solutions), presented November 11, 2026 by President and CEO Elad Aharonson and CFO Asaf Alperovitz. It was filed with the SEC as an exhibit to Form 6-K on 2026-11-10. Amounts are in US$ (US dollars) unless stated; the deck is in English. It covers 3Q'26 sales of US$1.9B, adjusted EBITDA of US$402M, segment results, key market indicators, FY'26 guidance, a strategic update (new organizational structure in 2027, ELEVATE efficiency program) and an appendix of reconciliation tables.
Uses this deck’s cover as a style reference for slides made from your own content. Or pick any page below to use its layout as the reference.
Quick Navigation
Tags
Share the slides
ICL Q3 2026 Earnings Presentation: the 26-slide third quarter 2026 financial results deck of ICL Group Ltd. (Israel-based specialty minerals company covering potash, bromine, phosphate solutions and growing solutions), presented November 11, 2026 by President and CEO Elad Aharonson and CFO Asaf Alperovitz. It was filed with the SEC as an exhibit to Form 6-K on 2026-11-10. Amounts are in US$ (US dollars) unless stated; the deck is in English. It covers 3Q'26 sales of US$1.9B, adjusted EBITDA of US$402M, segment results, key market indicators, FY'26 guidance, a strategic update (new organizational structure in 2027, ELEVATE efficiency program) and an appendix of reconciliation tables.
Detailed view of each slide page, including layout, key content and visual elements.
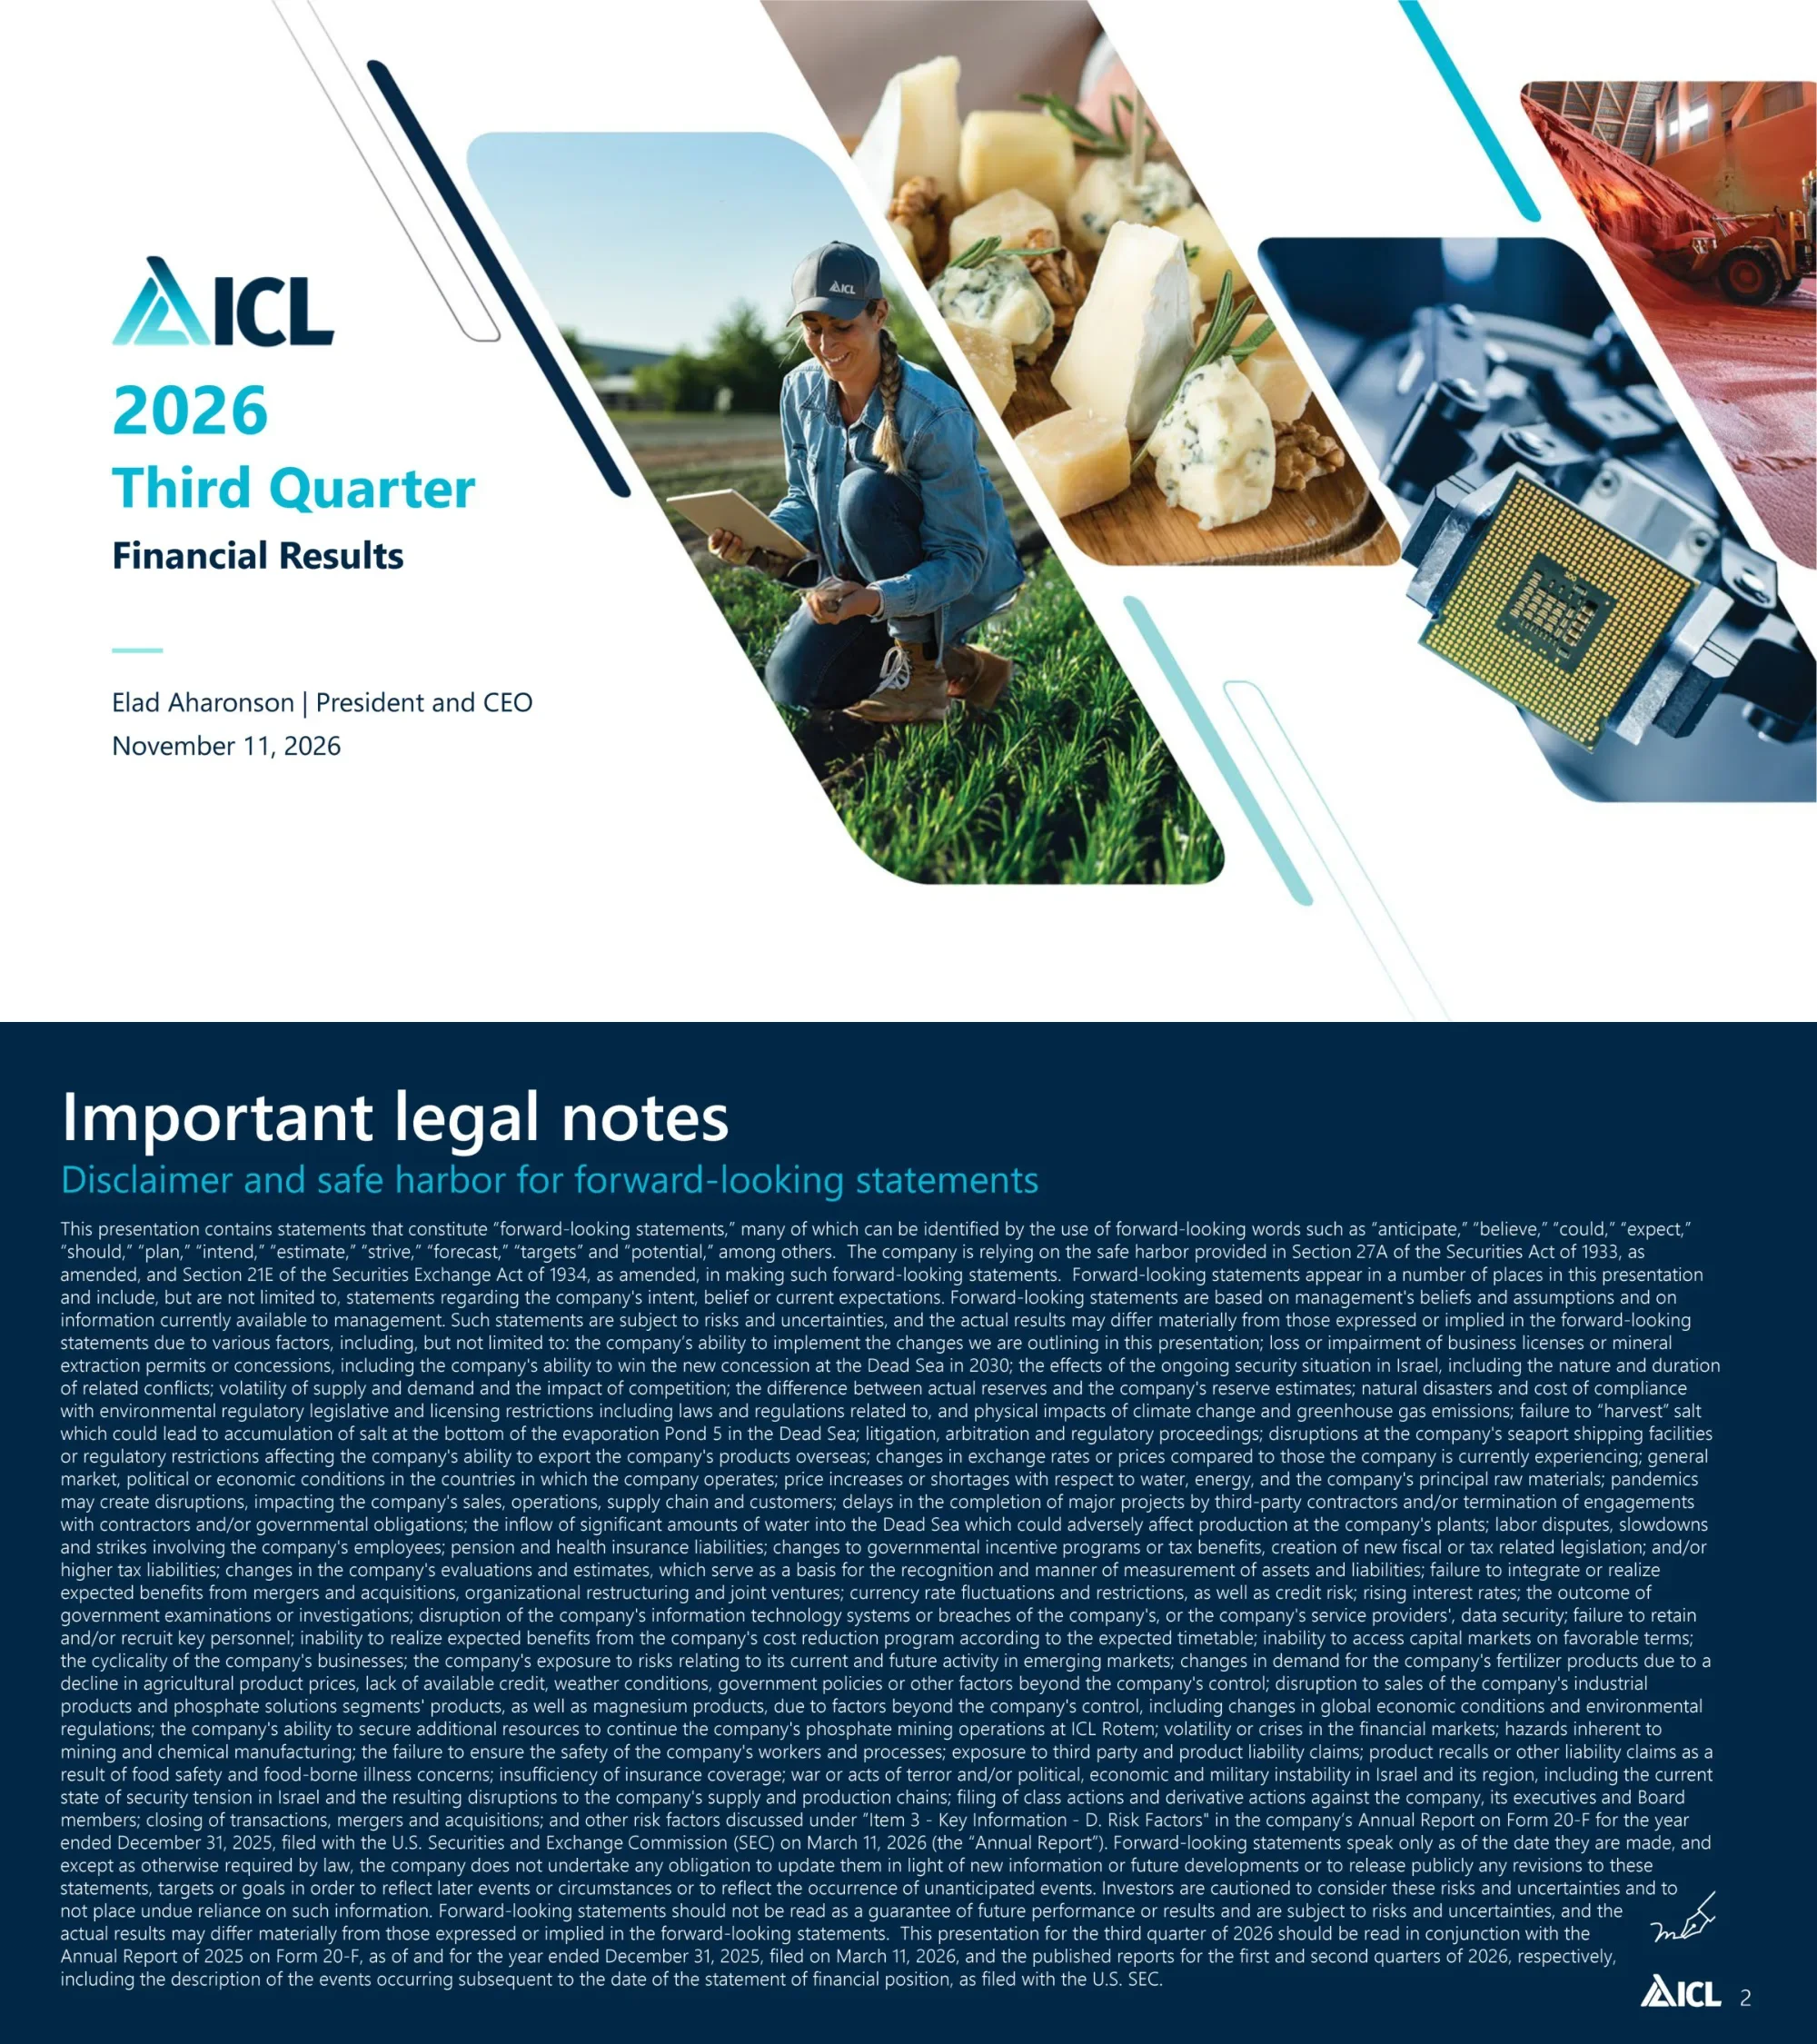
Cover slide titled 2026 Third Quarter Financial Results with the ICL logo, presenter Elad Aharonson (President and CEO) and the date November 11, 2026.
Left column holds logo, large teal title and presenter block; right side is a collage of five parallelogram-cropped photos (farmer with tablet, cheese board, microchip, potash pile) separated by diagonal navy and teal stripes.
Forward-looking statements disclaimer relying on the Section 27A / Section 21E safe harbor, listing risk factors such as the Dead Sea concession in 2030, the security situation in Israel, raw material prices and currency. It says the deck should be read with the Annual Report on Form 20-F for 2025 filed on March 11, 2026.
Dark navy slide with a white title, teal subtitle and a single dense block of small white body text filling the page; logo and page number bottom right.
Six KPI tiles: total sales US$1.9B, adjusted net income US$126M, adjusted EBITDA US$402M, adjusted diluted EPS US$0.10, operating cash flow US$256M and free cash flow US$66M. Highlights vs. 3Q'25: sales up 3%, gross margin 32.9% (highest since 4Q'24), adjusted net income up 2%, adjusted EBITDA up 1%, record raw material prices managed, targeted price increases.
Left 3x2 grid of rounded KPI cards with line icons and big teal numbers; right white panel with a bulleted highlights list; green field photo fading in the background; footnote on non-GAAP measures.
One-line summaries per segment: Industrial Products had a strong quarter on higher bromine prices and improving demand; Potash saw higher prices partially offset by FX headwinds and higher energy and logistics costs; Phosphate Solutions showed resilience with specialty offerings against higher sulfur prices; Growing Solutions exercised discipline on pricing, mix and controllables.
2x2 grid of rounded cards, each with a photo on the left with a slanted edge and a teal heading plus short description on the right; forest aerial photo as background.
Divider slide for the financial section, naming Asaf Alperovitz, CFO, as presenter.
Centered layout on solid navy: logo mark at top, large white title, teal subtitle, presenter name and role at the bottom.
Segment sales rose from US$295M in 3Q'25 to US$347M in 3Q'26; EBITDA rose from US$67M (23% margin) to US$100M (29% margin). Drivers: higher bromine prices, bromine and phosphorus flame retardants, clear brine fluids and specialty minerals with improved pricing.
Left stacked Sales and EBITDA two-bar charts (teal prior year, navy current year with margin labels); right white card with Key developments bullets; microchip photo top right; non-GAAP note at bottom.
Segment sales US$469M vs. US$453M; EBITDA US$157M (33% margin) vs. US$169M (37%). Average potash CIF price per ton was US$370 vs. US$353 in 3Q'25; production of 1.1Mmt in line; results hit by a stronger shekel and higher energy and logistics costs.
Same segment template: stacked Sales and EBITDA bar pairs on the left, Key developments card on the right, potash pile and loader photo top right.
Segment sales US$589M vs. US$605M; EBITDA US$118M (20% margin) vs. US$134M (22%). Pricing actions offset record sulfur costs; Food and Industrial grew, Fertilizers declined on lower demand; sulfur purchase prices improving in 4Q'26. Footnote splits Phosphate Specialties (US$396M sales, US$58M EBITDA) and Commodities (US$193M sales, US$60M EBITDA).
Same segment template with a longer seven-bullet Key developments card and a two-line footnote; cheese photo top right.
Segment sales US$538M vs. US$561M; EBITDA US$44M (8% margin) vs. US$50M (9%). Improved pricing partially offset higher input costs and lower demand; Brazil soft, North America stable, Asia up, Europe affected by farmer affordability, Turf and Ornamental up on higher prices.
Same segment template: two stacked bar charts left, regional bullet list right, farmer photo top right.
Four line charts from 3Q'22 to Oct'26: Grain Price Index (corn, rice, wheat, soy, GPI in US cents per bushel), farmer sentiment index, raw material prices (sulfur, urea, potash, TSP in US$) and Supramax timecharter average (US$/day). Sulfur shows a sharp rise in 2026; exact data points are not legible. Sources cited: CME, Purdue/CME Ag Economy Barometer, CRU and Hudson Shipping.
2x2 grid of white chart cards over a forest aerial background; line charts with rotated quarter labels on the x-axis; source notes at the bottom in small italics.
Three line charts: Chinese bromine price trend (US$, internal estimates), U.S. retail trade and food services sales (US$M, Census Bureau via FRED) and USD vs. NIS index. The bromine trend is lower in 2023 to 2024 then rises in 2025 to 2026, and the USD vs. NIS index falls, meaning a stronger shekel; exact values are not legible.
Three side-by-side white chart cards in the middle band of the slide, forest aerial photo fading in on the right; source notes with underlined links at the bottom.
Sales rose from US$1,853M to US$1,910M. By segment: Industrial Products +US$52M, Potash +US$16M, Phosphate Solutions -US$16M, Growing Solutions -US$23M, Other +US$28M; 3Q'26 split is IP US$347M, Potash US$469M, PS US$589M, GS US$538M, Other -US$33M. By driver: volume -US$134M, price +US$171M, exchange rate +US$20M.
Two white cards with waterfall charts side by side: segment bridge with a stacked composition bar, and a driver bridge; green for increases and red for decreases; turquoise beach photo as background.
Adjusted EBITDA rose from US$398M to US$402M. By segment: IP +US$33M, Potash -US$12M, PS -US$16M, GS -US$6M, Other +US$5M. By driver: volume -US$22M, price +US$171M, exchange rate -US$43M, raw materials -US$103M, energy -US$10M, transport -US$21M, operational and other +US$32M.
Two white cards with waterfall charts mirroring the previous slide; right chart has eight movement bars; beach photo background.
Four cards: cash resources US$2.2B available; operating cash flow US$256M and free cash flow US$66M; net debt to adjusted EBITDA 1.5x; shareholder return of a US$63M 3Q'26 dividend and a 4.1% annual yield. All metrics are as of 9.30.26.
Row of four white rounded cards across the upper third; faded aerial photo of a tractor and harvest trailer fills the lower half; three-line footnote defining the metrics.
FY'26 guidance reiterated: adjusted EBITDA of US$1.5B to US$1.7B, potash sales volumes of 4.5Mmt to 4.7Mmt and an annual adjusted tax rate of about 30%. A banner says the company continued to resiliently manage controllables.
Three tall guidance cards with shield icons on top, a full-width banner card below, and a photo of two workers in hard hats on the right; footnote explaining why EBITDA is the guided metric.
Divider slide opening the strategic section with Elad Aharonson, President and CEO.
Centered layout on solid navy: logo mark, white title, teal subtitle, presenter name and role.
Shows the 2027 structure in four units grouped under Food, Industrial and Agriculture: Nutrition Solutions (adds supplements and pharma; departs industrial phosphates and phosphate commodities), Industrial Products (existing IP plus industrial phosphates; supplements and pharma leave), Growing Solutions (remains specialty crop nutrition) and Essential Minerals (potash plus phosphate; adds phosphate commodities).
Four vertical columns with photo headers, each with white sub-cards and Additions and Departures boxes with colored outlines; curly-brace group labels Food, Industrial and Agriculture across the bottom.
Organic and inorganic growth examples: Bartek integration on track with cross-selling of new bakery and confectionery products (Bear-y Delicious Gummies, Lemon Custard Cake Shooter, Lemon-y Custard); Industrial Products leveraging technology for AI infrastructure growth; Growing Solutions advancing biostimulants and new products.
Three columns with photo headers (Nutrition Solutions, Industrial Products, Growing Solutions), a white text card under each, product image thumbnails, and Food, Industrial and Agriculture brace labels.
Implementation on track. Sources of savings: increase productivity 50% to 60%, reduce external spend 30% to 40%, optimize SG&A 10% to 20%. Estimated benefit to adjusted EBITDA is more than US$150M in the FY'27 plan plus more than US$200M in the FY'28 plan, totaling more than US$350M versus the current run-rate.
Left card with three teal-tinted rows (lever, description, large percentage range); right card with two navy bars, plus and equals symbols, and a gold callout badge with the total.
Five takeaways: leading with resilience (growth in sales and EBITDA with lower operating costs), pursuing profitable growth with a new organizational structure in 2027, maximizing core through a diversified portfolio, delivering optimization with ELEVATE expecting to meet the 2027 savings target of more than US$150M, and entering 2027 from a position of strength with constructive industry fundamentals.
Five stacked white horizontal cards, each with a line icon at the left, a bold-keyword headline and one sub-bullet; the last card is highlighted in green; green field background.
Closing slide with an investor relations contact email and a link to ICL's interactive data tool on the investor site.
Navy background with logo mark, large white Thank you and widely spaced contact text with underlined links at the bottom.
Divider slide introducing the appendix with segment EBITDA calculations, segment analysis, reconciliation tables and non-GAAP definitions.
Centered layout on solid navy: logo mark, white title Appendix, teal subtitle.
Four tables (3Q'26 vs. 3Q'25, US$M) from segment sales to segment EBITDA. Industrial Products: sales 347 vs. 295, EBITDA 100 vs. 67. Potash: 469 vs. 453, EBITDA 157 vs. 169. Phosphate Solutions: 589 vs. 605, EBITDA 118 vs. 134. Growing Solutions: 538 vs. 561, EBITDA 44 vs. 50; also operating income, D&A and margins.
2x2 grid of grey rounded table cards with navy header rows and a highlighted 3Q'26 column; salt-flat photo top right; footnote on the Phosphate split.
Two tables bridging each segment's sales and EBITDA from 3Q'25 to 3Q'26 by quantity, price, exchange rates, raw materials, energy, transportation and operating and other expenses. For example, Phosphate Solutions EBITDA: price +US$90M, raw materials -US$77M, quantity -US$35M, ending at US$118M.
Two grey cards side by side: Segment Sales table (left) and Segment EBITDA table (right) with four segment columns; evaporation pond aerial photo top right.
Reconciliations (US$M): net income US$129M to adjusted EBITDA US$402M (vs. US$398M); adjusted net income attributable US$126M (vs. US$124M) with adjusted diluted EPS of US$0.10 on 1,291 million diluted shares; operating cash flow US$256M less US$190M capex and similar to free cash flow US$66M (vs. US$129M); net debt US$2,427M over adjusted EBITDA US$1,594M gives 1.5.
Four grey table cards in a 2x2 grid with highlighted 3Q'26 columns; road and forest photo strip on the right edge; three-line footnote.
Text-only page explaining that guidance is given on a non-GAAP basis (consolidated adjusted EBITDA and Potash sales volumes) and defining adjusted operating income, adjusted net income, diluted adjusted EPS, free cash flow and adjusted EBITDA, with a caution against using them as substitutes for IFRS measures.
Navy slide with a teal title and four dense paragraphs of small white text with teal lead-in labels; no charts or images.
Common questions about this slide and the underlying presentation content.
It is a 26-page English deck covering ICL Group's third quarter 2026 results: overview KPIs (sales US$1.9B, adjusted EBITDA US$402M, adjusted diluted EPS US$0.10), four segment pages, market indicators, sales and EBITDA bridges, financial highlights, reiterated FY'26 guidance, a CEO strategic update, and an appendix with reconciliation tables.
It covers the third quarter of 2026 (3Q'26, the quarter ended September 30, 2026) compared with 3Q'25, plus the FY'26 outlook. Figures are in US$ (US dollars), usually in millions unless marked B for billions.
The original deck was filed with the SEC as an exhibit to Form 6-K on 2026-11-10 by ICL Group Ltd., an Israeli foreign private issuer. The cover is dated November 11, 2026 and shows Elad Aharonson, President and CEO; the CFO section is presented by Asaf Alperovitz.
Total sales were US$1.9B (US$1,910M, up 3% vs. 3Q'25), adjusted EBITDA US$402M (up 1%), adjusted net income US$126M, operating cash flow US$256M and free cash flow US$66M. Gross margin was 32.9% and net debt to adjusted EBITDA was 1.5x.
The deck reiterates adjusted EBITDA of US$1.5B to US$1.7B, potash sales volumes of 4.5Mmt to 4.7Mmt and an annual adjusted tax rate of about 30%.
It outlines a transition to a new organizational structure in 2027 (Nutrition Solutions, Industrial Products, Growing Solutions, Essential Minerals), growth examples such as the Bartek integration, and the ELEVATE efficiency program targeting more than US$350M of estimated adjusted EBITDA benefit versus the current run-rate (more than US$150M in the FY'27 plan and more than US$200M in the FY'28 plan).
You can download the slides from this gallery page in the formats offered there. The original publication is a PDF whose pages are images, so text in the converted version may need to be re-typed or re-created in an editable PPTX.
The reusable patterns are the KPI tile grid (page 3), the repeated segment page with Sales and EBITDA mini bar charts beside a Key developments card (pages 6 to 9), the paired waterfall charts (pages 12 and 13), and the dark divider slides. Replace the numbers and photos with your own and keep the navy and teal palette for a similar look.

Create Your Own Slides
Turn your ideas into professional presentations in seconds with 2slides AI.
Reference professional designs, choose your style, and generate slides with perfect text rendering. Powered by Nano Banana—start creating your presentation now.
Your AI Agent for slides. Save time, shine faster with intelligent presentation creation.


© 2026 2slides. All rights reserved.