
Part of Investor presentation examples
Hon Hai (Foxconn) Q3 2026 Earnings Presentation — Hon Hai Precision Industry Co., Ltd. (Foxconn, TWSE: 2317) third-quarter 2026 results deck from its November 12, 2026 investor conference, covering income statement, balance sheet and cash flow in NT$ (New Taiwan dollars), outlook, core strengths and recent events.
Uses this deck’s cover as a style reference for slides made from your own content. Or pick any page below to use its layout as the reference.
Quick Navigation
Tags
Share the slides
Hon Hai (Foxconn) Q3 2026 Earnings Presentation — Hon Hai Precision Industry Co., Ltd. (Foxconn, TWSE: 2317) third-quarter 2026 results deck from its November 12, 2026 investor conference, covering income statement, balance sheet and cash flow in NT$ (New Taiwan dollars), outlook, core strengths and recent events.
Detailed view of each slide page, including layout, key content and visual elements.
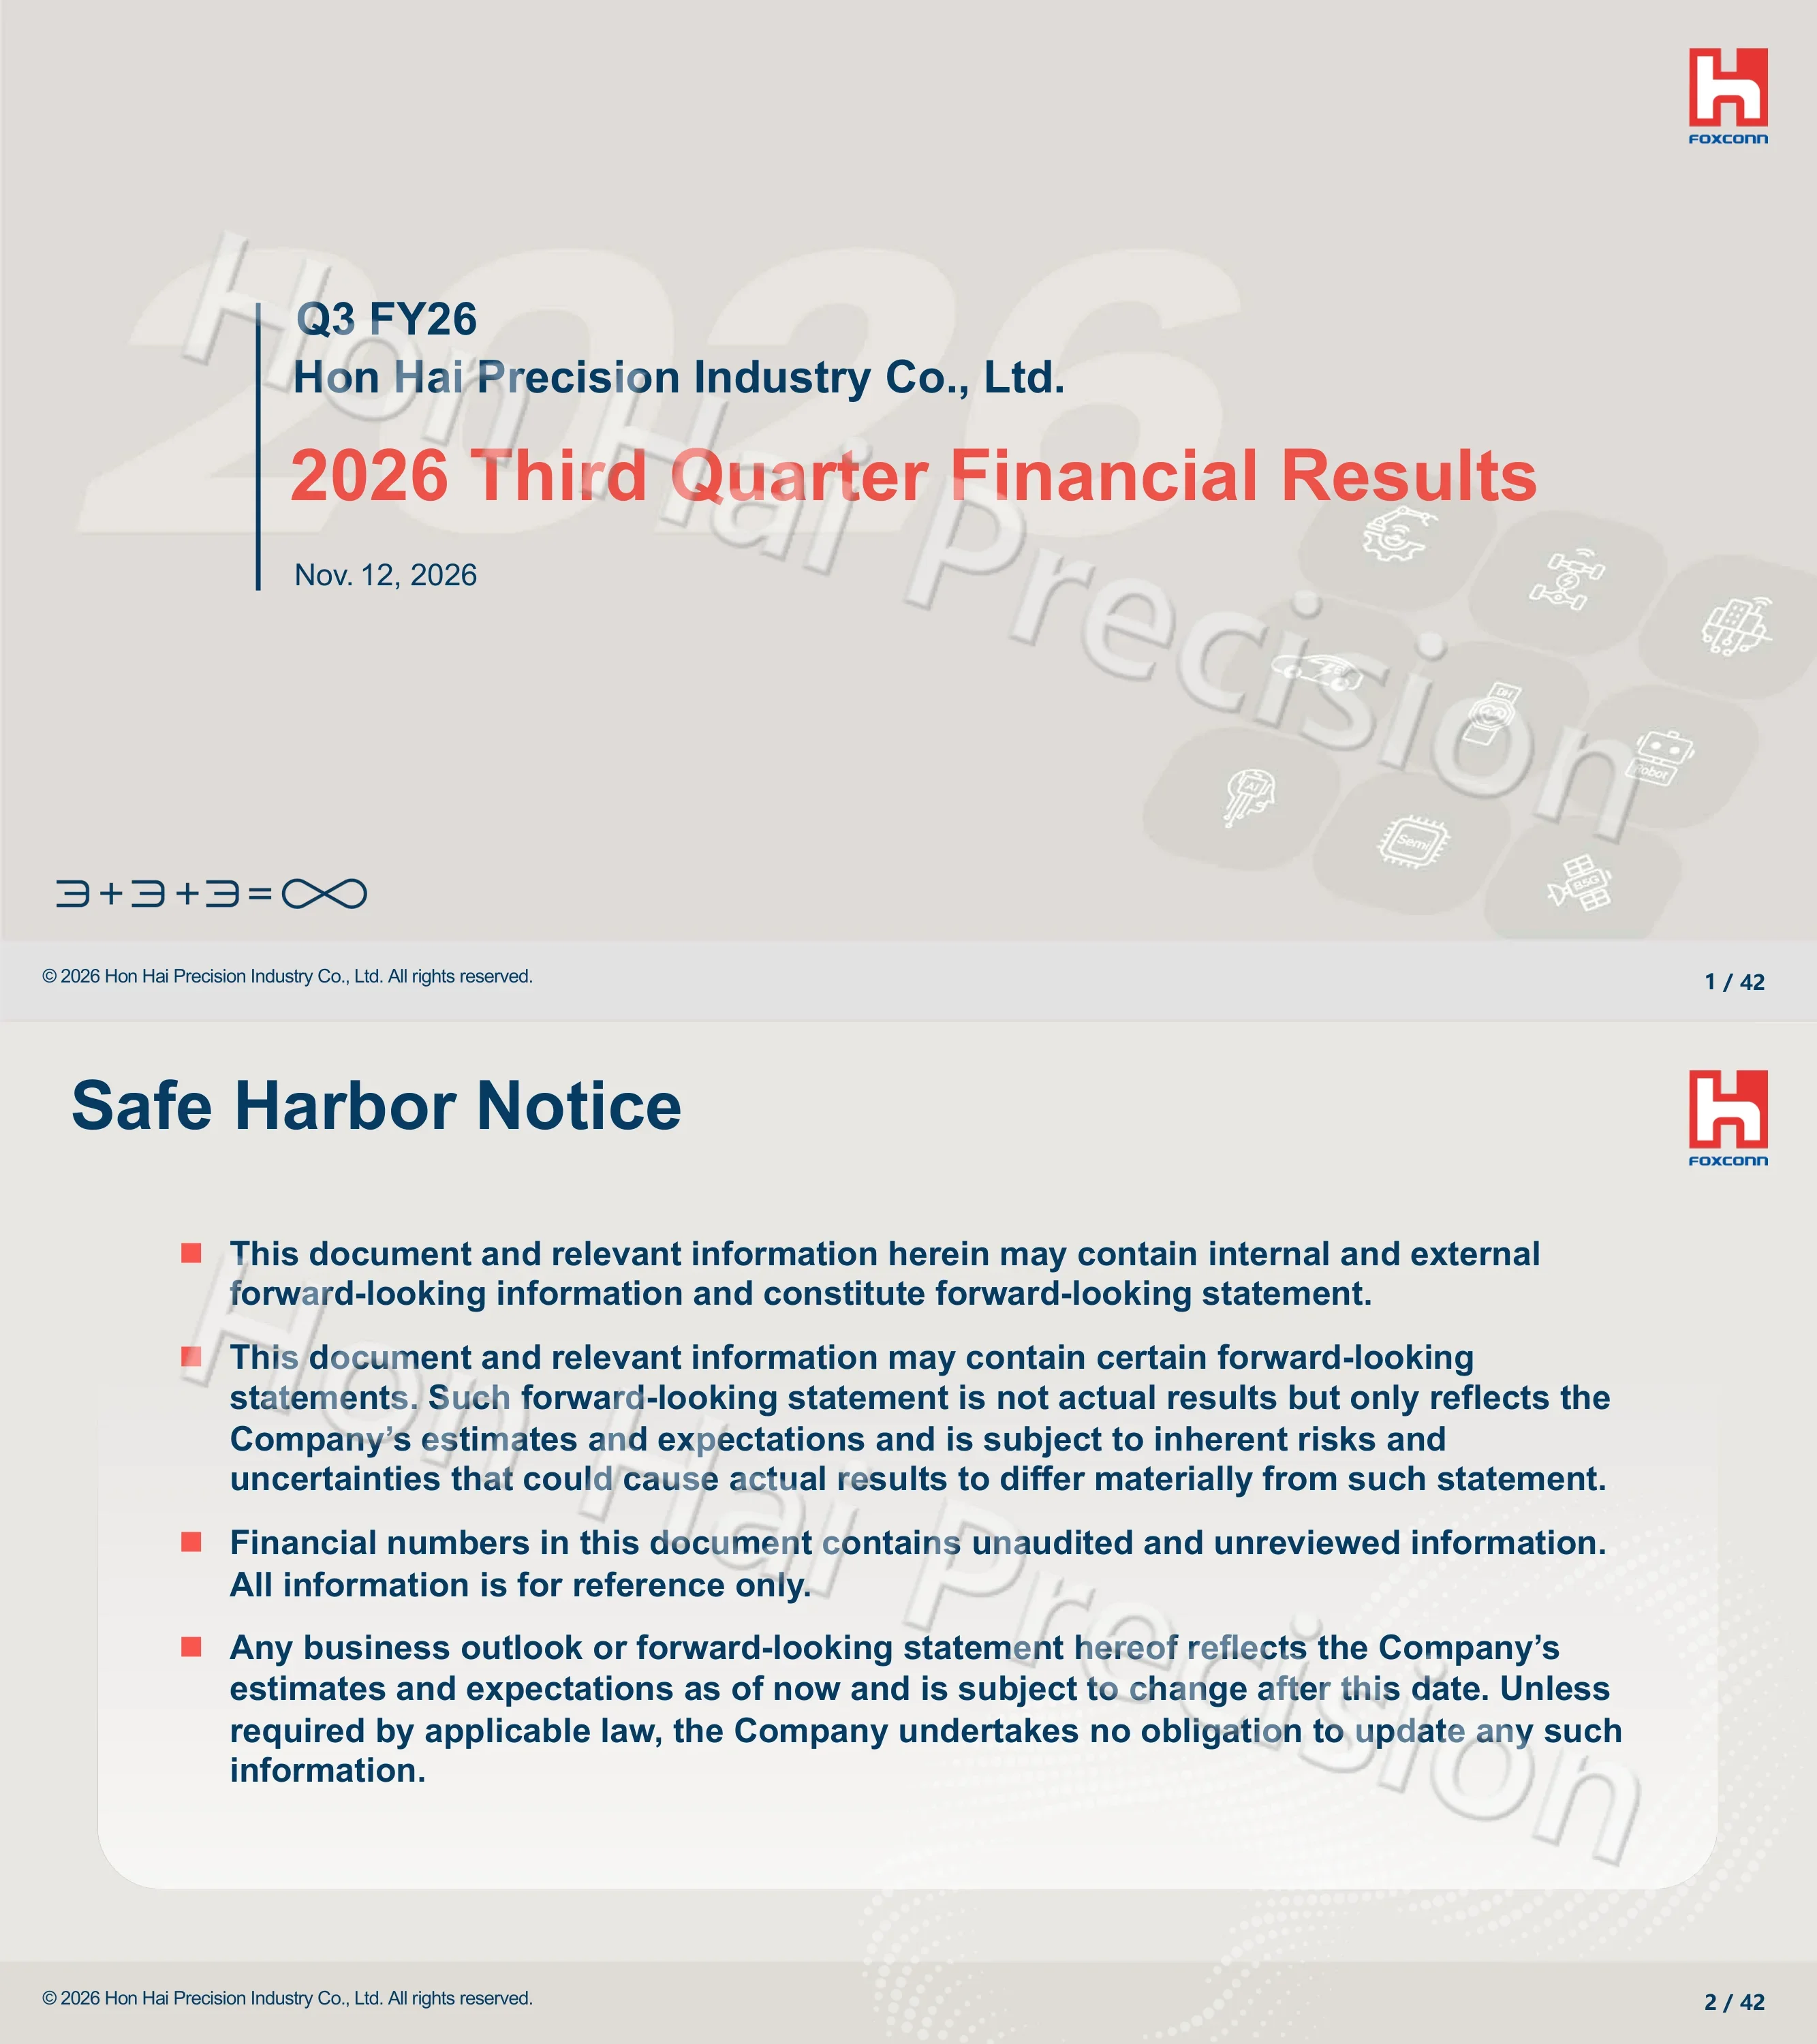
Title slide for Q3 FY26 from Hon Hai Precision Industry Co., Ltd., titled 2026 Third Quarter Financial Results and dated Nov. 12, 2026. The footer shows the 3+3+3=infinity strategy mark.
Left-aligned title block with a vertical navy rule, large watermark text and faint product icons at lower right
Four bullets state that the document may contain forward-looking statements that reflect estimates and are not actual results, that financial numbers are unaudited and unreviewed and for reference only, and that the Company undertakes no obligation to update except as required by law.
Title with four red-square bullets in a rounded panel
Seven-item agenda: 3Q26 Financial Results; 4Q26 & FY26 Business Outlook; FY27 Business Outlook; Major Business Development; HHTD26 Hon Hai Tech Day; Recap of Recent Major Events; Q&A.
Numbered list on the right beside a vertical navy rule, empty left half with watermark
Four takeaways: improved product mix and operational scale drive strong core earnings growth; strong QoQ and YoY growth in 4Q26 with the full-year outlook revised upward; FY27 cautiously optimistic with high double-digit growth in AI racks and market share gains; core strengths in integrated system design and manufacturing, financial strength, vertical integration and ultra-precision machining.
Four numbered text blocks, bold heading plus one-line statement
Section divider announcing section 1, 3Q26 Financial Results.
Large red section numeral at left with navy title and underline over a split light-grey background
Consolidated income statement in NTD millions: Q3/26 revenues 3,015,634 (+19% QoQ, +46% YoY vs 2,058,949), gross profit 181,513, operating income 115,350 (+64% YoY), profit attributable to parent 77,524, EPS NT$5.51 vs 4.15. Margins: gross 6.02%, operating 3.83%, net 2.57%, ROE 4.21%.
Data table with Q3/26, Q2/26, QoQ, Q3/25, YoY columns, margin block below
Nine-month 2026 versus 2025 in NTD millions: revenues 7,661,062 vs 5,496,733 (+39%), gross profit 467,027, operating income 285,802 (+65%), profit attributable to parent 187,417 (+30%), EPS 13.35 vs 10.38. Margins: gross 6.10%, operating 3.73%, net 2.45%, ROE 10.44% vs 8.79%.
Data table with two periods and a YoY column, margin block below
Consolidated balance sheet at 2026.9.30 versus 2026.6.30 and 2025.9.30 in NTD millions: cash 888,100, net accounts receivable 1,822,568, inventory 1,507,485, total assets 6,194,099, total liabilities 3,991,301, total equity 2,202,798, net cash -21,453 (vs 219,809 at June 30). Cash conversion cycle 40 days, debt ratio 64%.
Data table with three dates and QoQ/YoY columns, turnover metrics block below
Cash flow for 2026.1.1 to 9.30 versus 2025 in NTD millions: operating activities (125,723) vs (49,536), investing (80,104) vs (128,345), financing 43,539 vs 154,768, capital expenditures (161,726) vs (112,799), free cash flow (287,449) vs (162,335). A footnote defines FCF as operating cash flow minus capex.
Five-row two-column table with footnote
Revenue mix by product group: Cloud and Networking Products 54%, Smart Consumer Electronics Products 29%, Computing Products 12%, Components and Other Products 5%. Arrow icons compare guidance with actual QoQ and YoY for each group; Computing was guided and came in down QoQ, while the other groups were flat-to-up.
Overall tile plus four colored product tiles with share percentages, below them guidance vs actual arrow grid for QoQ and YoY
Section divider announcing section 2, 4Q26 & FY26 Business Outlook.
Large red section numeral at left with navy title and underline over a split light-grey background
Directional outlook by group. Overall: up QoQ and up YoY. Cloud and Networking: slightly up QoQ, up YoY. Smart Consumer Electronics: up QoQ and YoY. Computing: slightly down QoQ, slightly up YoY. Components and Other: slightly up QoQ, flat YoY. No numeric targets shown.
Overall tile plus four product tiles over a two-row arrow grid (QoQ and YoY)
Full-year 2026 YoY outlook arrows compared between the 2026/8/12 and 2026/11/12 updates. Overall and Cloud and Networking stay up; Smart Consumer Electronics moves from slightly up to up; Computing stays slightly down to slightly up; Components and Other moves from flat to slightly up. Changed groups are boxed in orange.
Same tile layout as slide 12 with two arrow rows labeled by date
9M26 ROE reached 10.44%, higher than 8.79% a year earlier, moving toward the 12% target. The right bar chart shows 9M24 6.84%, 9M25 8.79%, 9M26 10.44%. A line chart shows annual ROE 2020 to 2025 with a dashed 12% target line; individual points are not labeled.
Headline bullet above a line chart at left and a bar chart at right
9M26 operating profit rose 64.6% YoY, outpacing 39.5% revenue growth; 9M26 operating margin reached 3.73%, above the 3% target. Growth chart labels operating profit 15.80% (9M24), 27.6% (9M25), 64.6% (9M26); margin bars show 2.88%, 3.16%, 3.73%.
Two bullets above a three-line growth chart and a margin bar chart with dashed target line
EBITDA grew steadily: annual 2020 to 2025 chart reaches 356,976 for 2025, with 2025 capex labeled 173,763 and stacked dividend distribution. The 9M chart shows 9M26 EBITDA of 369,217 and capex of 161,726 (NTD million). Other bar values are not labeled.
Large stacked bar plus line chart at left, smaller 9M bar plus line chart at right
Section divider announcing section 3, FY27 Business Outlook.
Large red section numeral at left with navy title and underline over a split light-grey background
FY27 outlook slide with the same four product group tiles (Cloud and Networking, Smart Consumer Electronics, Computing, Components and Other) and no direction arrows. Key factors listed: Component Supply, Geopolitics, Inflation, Monetary Policy.
Product tiles above a row of four orange key-factor buttons
Three metrics for integrated system design and manufacturing services: 941 annual NPI projects, 122,000 engineers, 2,492 annual global patents.
Three rounded glass cards with large red numbers
Funding strategy diagram. Long-term: sources are operating profits, mid- to long-term corporate bonds and other equity-related instruments; uses are capex, cash dividends and long-term investments. Short-term: sources are borrowings and cash conversion cycle management; use is working capital. Center badge: D/E 64% robust balance sheet. Banner: Flexible Transaction Models.
Central globe with D/E 64% flanked by long-term and short-term panels, banner below
Foxconn claims at least 50% component supply capability across the upstream-to-downstream chain. Product images are grouped in columns L1-L3, L5, L6-L7, L10, L11 and L12, from components and enclosures to boards, trays and full racks.
Large headline figure over six column panels of product photos
Ultra-precision manufacturing capability highlighted with a 1 micrometer headline figure above a grid of eight photos of precision parts, camera modules and optical components.
Giant red 1 µm number over 4x2 photo grid
Section divider announcing section 4, Major Business Development.
Large red section numeral at left with navy title and underline over a split light-grey background
Strong AI server demand outlook: 4Q26 AI rack shipments show high double-digit QoQ growth; 4Q26 AI server revenue increases QoQ; 2027 AI rack shipments grow at a high double-digit rate; 2027 diverse AI solutions and customer base bring market share gains. A photo shows an NVIDIA Vera Rubin Platform exhibit.
Left bullet list with red outcome text, right photo of AI rack display
Electric Vehicles: acquired a 50% stake in Mitsubishi Electric Mobility, and an overseas customer unveiled an EV model for AUS and NZ with deliveries starting this year. Digital Health: agentic and physical AI with medical centers, smart laboratory automation, mobile nursing carts. Robotics: in-house robots on AI server lines, a robotics intelligence platform, and Futekang established for embodied AI robots.
Three circular image badges with yellow labels and bullets beneath
AI: partnering with NVIDIA on next-gen AI infrastructure in Asia-Pacific, first to introduce 800VDC; FoxBrain ranked No. 2 in a sovereign AI benchmark. Semiconductor: building OSAT plants in India and France, 8-inch fab near full capacity, SiC samples to European OEMs for 800V, automotive MCU in mass production. Next-Gen Communications: second-gen Pearl twin satellites demonstrated inter-satellite links.
Three circular image badges with bullets beneath
Smart Manufacturing: Genesis platform to be delivered by year-end with trial operation planned for December; AI agents speed line deployment. Smart EV: EEA for a Middle East OEM customer entered mass production preparation. Smart City: CityGPT advancing 13 use cases in Taiwan and supporting Bac Ninh Province, Vietnam on a 5-year smart city plan.
Three circular image badges with bullets beneath
Section divider announcing section 5, HHTD26 Hon Hai Tech Day.
Large red section numeral at left with navy title and underline over a split light-grey background
Photo collage of the HHTD26 opening keynotes under the theme Accelerating Intelligence: a speaker on the main stage, a component portfolio slide, a 1+1>2 slide, and guest presentations including NVIDIA, Google Cloud and Mitsubishi Electric Mobility. Text on several images is small and not fully legible.
Large portrait photo at left, grid of eight stage photos at right
HHTD26 had 9 exhibition zones and a record number of exhibits: 321 exhibits, up 44% YoY. Photos show precision manufacturing, NVIDIA Vera Rubin, smart hospital, CNC optimization, satellite, EV and humanoid robot booths.
Headline bullet above a mosaic of booth photos
Three new EV concepts are introduced: MODEL K, MODEL K+ and MODEL A+, shown as product renders from a boxy van-style vehicle to rugged SUVs.
Three vehicle images with labels beneath
Co-hosted sub-forums with Google, TechOrange, Morgan Stanley and 333 Community, including a Taiwan AI Robotics Summit and a Foxconn Investment Summit. Much photo text is in Chinese and partly cropped.
Headline bullet above a 4x2 grid of forum photos
The pavilion had 5 exhibition zones and 15 career experiences, with photos of children's interactive booths including an AI server assembly activity.
Headline bullet above a 3x2 photo grid
New partnerships and activities: a Syntrend watch party, an EVA Air VIP Lounge, and a Videoland The King of Night Market activity.
Three photos with labels beneath
Section divider announcing section 6, Recap of Recent Major Events.
Large red section numeral at left with navy title and underline over a split light-grey background
Foxconn partners with Taiwan's three major energy storage service providers to build energy storage solutions; Foxconn expands its AI footprint at OCP 2026 showcasing NVIDIA Vera Rubin platform innovations; FIT Tech Day 2026 focuses on AI-era optical communications, exploring Light at Scale.
Three photo cards with captions beneath
Announced investment in Kaohsiung Baipu Industrial Park for a production base of next-gen key AI products; partnering with Shiangbao to bring AI to long-term care with validation at three sites; Foxconn at TASTI 2026 showing space communication; helping Yunlin County build Document Brain smart services.
2x2 photo cards with captions
Technology: FIT wins a Red Dot Design Award; FOCS 2026 accepted two quantum computing papers, the only selection from Taiwan; 2026 Future Tech Award for HHRI x NYCU silicon photonics. Leadership: Chairman Young Liu wins the CEO Image Award and an Online Reputation Star recognition; Kathy Yang named to Fortune Most Powerful Women in Asia for the second year.
Two columns of three photo and text rows
Sustainability: CommonWealth Corporate Citizenship Award and Talent Sustainability Award, 2026 TSAA Gold Award for Satoyama School, HR Asia Best Companies to Work for in Asia across four categories. ESG: Ocean Walker 2.0, Hon Hai Education Foundation with NTNU bringing AI courses to high schools, and a 2026 Hon Hai Scholarship of NT$50,000 per recipient.
Two columns of three photo and text rows
Section divider announcing section 7, Q&A.
Large red section numeral at left with navy title and underline over a split light-grey background
Notice that the Extel 2027 Asia Executive Team Survey is open, asking supporters to rank Hon Hai among top choices in the CEO, CFO, IRO and IR Program categories. Voting is open November 10 - 27, 2026. A QR code is shown.
Dark rounded banner with text, QR code, Foxconn logo and ballot box graphic
Closing slide with three icons and labels Share, Collaborate and Thrive, plus the 3+3+3=infinity mark.
Centered row of three icons with red labels on a banded grey background
Common questions about this slide and the underlying presentation content.
It covers the third quarter of 2026 (3Q26, also called Q3 FY26) and the first nine months of 2026, presented at the investor conference on November 12, 2026. It also gives the 4Q26, FY26 and FY27 outlook.
Q3/26 revenues were 3,015,634 million NT$ (New Taiwan dollars), up 19% QoQ and 46% YoY. Operating income was 115,350 million, profit attributable to the parent was 77,524 million, and EPS was NT$5.51. Nine-month ROE was 10.44% versus 8.79% a year earlier.
The English version was filed on Taiwan's Market Observation Post System (MOPS) for the investor conference (法說會). A Chinese version of the presentation also exists.
42 pages. After the title, safe harbor notice, table of contents and summary, the sections are 3Q26 Financial Results, 4Q26 & FY26 Business Outlook, FY27 Business Outlook, Major Business Development, HHTD26 Hon Hai Tech Day, Recap of Recent Major Events, and Q&A.
Cloud and Networking Products (54% of 3Q26 revenue), Smart Consumer Electronics Products (29%), Computing Products (12%), and Components and Other Products (5%).
4Q26 is shown as up QoQ and YoY overall, the full-year 2026 outlook is shown as revised upward, and FY27 is described as cautiously optimistic with high double-digit growth in AI racks. Outlook is shown as direction arrows, not numeric targets.
2slides provides the deck for browsing as a reference. Check the page's download options for available formats.
Yes. It is a useful structural reference for results tables, guidance-versus-actual arrow grids, funding strategy diagrams and event recap pages. Use your own company's data and branding.

Create Your Own Slides
Turn your ideas into professional presentations in seconds with 2slides AI.
Reference professional designs, choose your style, and generate slides with perfect text rendering. Powered by Nano Banana—start creating your presentation now.
Your AI Agent for slides. Save time, shine faster with intelligent presentation creation.


© 2026 2slides. All rights reserved.