
Part of Investor presentation examples · Indian investor presentation examples
Grasim Industries Q2 FY27 Earnings Presentation — the Aditya Birla Group flagship's November 2026 earnings deck, themed "Built on Trust. Scale with Purpose.", covering July–September 2026 results across cellulosic fibres, chemicals, building materials (cement, Birla Opus paints, Birla Pivot B2B e-commerce), financial services and other businesses, with consolidated and standalone annexure tables.
Uses this deck’s cover as a style reference for slides made from your own content. Or pick any page below to use its layout as the reference.
Quick Navigation
Tags
Share the slides
Grasim Industries Q2 FY27 Earnings Presentation — the Aditya Birla Group flagship's November 2026 earnings deck, themed "Built on Trust. Scale with Purpose.", covering July–September 2026 results across cellulosic fibres, chemicals, building materials (cement, Birla Opus paints, Birla Pivot B2B e-commerce), financial services and other businesses, with consolidated and standalone annexure tables.
Detailed view of each slide page, including layout, key content and visual elements.
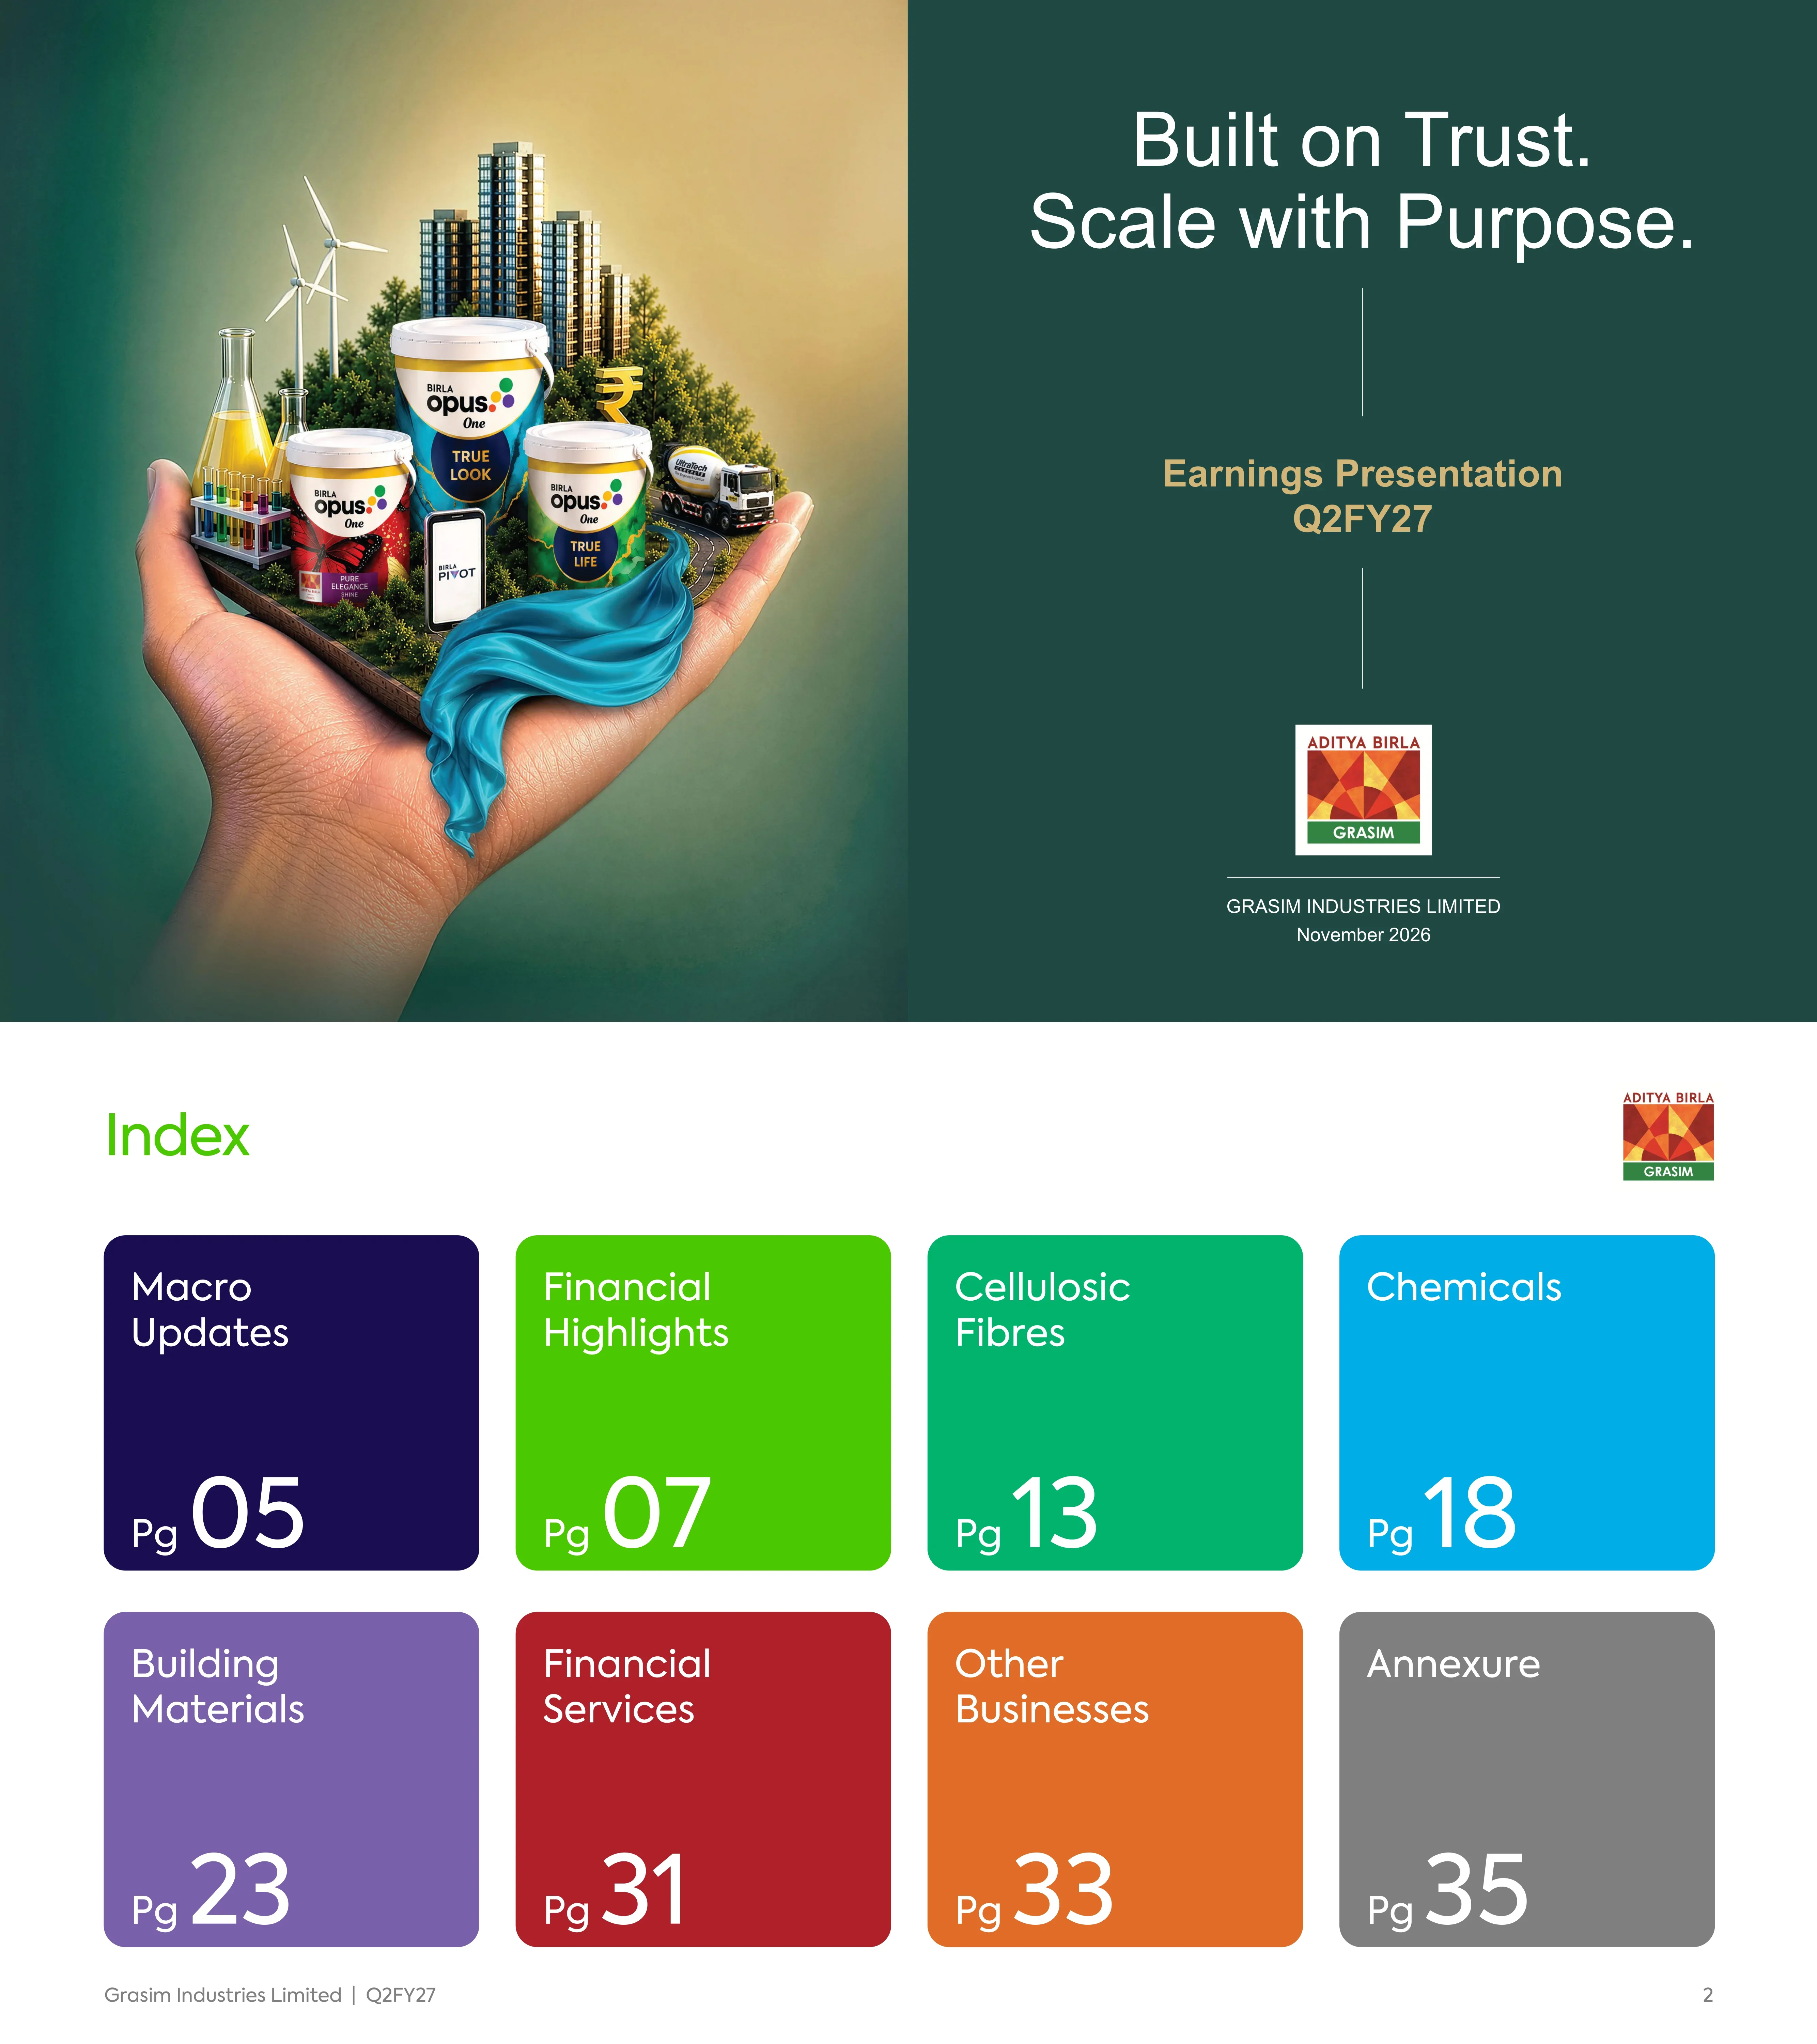
Cover of the Grasim Industries Limited Earnings Presentation for Q2FY27, dated November 2026, with the tagline "Built on Trust. Scale with Purpose." and the Aditya Birla Grasim logo.
Split layout: a full-height illustration on the left and a dark green panel on the right holding the tagline, title, logo and date.
Index of eight sections with page numbers: Macro Updates (05), Financial Highlights (07), Cellulosic Fibres (13), Chemicals (18), Building Materials (23), Financial Services (31), Other Businesses (33) and Annexure (35).
Two rows of four large rounded colour tiles, each with a section name and page number, under a green "Index" heading.
Positions Grasim as a "proxy play on India's growth story" across six themes: aspirational consumption, manufacturing growth, infrastructure and housing demand, digital economy, financialisation and renewable energy, each mapped to its businesses and brands.
Six columns with a theme header on top, a central banner, a list of businesses beneath and brand logos at the bottom, on a sky background.
Trailing-twelve-month figures: revenue ₹1,94,234 crore, EBITDA ₹28,816 crore and PAT (owners' share, before exceptional items) ₹5,861 crore. Charts compare consolidated and standalone revenue and EBITDA for FY25, FY26 and TTM; for example consolidated revenue 1,48,478, 1,75,431 and 1,94,234, with standalone share of 21%, 23% and 24%.
Left column of three large KPIs, two white chart cards with paired bars, and a strip of five strategic priorities along the bottom.
Section divider reading "Macro Updates" with the footer Earnings Presentation | Q2FY27.
Half-width tinted panel on the left with a large title; textured white abstract wave pattern on the right.
Three macro panels: IIP growth 5.4%, 6.2% and 7.3% (Q2FY26, Q1FY27, Q2FY27) with manufacturing at an average 8.1%; India merchandise exports $107.9 billion, $127.4 billion and $132.5 billion (up 22.8% YoY); non-food bank credit growth rising from 10.3% in Sep-25 to 21.4% in Sep-26. Source: Mospi and RBI.
Three equal white cards, each with a chart on top and headline plus bullet commentary below.
Section divider reading "Financial Highlights".
Light green left panel with large green title; white geometric stepped pattern on the right.
Seven-row summary. Consolidated revenue ₹50,105 crore, up 26% YoY; standalone revenue ₹12,747 crore, up 33%; consolidated EBITDA ₹6,513 crore, up 25%. Cellulosic Fibres revenue ₹5,344 crore (up 29%), EBITDA ₹522 crore; Chemicals revenue ₹2,759 crore (up 15%), EBITDA down 11%; Cement revenue ₹23,295 crore (up 19%), volume 38.2 million tons; Paints revenue ₹1,337 crore (up 35%); B2B E-commerce ₹2,785 crore (up 66%); Financial Services revenue ₹13,990 crore (up 32%).
Seven horizontal banded rows, each with a coloured icon label on the left and a bold headline plus two bullet lines on the right.
Consolidated revenue 39,900, 48,716 and 50,105 and EBITDA 5,217, 8,077 and 6,513 (₹ crore) for Q2FY26, Q1FY27, Q2FY27; adjusted PAT 595, 2,153 and 536. Standalone revenue 9,610, 11,795 and 12,747; EBITDA 4,615 in Q2FY27 including dividend income of 4,017; adjusted PAT 3,132.
Two rows (Consolidated and Standalone) by three metric cards, each a three-bar chart, with side labels and footnotes.
Consolidated H1 revenue 68,832, 80,018 and 98,821 (H1FY25, H1FY26, H1FY27) and EBITDA 8,797, 11,647 and 14,591; adjusted PAT 1,561, 2,037 and 2,690. Standalone revenue 14,517, 18,833 and 24,541; standalone EBITDA 5,708 in H1FY27 including 4,017 dividend income; adjusted PAT 3,378 (₹ crore).
Same six-card grid as the previous slide with half-year comparisons.
Table at 30 Sep 2025, 31 Mar 2026 and 30 Sep 2026: net worth ₹99,654, 1,03,469 and 1,07,040 crore; debt to equity 1.25, 1.32 and 1.43; net debt (excluding financial services borrowing) 38,596, 36,915 and 45,756 crore. Net debt to TTM EBITDA is 1.59x versus 1.69x a year earlier.
Five-row ratio table with the latest column highlighted in light green and a full-width green callout banner underneath.
Renewable power capacity share rose from 11% (FY25) to 24% (FY26) and 26% (H1FY27); recycled and reuse water to freshwater withdrawal was 52%, 53% and 51%. Four 2026 awards are listed, including the Greentech Environment and Sustainability Award for the Harihar unit and a CII energy management award.
Two bar-chart cards on top and a bordered awards panel with four award icons below, on a sky-blue background.
Section divider for Cellulosic Fibres with two tags: Cellulosic Staple Fibre (CSF) and Cellulosic Fashion Yarn (CFY).
Mint left panel with large teal title and two rounded tag buttons; fine line pattern on the right.
Cellulosic fibres grew at 3.9% CAGR globally and 9.4% in India between CY15 and CY25 (cotton 0.1% and (0.1%); synthetics 4.1% and 5.6%); India CSF is growing at more than 2x the global rate. Growth drivers include 7% share of the textile fibre basket. Lyocell Phase 1 (55K TPA) cumulative capex is ₹420 crore; Phase 2 is 110K TPA. Source: Wood Mackenzie.
Left hero stat with a fibre photo, right-hand Global and India stacked-bar comparison, a row of four driver tiles and a green lyocell status banner.
China operating rate 89%, 93%, 93% (Q2FY26, Q1FY27, Q2FY27) and 93% in H1FY27; China inventory 15, 7 and 7 days. Global prices ($/kg) in Q2FY27: CSF 1.85, cotton 2.06 and PSF 1.07. Price movement table: international CSF up 23.0% YoY, cotton 19.1%, PSF 27.2%. Source: CCF Group.
Four-quadrant grid: two bar charts, a line chart and a price movement table.
CSF sales volume was 209, 202 and 224 KT (Q2FY26, Q1FY27, Q2FY27), up 7% YoY; H1 was 418 versus 426 KT. Q2FY27 mix: 80% domestic and 20% export; 74% standard and 26% specialty fibres. CFY volume was 11.6 KT, up 2% YoY.
Two bar-chart cards on the left, two donut charts at top right and a green commentary box at bottom right.
Segment revenue 4,149, 4,530 and 5,344 and EBITDA 350, 632 and 522 (₹ crore) for Q2FY26, Q1FY27, Q2FY27; H1FY27 revenue 9,874 and EBITDA 1,154. Revenue grew 29% YoY; CFY remained subdued due to sulphur costs and pressure from Chinese imports.
Two five-bar charts above a full-width green commentary banner with three bullets.
Section divider for Chemicals with tags Caustic Soda, Chlorine Derivatives and Specialty Chemicals.
Light blue left panel with large blue title and three tags; hexagonal molecule pattern on the right.
Capacity (KTPA): caustic soda 1,531 existing plus 25 expansion giving 1,556; chlorine derivatives 1,112 plus 18 giving 1,130; specialty chemicals 246. CPVC project (50K TPA) commissioned Aug'26 and ECH plant (50K TPA) Oct'26 at Vilayat; chlorine integration targeted at about 67% by FY27 exit.
Three tall columns, one per product line, each with a capacity equation at the top and bullets below.
Major end-uses: construction, renewables, water treatment, pharma and healthcare, and PVC applications. Chlorine integration rises from 62% (FY24) to 67% at FY27 exit; captive consumption 49% to 56%. Q2FY27 chemicals revenue mix: chlor-alkali 47%, specialty chemicals 28%, chlorine derivatives 25%.
Top bordered band of five circular photos, bottom-left line chart and bottom-right pie chart with a stacked breakdown of chlorine derivatives.
CFR SEA caustic soda price $449, $483 and $390 per ton for Q2FY26, Q1FY27 and Q2FY27; Grasim ECU ₹32,979, ₹37,955 and ₹33,587 per ton; caustic soda sales 294, 284 and 317 KT. Q2FY27 revenue mix is 47% caustic, 25% chlorine derivatives and 28% specialty. Source: IHS Report.
Four-quadrant grid with three bar charts and one stacked 100% column chart.
Revenue 2,399, 2,640 and 2,759 and EBITDA 365, 491 and 326 (₹ crore) for Q2FY26, Q1FY27, Q2FY27; H1FY27 revenue 5,399 and EBITDA 816. Revenue grew 15% YoY while EBITDA fell 11% on higher power costs in caustic and weaker specialty chemicals profitability.
Two five-bar charts above a blue commentary banner with three bullets.
Section divider for Building Materials with tags Cement, Paints and B2B E-commerce.
Lavender left panel with large purple title and three tags; parquet-style pattern on the right.
India is the second largest cement producer in the world: China holds 44.7% of global production and India 12.2% in the pie chart. Per-capita consumption is about 324 kg for India versus a 2025 world average of 435–485 kg, with China at 1190–1210 kg.
Two cards: a purple-shaded pie chart with legend on the left and a ranked bar chart with a dashed world-average line on the right.
Six cement tiles: grey cement capacity up 4.6 MTPA to 210.1 MTPA; sales volume up 12.9% YoY to 38.2 MnT with domestic realisation of ₹5,176 per tonne, up 2%; consolidated EBITDA up 17.2% to ₹3,832 crore; RMC volume up 23% to 4.65 Mn m3 with 485 plants; green power mix 46.4% in H1FY27, renewable capacity 1.58 GW; UltraTech Building Solutions outlets up 24% to 6,289.
Two rows of three large rounded tiles with a coloured lead-in headline and grey supporting text.
FY27e industry size of about ₹80–82,000 crore, unorganised share about 22–23% and per-capita consumption about 3.5 kg versus a global average of 10 kg. Birla Opus is the second largest player by installed capacity; organised market estimated to grow at over 10% CAGR over the next decade.
Three zones: left stack of three market statistics, centre purple card with Birla Opus logo and capability list, right column of demand-driver tiles.
Six tiles: Birla Opus is the #3 organised player by internal estimates; revenue ₹1,337 crore up 35% YoY and H1FY27 revenue ₹2,999 crore up 50%; 11 new products launched with 63% premium category contribution; second-largest dealer network (60,000+ billed dealers, 12,600+ towns, about 150 depots); 1,760+ stores; #2 in brand score.
Two rows of three rounded tiles, each with a purple headline and bullet details; Birla Opus and Grasim logos top right.
Birla Pivot platform with 50,000+ SKUs and 1,000+ brands covering ten product categories such as steel, cement, tiles, bricks, bitumen, sanitaryware, pipes, ply and metals. Market opportunity: more than $200 billion TAM by 2030 and under 2% digital penetration; industry 3-year CAGR 10%.
Bordered panel with value propositions and market opportunity on the left, Birla Pivot logo and counters in the centre, product categories and demand drivers on the right.
Revenue grew 66% YoY to ₹2,785 crore; annualised revenue run-rate crosses ₹11,000 crore; aim to cross ₹120 billion revenue in FY27; project and retail mix 90% and 10%. Gross margins improving, EBITDA hit by one-time employee expenses, on track to break even in H2FY27; credit-linked commerce via Pivot Vault.
Two rows of three tiles with a purple headline and supporting text; Birla Pivot and Grasim logos top right.
Revenue 22,253, 28,835 and 27,378 and EBITDA 2,950, 5,002 and 3,510 (₹ crore) for Q2FY26, Q1FY27, Q2FY27; H1FY27 revenue 56,213 and EBITDA 8,513. Revenue up 23% YoY, cement revenue up 19% to ₹23,295 crore, EBITDA up 19% to ₹3,510 crore.
Two five-bar charts above a purple commentary banner with three bullets.
Section divider for Aditya Birla Capital Limited's Financial Services with tags NBFC, Housing Finance, Investing and Insurance.
Pale pink left panel with company name, large red title and four tags; plus and cross pattern on the right.
Revenue 10,569, 12,155 and 13,990 (₹ crore) for Q2FY26, Q1FY27, Q2FY27, up 32% YoY; total lending book 1,77,855, 2,19,289 and 2,33,930. PAT up 39% to ₹1,257 crore; housing finance up 43%, life insurance 37%; 13.2 million ABCD app customers; Udyog Plus about 2.42 million registrations and about ₹7,262 crore portfolio.
Revenue and lending-book bar charts above a large red commentary box with four bullets; Aditya Birla Capital logo added top right.
Section divider for Other Businesses with tags Textiles, Renewables and Insulators.
Cream left panel with large orange title and three tags; looping line pattern on the right.
Revenue 996, 1,126 and 1,158 and EBITDA 249, 302 and 284 (₹ crore) for Q2FY26, Q1FY27, Q2FY27; H1FY27 revenue 2,284 and EBITDA 586. Revenue up 16% to ₹1,158 crore; textiles revenue ₹729 crore (up 24%); renewables revenue ₹250 crore with installed capacity 2.2 GWp; insulators revenue ₹158 crore, EBITDA ₹20 crore.
Two five-bar charts above an orange commentary banner with four bullets.
Section divider reading "Annexure".
Light grey left panel with large grey title; white flowing curves on the right.
Q2FY27 versus Q2FY26 (₹ crore): revenue from operations 50,105 vs 39,900 (up 26%); total income 50,439; EBITDA 6,513 vs 5,217 (up 25%), margin 13%; finance cost 1,069; depreciation 2,043; PBT 3,469 vs 2,588; consolidated PAT 1,029; PAT (owners' share) (234); adjusted PAT 536 vs 595. Includes Q1FY27 comparison.
Full-width financial table with Q2FY27 column shaded, YoY and QoQ percent change columns, and footnotes.
Q2FY27 versus Q2FY26 (₹ crore): revenue 12,747 vs 9,610 (up 33%); dividend income 4,017 vs 1,326; total income 16,867 vs 11,030; EBITDA 4,615 vs 1,786, margin 27%; PBT 3,765; exceptional (825); reported PAT 2,306; adjusted PAT 3,132 vs 805.
Full-width financial table with shaded current-quarter column, percent change columns and footnotes.
FY27 planned versus H1FY27 spent (₹ crore): Cellulosic Fibres 1,603 and 573; Chemicals 843 and 243; New High Growth Businesses 425 and 174 (Birla Opus 411 and 172, Birla Pivot 14 and 2); Textiles, Insulators and Others 286 and 32. Total 3,157 planned and 1,022 spent.
Hierarchical table with colour-banded rows per business and sub-rows for expansion and maintenance capex.
At 30 Sep 2026 versus 31 Mar 2026 (₹ crore): standalone net worth 58,688 vs 55,277 and consolidated net worth 1,07,040 vs 1,03,469; consolidated other borrowings 58,395; policyholders' liabilities 1,16,489; sources of funds 87,828 standalone and 6,16,577 consolidated.
Standalone and consolidated column groups with two dates each, shaded current columns and a bold total row.
Application of funds equals 87,828 standalone and 6,16,577 consolidated (₹ crore) at 30 Sep 2026. Standalone investments are 48,372, including AB Capital 21,727; consolidated loans and advances of financing activities are 2,20,038. Net debt is 7,316 standalone and 45,756 consolidated.
Same four-column layout with indented investment sub-lines and bold totals.
Organisation chart under Grasim Industries Limited: Cellulosic Fibres, Chemicals, Building Materials, Other Businesses, Overseas Pulp and CSF JVs, and Subsidiaries, with manufacturing sites. Shows UltraTech Cement (56.11%), Aditya Birla Capital (52.99%), Aditya Birla Renewables (73.76%) and Aditya Birla Power Composites (51%).
Tree diagram with a navy root box, six coloured column headers and lists of plants, JVs and subsidiaries beneath.
Legal disclaimer stating the presentation is for general information only, is not an offer of securities, contains forward-looking statements and that past performance is not indicative of future results.
Green heading above three dense paragraphs of grey justified text.
Closing slide with Investor Relations contact details: grasim.ir@adityabirla.com and +91 22 2499 5657.
Rounded lavender panel on the left with a large Thank You and a green contact box; silky blue-white fabric imagery on the right.
Common questions about this slide and the underlying presentation content.
It covers the second quarter of fiscal year 2027 (Q2FY27) and the first half (H1FY27), dated November 2026. India's fiscal year runs from April to March, so Q2 FY27 is July to September 2026 and H1 FY27 is April to September 2026.
Consolidated revenue was ₹50,105 crore (Indian rupees; 1 crore equals 10 million), up 26% YoY, and consolidated EBITDA was ₹6,513 crore, up 25%. Standalone revenue was ₹12,747 crore, up 33%. Consolidated adjusted PAT was ₹536 crore, and trailing-twelve-month revenue was ₹1,94,234 crore.
It was filed with BSE and NSE as an "Investor Presentation" announcement by Grasim Industries Ltd (NSE: GRASIM, BSE: 500300). The exchange cover letter has been removed from this PDF, so only the 43-slide presentation itself is shown.
The deck has 43 slides. After the cover and index it has Macro Updates, Financial Highlights, Cellulosic Fibres, Chemicals, Building Materials, Financial Services and Other Businesses, followed by an Annexure with income statements, capex plan, balance sheet and group structure, then a safe harbour disclaimer and a thank-you slide.
Cellulosic Fibres (CSF and CFY), Chemicals (caustic soda, chlorine derivatives, specialty chemicals), Building Materials (cement via UltraTech, Birla Opus paints and Birla Pivot B2B e-commerce), Financial Services via Aditya Birla Capital, and Other Businesses (textiles, renewables and insulators).
Yes. The annexure includes the consolidated and standalone income statements, the standalone FY27 capex plan, and balance sheet tables for equity and liabilities and for assets and investments, all in ₹ crore. Slide 11 also shows net worth, debt-to-equity and net debt.
You can browse the slides on this page and use the download options offered on 2slides, subject to availability. The content belongs to Grasim Industries and carries a safe harbour notice, so check its terms before reusing figures.
Yes. It is a good model for a multi-segment earnings presentation: a colour-coded index, a macro section, a divider per business, consistent bar charts for quarter and half-year comparisons, commentary banners and a full annexure. Replace the content with your own data.

Create Your Own Slides
Turn your ideas into professional presentations in seconds with 2slides AI.
Reference professional designs, choose your style, and generate slides with perfect text rendering. Powered by Nano Banana—start creating your presentation now.
Your AI Agent for slides. Save time, shine faster with intelligent presentation creation.


© 2026 2slides. All rights reserved.