
AI Works - A People-First Skills Pilot Exploring AI Adoption in the UK Workplace
Quick Navigation
Tags
Share the slides
AI Works - A People-First Skills Pilot Exploring AI Adoption in the UK Workplace
Detailed view of each slide page, including layout, key content and visual elements.
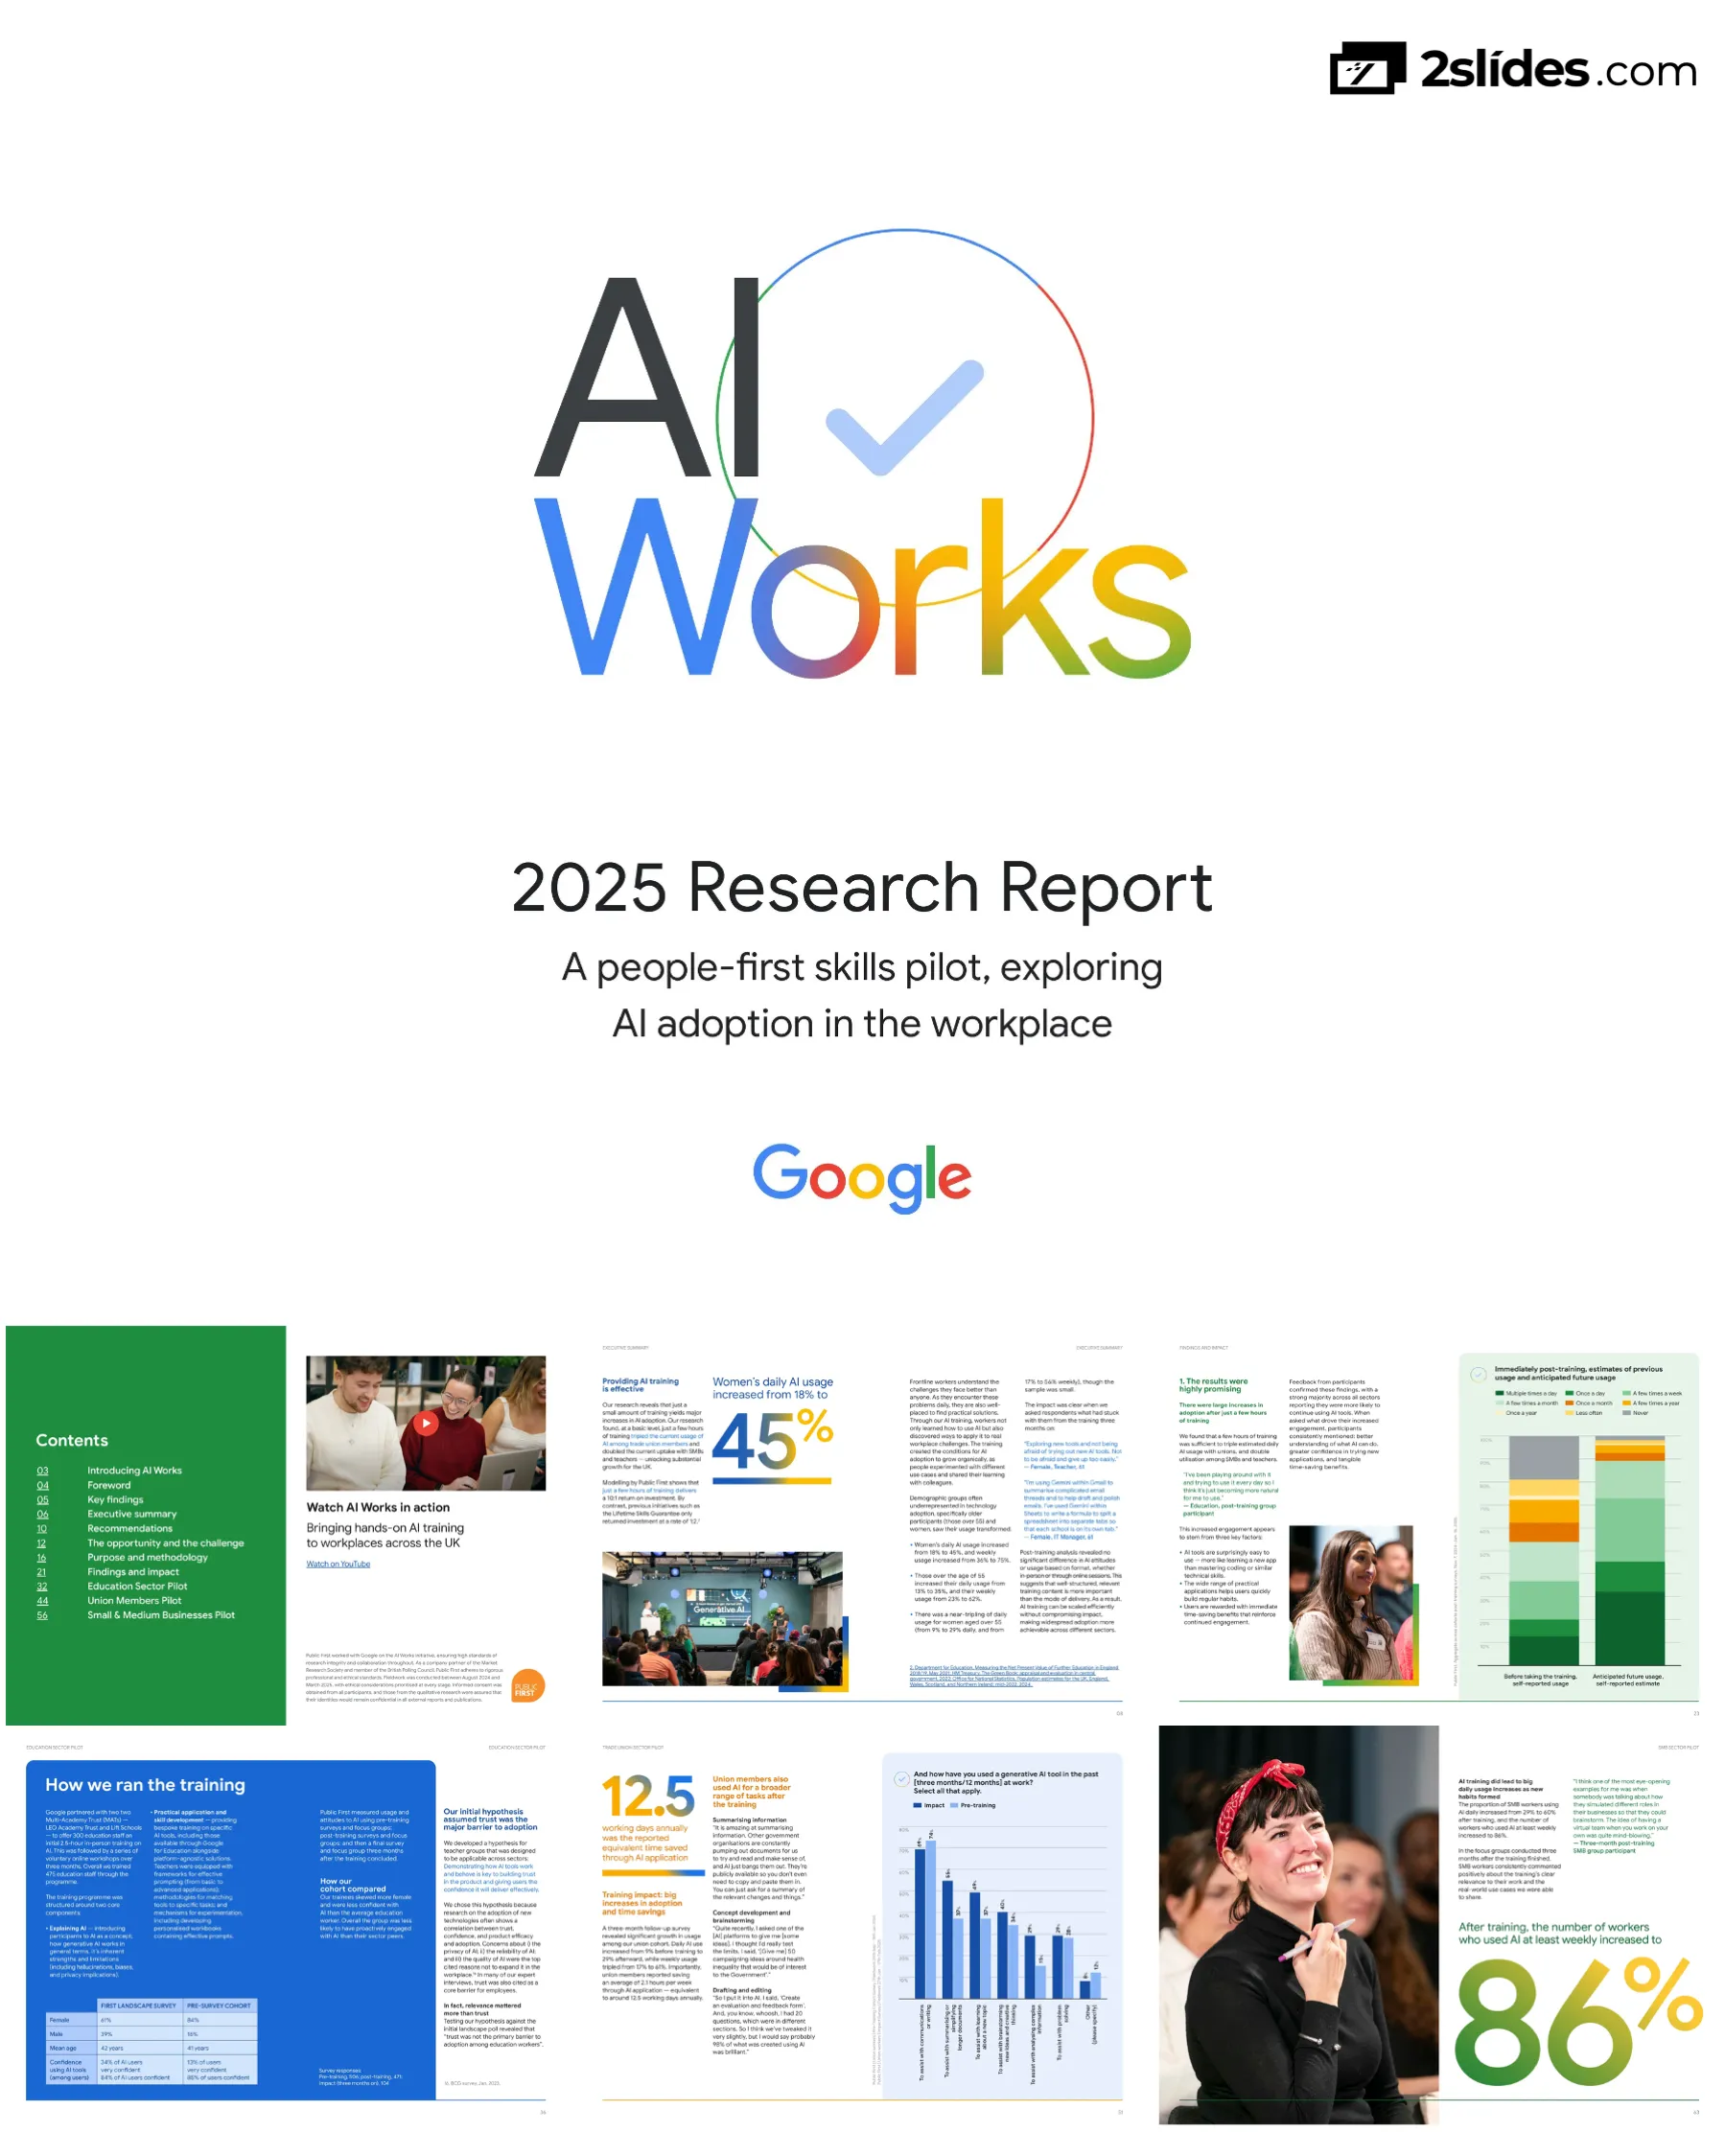
Title slide featuring the colorful 'AI Works' logo with checkmark, tagline about people-first skills pilot exploring AI adoption in workplace, and Google branding
Clean cover design with large AI Works logo, subtitle text, and Google logo at bottom
Comprehensive contents listing with page numbers covering introduction, key findings, executive summary, recommendations, methodology, findings, and three sector pilot deep-dives (Education, Union Members, SMBs)
Two-column layout with green sidebar on left containing contents list and right side featuring video thumbnail and ethical research note
Section introduction page with large '01' number graphic and subtitle describing overview of key findings, research methodology, and policy recommendations
Left side features large colorful '01' number, right side shows black and white photo of workshop participant
Dual forewords from Rachel Wolf (Public First Founding Partner) and Debbie Weinstein (Google EMEA President) explaining the AI adoption challenge, the £400B economic opportunity, and the emerging adoption gap
Two-column layout with quotes from both leaders, emphasizing the productivity opportunity and need for intentional action
Seven major findings presented in visual card format covering: AI habits forming easily, upskilling closing adoption gaps, permission to prompt, habit formation leading to experimentation, positive relationship between optimism and use, AI adoption increasing wellbeing, and time savings exceeding estimates
Grid layout with seven finding cards, large callout box highlighting core insight about training effectiveness
Opens with £400 billion AI economic opportunity for UK, notes that £200B depends on workforce adoption. Details current state: 34% of workers use AI, 66% don't use it, with significant demographic divides
Text-heavy page with bullet points, includes data visualization showing adoption statistics
Describes the pilot program methodology: working with three key sectors (education, SMBs, trade unions), measuring attitudes before/after 2.5-5 hours training, and following up after three months to measure behavioral change
Text content with embedded photo showing training session with diverse participants at tables
Details training impact: tripled usage among union members, doubled usage among SMBs and teachers. Shows 10:1 ROI compared to 1:2 for Lifetime Skills Guarantee. Highlights demographic transformation with detailed statistics on women and older workers
Two-page spread with large infographic showing 45% statistic and Google event photograph
Documents attitudinal changes: 80%+ surprised by AI capabilities, 70% discovered new use cases independently, optimism increased 13-22 percentage points across cohorts. Details wellbeing benefits with 122 hours annual time savings
Split page with text on right, large photo portrait on left showing enthusiastic participant
Policy recommendations for Industrial Strategy and Skills England, including: businesses need support for AI tools/skills/guidelines, Skills England should create micro-credentials system, modular training recognition needed
Two-page spread with recommendation text on right, engaging training photo on left showing presentation
Recommendations for government: guarantee AI training for all public sector workers, launch larger-scale trial, appoint AI leaders in every department, integrate AI into Civil Service Fast Stream, assess Digital Fast Stream coverage
Continued recommendations section with portrait photo of public sector worker
Introduces section explaining why AI's economic potential remains largely untapped and stakes for UK. Large '02' chapter number with black and white participant photo
Chapter divider with large colorful number graphic and documentary photography
Discusses UK's £400B AI opportunity, technology adoption challenges, productivity lag versus G7, digital divide risks, and notes this is chance to break cycle of slow adoption
Single column text with pull quote callout and reference citations
Data visualization showing generative AI usage at work by demographics: dramatic gap between men under 35 (highest) and women 55+ (lowest - four times less likely to use AI)
Bar chart with six demographic categories showing percentage who have used generative AI tools at work
Second chart showing AI usage strongly correlates with income, rising from 10-20% for lowest earners to 70% for those earning £100K+. Notes that 34% of people use AI at work with high frequency among adopters
Line/area chart showing income brackets and usage percentage, with supporting text
Introduces methodology section explaining pilot program design to identify AI adoption barriers and test targeted training. Large '03' chapter number
Split page with large number graphic and documentary photograph of two participants collaborating
Details research approach: expert interviews with 18 stakeholders, hypothesis development for three sectors (education/SMBs/unions), landscape polling of 3,100 workers in August 2024 and March 2025
Timeline/process flow with text boxes and participant photograph
Comprehensive timeline from April-March showing: baseline research, sector hypotheses, landscape analysis, pre-training analysis, training delivery (December), post-training research, 3-month impact analysis, and follow-up landscape poll
Horizontal timeline with connected phases, detailed descriptions for each stage
Describes partnerships with LEO Academy Trust, Lift Schools, Community union, and Enterprise Nation. Details training structure: 2.5-5 hours bespoke support tailored to each sector's workplace context
Two-column layout with training details and partner information
Explains three-phase evaluation: pre-training surveys/focus groups, post-training surveys/focus groups, and 3-month follow-up. Notes varied interventions across cohorts for rich insights, with statistical significance testing
Text description with embedded photograph of engaged training participants
Introduces findings section explaining how brief training dramatically increases AI usage with lasting impact on adoption. Large '04' chapter marker
Chapter divider with large colorful number and participant portrait
Key finding that perceived relevance is biggest barrier, not capability/complexity. Notes confidence remains high (80%+) but majority see AI as irrelevant to their roles. Dual challenge: can't see applications and gave up after no immediate benefits
Text content with embedded data showing 44% daily usage among those who do use AI
Before/after comparison charts showing dramatic increase in anticipated AI usage immediately post-training: shifts from 'never' category to multiple-times-daily category across all cohorts
Stacked bar charts comparing 'Before taking training' with 'Anticipated future usage' with color-coded frequency categories
Bar chart showing top reasons for increased usage across three cohorts: time-saving benefits (54-72%), greater understanding of helpfulness (61-69%), understanding how to use effectively (43-63%), confidence experimenting (43-59%)
Horizontal bar chart comparing three cohorts with multiple response categories
Shows predicted versus actual usage three months later across all three cohorts. Minimal drop-off with consistent patterns: Union (9%→57%→35%), Education (19%→57%→47%), SMB (29%→59%→60%). Highlights demographic transformation for women and 55+ workers
Three-bar comparison chart for each cohort showing pre/predicted/actual usage, plus testimonial quotes
Stacked bar chart showing time saved per week across cohorts: most saving 1-3 hours weekly, some 4-6 hours, translating to 122 hours annually - exceeding 100-hour model estimates by 22%
100% stacked bar chart with time-saving categories plus supporting text and embedded photograph
Bar chart showing confidence levels pre-training vs general population. Documents that participants started with lower confidence but training increased fluency dramatically. After 3 months, 70% discovered new use cases, 48% used for brainstorming, 54% for summarizing
Horizontal bar chart comparing confidence across different worker groups, with testimonial quotes
Bar chart showing future AI use intentions across cohorts for various tasks. Highlights development of nuanced understanding and responsible practices. Includes Google's safety approach sidebar
Grouped bar chart by task type with three-cohort comparison, plus Google safety information panel
Paired bar charts showing dramatic increase in technology optimism post-training: Education +22pts (66%→87%), SMB +13pts, Union +9pts. Links increased usage to increased optimism about technology's societal impact
Before/after bar chart comparison for four groups with supporting text and participant portrait
Documents how AI enhances accessibility and inclusion for neurodivergent individuals, special needs education, non-native English speakers, and those with learning differences. Multiple testimonials about AI as support system
Text-heavy page with three powerful testimonial quotes and supporting photograph
Details what made training effective: interactive hands-on sessions, practical demonstrations with real applications, tailored sector-specific content, and AI prompting sessions. Notes no significant difference between online vs in-person delivery
Text with embedded participant engagement photograph showing group learning
Section divider for Education deep-dive showing large '02' number, title slide, and partnership logos for LEO Academy Trust and Lift Schools
Clean section divider with branding and participant photograph
Seven-point summary: AI training low priority for teachers (only 22% choose it), trust not main barrier (relevance is), 'cheating' concerns require explicit permission, adoption doubled post-training with time savings exceeding projections by 10%, administrative tasks are entry pathway, teachers became advocates
Numbered list of findings with partner testimonial quotes in blue boxes
Details teacher crisis: 49% find workload unmanageable, 74% spend too much time on admin, 34% considering leaving due to workload. AI could save teachers 109 hours/year (16% increase in teacher-pupil ratio = 31,000 new teachers)
Text-heavy page with statistics and large typography featuring 'Education' heading
Bar chart showing why education workers don't use AI: lack of relevance to job (38%), insufficient training (27%), no available tools (24%), traditional methods preference (21%). Notes only 18% cite data privacy, 16% trust concerns
Horizontal bar chart with 15 barrier categories and supporting text
Describes training approach: 2.5-hour in-person workshops followed by optional 45-minute online sessions over 2 months. Shows cohort demographics (84% female, mean age 41) with lower AI confidence than sector average. Survey sample sizes provided
Table comparing landscape survey to cohort demographics, plus training methodology
Before/after stacked bar charts showing dramatic shift in AI usage frequency. Pre-training: 46% used weekly, 19% daily. Three months post: 78% weekly, 47% daily. Time savings: 2.9 hours/week = 109 hours/year
100% stacked bar chart comparison with color-coded frequency categories plus testimonial
Grouped bar chart showing AI use increased across all categories: communications/writing (60%→77%), summarizing (41%→74%), lesson planning (23%→51%), problem solving (27%→47%). Includes testimonial quotes about specific applications
Horizontal grouped bar chart with pre/post comparison across six task categories
Documents three factors: habits quickly formed with experimentation following, confidence and trust building through understanding, and AI applications broadening significantly. Includes slider scale charts showing improvements in perceived relevance, usefulness, and ease of use
Text with embedded 1-5 scale comparison charts and participant testimonials
Four categories of teacher AI use with specific examples: Personal productivity (email templates, meeting notes), Planning/organization, Creative content (Canva posters, image generation), and signs of peer-to-peer learning emerging organically
Text organized by use case category with extended testimonial quotes in green text
Details ongoing barriers: reliability and trust concerns for high-stakes classroom use (38% worried about reliability, 20% don't trust for high-stakes), privacy concerns (31%), and uncertainty about whether AI use is 'allowed' - misconception it's 'cheating'
Text-heavy page with embedded documentary photograph of training session
Two case studies: Dave Sweet (humanities teacher using AI for lesson planning, exam prep, resource creation) and Cheryl Narayanan (SEN teacher using AI for accessible, engaging lessons). Both describe transformative impacts and plan to train colleagues
Two-column layout with separate case study boxes, headshots would typically be included
Details three-module training structure: 1) Understand (Intro to AI, Creating with AI, Responsible use), 2) Explore (Prompting, Bring AI into practice, Advanced prompting), 3) Develop (Enhance practice, Plan for future). Six 45-minute sessions or condensed 2.5-hour version
Three-column curriculum outline with module details and learning objectives
Section divider for Union deep-dive showing large '03' number, title slide, and Community union partnership branding
Clean section divider with branding and participant photograph showing mentor relationship
Seven-point summary: £89B potential for union members, understanding and relevance closely linked, cohort had lower confidence citing insufficient training, weekly use tripled post-training, understanding drove increases, permission concerns remain (only 46% confident about employer policy)
Numbered list with Roy Rickhuss CBE testimonial quote in blue box
Opens with £89B economic value potential for union members. Notes high confidence but low adoption patterns among union workers. Discusses historical union role in supporting technological change and addresses job impact concerns
Text with large 'Trade union members' typography overlay on documentary photograph
Bar charts showing union members MORE optimistic than non-members about AI making jobs easier and allowing focus on creative/strategic work. However, slightly more concerned about job displacement (17% vs 11%)
Grouped bar chart comparing union vs non-union attitudes with six response categories
Bar chart showing 62% of union cohort cited insufficient training as barrier - more than second and third barriers combined. Focus group feedback emphasized need for practical use case demonstrations
Horizontal bar chart with 13 barrier categories, with 'insufficient training' clearly dominant
Training program: three 1-hour live webinars, optional in-person sessions for union reps, 30-minute 1:1 mentoring. Cohort demographics: 52% female, mean age 53, only 11% very confident (vs 38% sector average). Total trained: 404 union members
Demographic comparison table and training program details with hypothesis explanation
Dramatic before/after stacked bar chart showing usage transformation. Daily usage: 9%→29%, Weekly usage: 17%→61% (tripled). Time savings: 2.1 hours/week = 12.5 working days annually
100% stacked bar comparison with two bars (pre/post training) and large time savings callout
Grouped bar chart showing use case expansion: communications/writing (69%→74%), summarizing (55%→37%), brainstorming (34%→40%), learning new topics (37%→49%), problem-solving (29%→28%), analyzing (15%→29%). Includes specific examples in testimonials
Horizontal grouped bar chart with pre/post comparison plus testimonial quotes describing specific applications
Bar chart showing why usage increased: 66% 'I understand more about how AI tools work', 65% 'Training helped me understand how to use at work', 29% 'Got into habit', 29% 'Trust tools more'. Includes quotes about accessibility and simplicity
Horizontal bar chart with eight reasons, testimonials emphasizing accessibility
Despite improvements, major barriers persist: only 46% confident they understand employer AI policy, 58% cite security concerns. Quotes about 'cheating' perception and lack of clear government guidance for organizations
Text-heavy with embedded documentary photograph showing group discussion
Two case studies: Tania da Silva (supported living home manager using AI for reports, training, creative tasks) and Carl Ravenhill (steelworker using AI to simplify technical content and organize training materials). Both became advocates encouraging colleagues
Two-column case study layout with detailed impact descriptions
Three-session curriculum: 1) Introduction to AI (key concepts, how it works, responsible use), 2) Getting hands-on (using AI for writing, designing, understanding information, learning skills), 3) Writing effective prompts (prompt engineering, techniques, reviewing outputs)
Three-column curriculum outline with module details
Section divider for SMB deep-dive showing large '04' number, title slide, and Enterprise Nation partnership branding
Clean section divider with branding and participant photograph
Seven-point summary: High confidence but low adoption among SMBs, SMBs lack training capacity (receive less training than large company workers), training is biggest barrier (62%), adoption doubled post-training (29%→60% daily), shift from experimentation to purposeful integration, positive feedback on 1:1 and demo sessions
Numbered list with Emma Jones CBE testimonial quote in green box
Opens SMB results section with paradox: 92% confident using technology, 84% of AI users confident, but only 38% actually use AI despite 71% seeing it as applicable. Notes UK SMBs invest less and lag G7 peers, with training gap evident
Text with large 'SMB' typography overlay on photograph, plus supporting statistics
Bar chart showing 62% cite insufficient training, with other barriers significantly lower. Notes 29% of SMB workers taught themselves most recent skill vs 19% at large organizations, 42% self-taught at smallest companies (<10 employees)
Horizontal bar chart with training barrier dominant, plus supporting text about training gaps
Training program leveraging habit-formation principles: weekly webinars, Lunch & Learn panels, in-person workshops. Designed around Ebbinghaus forgetting curve, social support, and situational cues. Cohort: 57% female, mean age 47, lower confidence than sector. Total trained: 905
Table showing demographic comparison, habit-formation principles explained, training structure
Bar chart showing why SMBs increased usage: 72% 'understand more about how AI tools work', 65% 'training helped me understand how to use it at work', 35% 'got into habit', 35% 'trust tools more', 18% 'tools introduced in workplace'
Horizontal bar chart with usage increase factors, plus hypothesis statement
Before/after stacked bar showing dramatic usage increase. Pre-training: 29% daily. Three months post: 60% daily (doubled), 86% weekly. Represents shift from experimentation to purposeful integration
100% stacked bar comparison with color-coded frequency categories
Grouped bar chart showing use case evolution: communications/writing slightly decreased (82%→79%) as other uses expanded significantly: brainstorming (54%→59%), learning (46%→50%), problem-solving (36%→50%), summarizing (60%→67%). Testimonial about Gemini for spreadsheets
Horizontal grouped bar chart with pre/post comparison across seven task categories plus testimonial
Organized by use case: Creative content generation (marketing campaigns, scripts), Drafting/editing (website content, feedback on pages), Increasing productivity (operations streamlining), Concept development (brainstorming, sounding board). Multiple detailed testimonials for each category
Text organized by category with extended testimonial quotes, includes photograph
Explains progression from occasional use to daily workflow integration. Training helped participants experience immediate benefits that reinforced continued usage. Testimonial about Gemini becoming 'best friend' for spreadsheet work
Text with embedded documentary photograph showing engaged participant
Continues documenting specific use cases with examples: Using NotebookLM for exam reports, AI for brainstorming with 'virtual team', Canva for creative content, AI as personal assistant across all tasks. Shows organic learning and colleague sharing
Text organized by application type with multiple testimonial examples
Details training structure: five 1-hour webinars (Understanding ML, Boost Productivity, Hands-on Tools, Prompt Engineering, Using AI Responsibly), four 30-minute Lunch & Learns (Personal Productivity, Sales, Marketing, Operations), three full-day live sessions. Case study of Dan Menezes Melo at Grind using AI for HR inclusion
Two-column layout with curriculum outline on left, case study on right
Simple back cover page featuring only the Google logo centered on white background
Minimal design with centered logo
Common questions about this slide and the underlying presentation content.
The pilot delivered remarkable results across all three sectors. Daily AI usage doubled among education workers (19% to 47%) and SMBs (29% to 60%), and tripled among union members (9% to 29%). Weekly usage increased dramatically to 71% across all cohorts. Workers reported saving an average of 122 hours annually - exceeding initial estimates by 22%. The training particularly benefited demographics typically underrepresented in technology adoption: women's daily AI usage increased from 18% to 45%, and workers over 55 increased daily usage from 13% to 35%.
The pilots used relatively brief training interventions: 2.5-5 hours of tailored content delivered through various formats including in-person workshops, webinars, and one-on-one mentoring sessions. Education workers received a 2.5-hour initial workshop followed by optional 45-minute sessions over two months. Union members received three one-hour webinars with optional in-person sessions. SMBs received five one-hour webinars plus 30-minute 'Lunch & Learn' sessions. The research found no significant difference in effectiveness between online and in-person delivery, suggesting scalability without quality loss.
Public First modelling shows AI training delivers a 10:1 return on investment through productivity gains and time savings. This compares extremely favorably to previous initiatives like the Lifetime Skills Guarantee, which only returned investment at a rate of 1:2. The UK stands to gain £400 billion from AI-driven growth, with £200 billion dependent on workforce adoption. Workers reported saving equivalent to 122 hours per year, which translates to meaningful productivity increases and the ability to focus on higher-value work rather than administrative tasks.
The research identified different barriers for different groups. For all cohorts, insufficient training was the primary barrier, cited by 62% of SMB and union participants. Contrary to initial hypotheses, trust and privacy concerns were not the main obstacles - perceived relevance to job tasks proved more significant. Many workers couldn't see how to apply AI in their specific roles, or had tried AI once and given up after not seeing immediate benefits. Another critical barrier was the 'permission to prompt' issue: workers feared using AI might be seen as 'cheating' and needed explicit organizational permission to feel comfortable adopting the technology.
The training proved particularly effective for groups typically underrepresented in technology adoption. Women over 55, who were initially four times less likely to use AI than men under 35, saw dramatic improvements: their daily AI usage nearly tripled from 9% to 29%, and weekly usage more than tripled from 17% to 56%. The training's success stemmed from showing relevant, practical applications rather than assuming technical barriers; demonstrating that AI tools are surprisingly accessible and don't require coding knowledge; providing hands-on practice with immediate feedback; and creating safe learning environments where participants could experiment without judgment.
Workers across all sectors expanded their AI use significantly. The most common applications included: communications and writing (69-77% of users), summarizing and simplifying longer documents (54-67%), brainstorming new ideas and creative thinking (48-59%), learning about new topics (41-50%), problem-solving (28-47%), and analyzing complex information (29-31%). Education workers specifically used AI for lesson planning, adapting content for special educational needs, and reducing administrative burden. Union members used it for creating training materials, report writing, and organizing complex information. SMBs used AI for marketing campaigns, website development, operational streamlining, and as a virtual brainstorming partner.
The report recommends: 1) Industrial Strategy should outline how AI adoption can be supported in key industries, with businesses developing practical AI policies that give workers explicit permission to use tools; 2) Skills England should create an accreditation system for modular training with micro-credentials, making short effective training modules eligible for funding through the new Growth and Skills Levy; 3) Government should guarantee AI training for all public sector workers (NHS, local government, civil service) with role-specific content; 4) Launch larger-scale public sector AI adoption trials focusing on frontline service delivery teams; 5) Appoint AI leaders in every government department Executive Committee with mandated regular training; 6) Integrate AI training across all Civil Service Fast Stream schemes; 7) Track progress with an annual AI Skills and Adoption Survey coordinated by Skills England.
The research uncovered a critical 'permission to prompt' barrier. Workers frequently expressed concern that using AI constituted 'cheating' or might be inappropriate, even after training showed them effective applications. Only 46% of union members felt confident they understood their employer's AI policy. This uncertainty stems from lack of clear organizational guidance and negative media narratives about AI. The training showed that workers need explicit institutional endorsement - not just permission to use AI, but active encouragement that it's a legitimate, fair tool comparable to using search engines. Organizations should develop positively framed policies outlining available AI tools and appropriate use cases, similar to how educational institutions addressed calculator use in mathematics.

Create Your Own Slides
Turn your ideas into professional presentations in seconds with 2slides AI.
Reference professional designs, choose your style, and generate slides with perfect text rendering. Powered by Nano Banana—start creating your presentation now.
Your AI Agent for slides. Save time, shine faster with intelligent presentation creation.




© 2026 2slides. All rights reserved.