
Part of Investor presentation examples
Gold Circuit Electronics Investor Presentation November 2026 — Gold Circuit Electronics (GCE, TWSE: 2368) 2026 Investor Conference deck dated Nov. 12, 2026, covering company background, global footprint, revenue history from 2016 to October 2026, product application mix, Q1–Q3 2026 consolidated results and PCB technology capability. Amounts are in NT$ (New Taiwan dollars), shown in hundred millions.
Uses this deck’s cover as a style reference for slides made from your own content. Or pick any page below to use its layout as the reference.
Quick Navigation
Tags
Share the slides
Gold Circuit Electronics Investor Presentation November 2026 — Gold Circuit Electronics (GCE, TWSE: 2368) 2026 Investor Conference deck dated Nov. 12, 2026, covering company background, global footprint, revenue history from 2016 to October 2026, product application mix, Q1–Q3 2026 consolidated results and PCB technology capability. Amounts are in NT$ (New Taiwan dollars), shown in hundred millions.
Detailed view of each slide page, including layout, key content and visual elements.
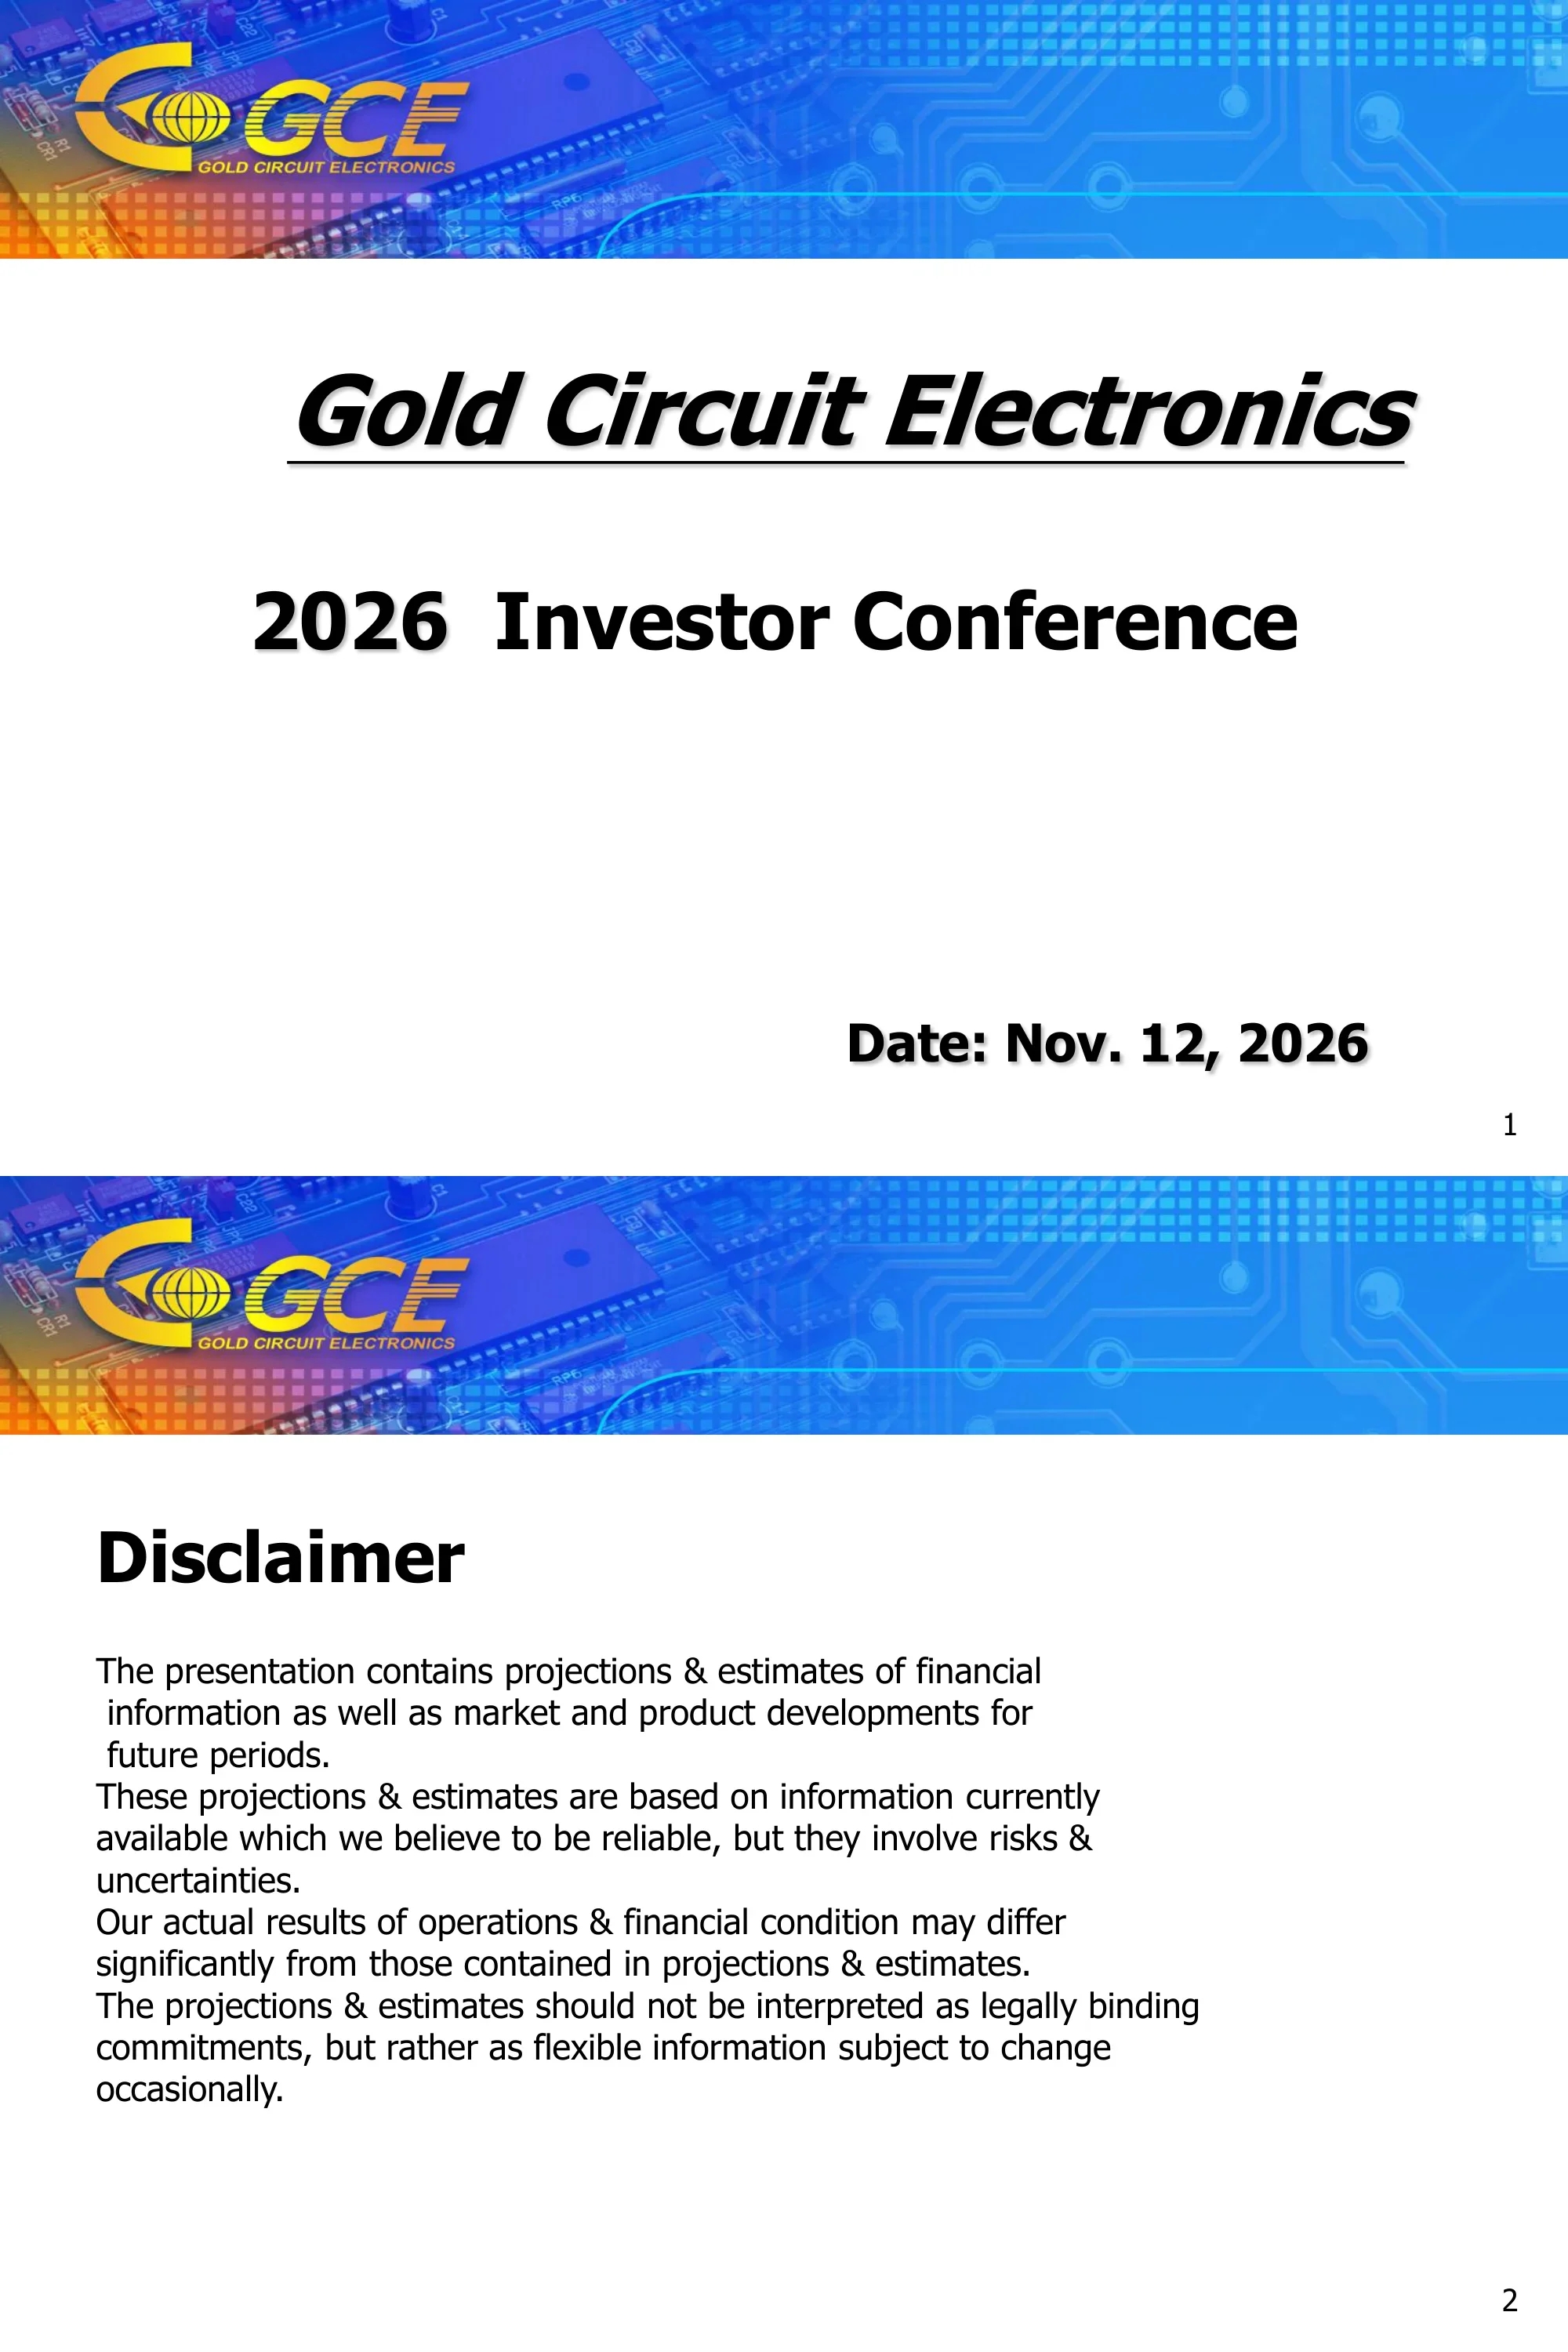
Cover slide for Gold Circuit Electronics reading '2026 Investor Conference' with the date Nov. 12, 2026. The GCE logo with the 'Gold Circuit Electronics' wordmark sits in the header.
Full-width circuit-board photo banner across the top with the logo at left, then the company name underlined in large bold italics, the event title below it, and the date at bottom right.
Forward-looking statement notice: the presentation contains projections and estimates of financial information and of market and product developments for future periods. They are based on information believed reliable but involve risks and uncertainties, actual results may differ significantly, and they should not be read as legally binding commitments.
Same banner header, a bold left-aligned 'Disclaimer' heading and a short block of four statements in plain text on a white background.
Company fact sheet: Gold Circuit Electronics, founded in 1981, stock listed Mar. 9th, 1998, capital NTD 5,325 Million. Product technology is High Layer Count, HDI, Heavy Cu and Backplane. Manufacturing sites are Taiwan, Suzhou, Chang Shu and Thailand.
Banner with the slide title, a two-column list of labels (black) and values (blue) with arrow bullets, and a strip of five facility photographs along the bottom.
World map marking Service Office locations (red dots) and Plants (blue triangles). Labels read West USA, East USA, South USA, Europe, Korea, Japan, ShenZhen, Malaysia, ChangShu I, ChangShu II, Suzhou, Taiwan and Thailand. Plant markers appear in the Asian cluster (ChangShu I and II, Suzhou, Taiwan, Thailand and near ShenZhen).
Full-slide color-coded continent map (America, Europe, Africa, Asia, Oceania) with a legend at bottom left; location labels are placed next to markers, and dense Asian labels overlap slightly.
Bar chart of annual revenue in NT$ hundred million: 192 (2016), 192 (2017), 206 (2018), 190 (2019), 234 (2020), 266 (2021), 328 (2022), 301 (2023), 389 (2024), 600 (2025) and 831 for 2026 through October.
Single framed column chart titled 'REVENUE TREND' with a 0-900 y-axis, gridlines, value labels above each bar and year labels beneath; the last bar is labeled '2026 OCT'.
Stacked 100% columns for Y2020 to Y2026 Q3 showing the application mix. Server share: 51%, 50%, 60%, 64%, 68%, 74%, 77%. Networking: 21%, 19%, 20%, 17%, 15%, 15%, 17%. NB: 20%, 22%, 13%, 14%, 10%, 8%, 3%. Others: 8%, 9%, 7%, 5%, 7%, 3%, 3%.
Seven stacked columns with a data table beneath listing the percentage for each category and period; legend colors are embedded in the table row labels (red Others, mint NB, amber Networking, blue Server).
In NT$ hundred million, 2026 Q1~Q3 vs 2025 Q1~Q3: operating revenue 731.59 vs 435.96 (+68%), gross profit 265.78 vs 141.59 (+88%), gross profit margin 36.33% vs 32.5%, operating income 203.55 vs 100.57 (+102%), pre-tax income 199.02 vs 98.91 (+101%), net income 146.53 vs 66.76, EPS 28.41 vs 13.61. Operating costs 465.81 vs 294.37; operating expenses 65.95 vs 40.82.
Full-width income-statement table with three columns (2026 Q1~Q3, 2025 Q1~Q3, comparison with the same period last year); key rows are highlighted in yellow.
Quarterly view in NT$ hundred millions. Y2025 operating revenue: 120.6, 138.5, 176.8, 164.1 for Q1-Q4; gross margin 31.3%, 29.6%, 35.60%, 33.66%; income before tax 26.5, 25.1, 47.3, 42.8. Y2026 Q1-Q3 revenue: 193.1, 242.8, 295.7; gross margin 34.81%, 34.7%, 38.70%; income before tax 50.9, 63, 85.2; revenue growth rate 60%, 75%, 67%.
Two stacked tables (Y2025 and Y2026) sharing a yellow Q1-Q4 header row, with red year labels and orange gross-margin rows; the Q4 column for 2026 is blank.
Matrix of technology (MLB, HDI, Heavy Cu) against layer count (10L, 30L, 56L marks). MLB covers IC Testing, Advanced Server and Networking, plus Telecom, Server, NB, LEO and Automotive. HDI covers Server, Telecom, Smart Home, Tablet/NB, Smart Phone and Automotive. Heavy Cu covers Power, Telecom and Automotive.
Three blue columns on an axis diagram (layer count vertical, technology horizontal) with white ovals placed at the relevant layer height listing end applications.
Divider slide inviting questions from the audience; it carries no figures.
Circuit-board banner on top with a large, bold, centered 'Q & A' on a white field.
Closing slide reading 'Thank you for your attention !'. No contact details or additional figures are shown.
Same banner header with a single bold centered closing message below on a white background.
Common questions about this slide and the underlying presentation content.
It is the company's 2026 Investor Conference deck dated Nov. 12, 2026. The financial slides cover Q1 to Q3 of 2026 against the same period of 2025, quarterly figures for 2025 and 2026, annual revenue from 2016 through October 2026, and the product application mix from Y2020 to Y2026 Q3.
For Q1~Q3 2026, in NT$ (New Taiwan dollars) hundred million: operating revenue 731.59 (up 68% from 435.96), gross profit margin 36.33% (vs 32.5%), operating income 203.55, pre-tax income 199.02, net income 146.53 and EPS 28.41 (vs 13.61 in the prior-year period). Revenue for 2026 through October is shown as 831.
The English version was filed on Taiwan's Market Observation Post System (MOPS) for the company's investor conference (法說會). The deck was presented by Gold Circuit Electronics (GCE, TWSE: 2368) at an investor conference hosted by Yuanta Securities.
There are 11 slides: title, disclaimer, general information, global support and service map, sales revenue history, product application mix, Q1~Q3 2026 consolidated financial statement, quarterly 2025/2026 financial statement, technology capability map, Q&A and a closing thank-you slide.
GCE is a printed circuit board maker. Slide 3 lists its product technology as High Layer Count, HDI, Heavy Cu and Backplane, with manufacturing sites in Taiwan, Suzhou, Chang Shu and Thailand. Slide 6 shows the server share of the application mix reaching 77% in Y2026 Q3, with networking at 17%, NB at 3% and others at 3%.
Server applications grew from 51% in Y2020 to 60% in Y2022, 68% in Y2024, 74% in Y2025 and 77% in Y2026 Q3. Over the same period NB fell from 20% to 3%, while networking moved between 15% and 21% and stood at 17% in Y2026 Q3.
Yes. This gallery page lets you view all 11 pages and download the deck as a PDF or PPTX file. It is a public investor presentation intended for reference, so you can study its structure and reuse it as an example when building your own investor conference deck.

Create Your Own Slides
Turn your ideas into professional presentations in seconds with 2slides AI.
Reference professional designs, choose your style, and generate slides with perfect text rendering. Powered by Nano Banana—start creating your presentation now.
Your AI Agent for slides. Save time, shine faster with intelligent presentation creation.


© 2026 2slides. All rights reserved.