
Part of Investor presentation examples
Fortis Q3 2026 Earnings Presentation: the 40-slide deck from Fortis Inc.'s (NYSE/TSX: FTS) Q3 2026 earnings conference call on November 3, 2026, filed with the SEC as an exhibit to Form 6-K. Fortis is a Canadian regulated electric and gas utility holding company. Unless stated otherwise, amounts are in Canadian dollars (C$); U.S.-dollar figures are marked US$. The deck reports Q3 2026 actual and adjusted EPS of C$0.92 (vs. adjusted C$0.87 in Q3 2025), year-to-date adjusted EPS of C$2.69, C$4.2B of capital expenditures through September and an annual capital forecast raised to C$6.0B. It also unveils a new C$32.2B 2027-2031 capital plan, the largest in Fortis history, which drives 7.5% five-year rate base growth to C$63.9B, and extends 4-6% annual dividend growth guidance to 2031 after a 4% Q4 dividend increase that marks 53 consecutive years of dividend increases.
Uses this deck’s cover as a style reference for slides made from your own content. Or pick any page below to use its layout as the reference.
Quick Navigation
Tags
Share the slides
Fortis Q3 2026 Earnings Presentation: the 40-slide deck from Fortis Inc.'s (NYSE/TSX: FTS) Q3 2026 earnings conference call on November 3, 2026, filed with the SEC as an exhibit to Form 6-K. Fortis is a Canadian regulated electric and gas utility holding company. Unless stated otherwise, amounts are in Canadian dollars (C$); U.S.-dollar figures are marked US$. The deck reports Q3 2026 actual and adjusted EPS of C$0.92 (vs. adjusted C$0.87 in Q3 2025), year-to-date adjusted EPS of C$2.69, C$4.2B of capital expenditures through September and an annual capital forecast raised to C$6.0B. It also unveils a new C$32.2B 2027-2031 capital plan, the largest in Fortis history, which drives 7.5% five-year rate base growth to C$63.9B, and extends 4-6% annual dividend growth guidance to 2031 after a 4% Q4 dividend increase that marks 53 consecutive years of dividend increases.
Detailed view of each slide page, including layout, key content and visual elements.
Cover slide reading 'Fortis Inc. Q3 2026 Earnings Conference Call', dated November 3, 2026.
Full-width photo banner on the top two-thirds with a curved white band below holding the Fortis logo, the title and the date.
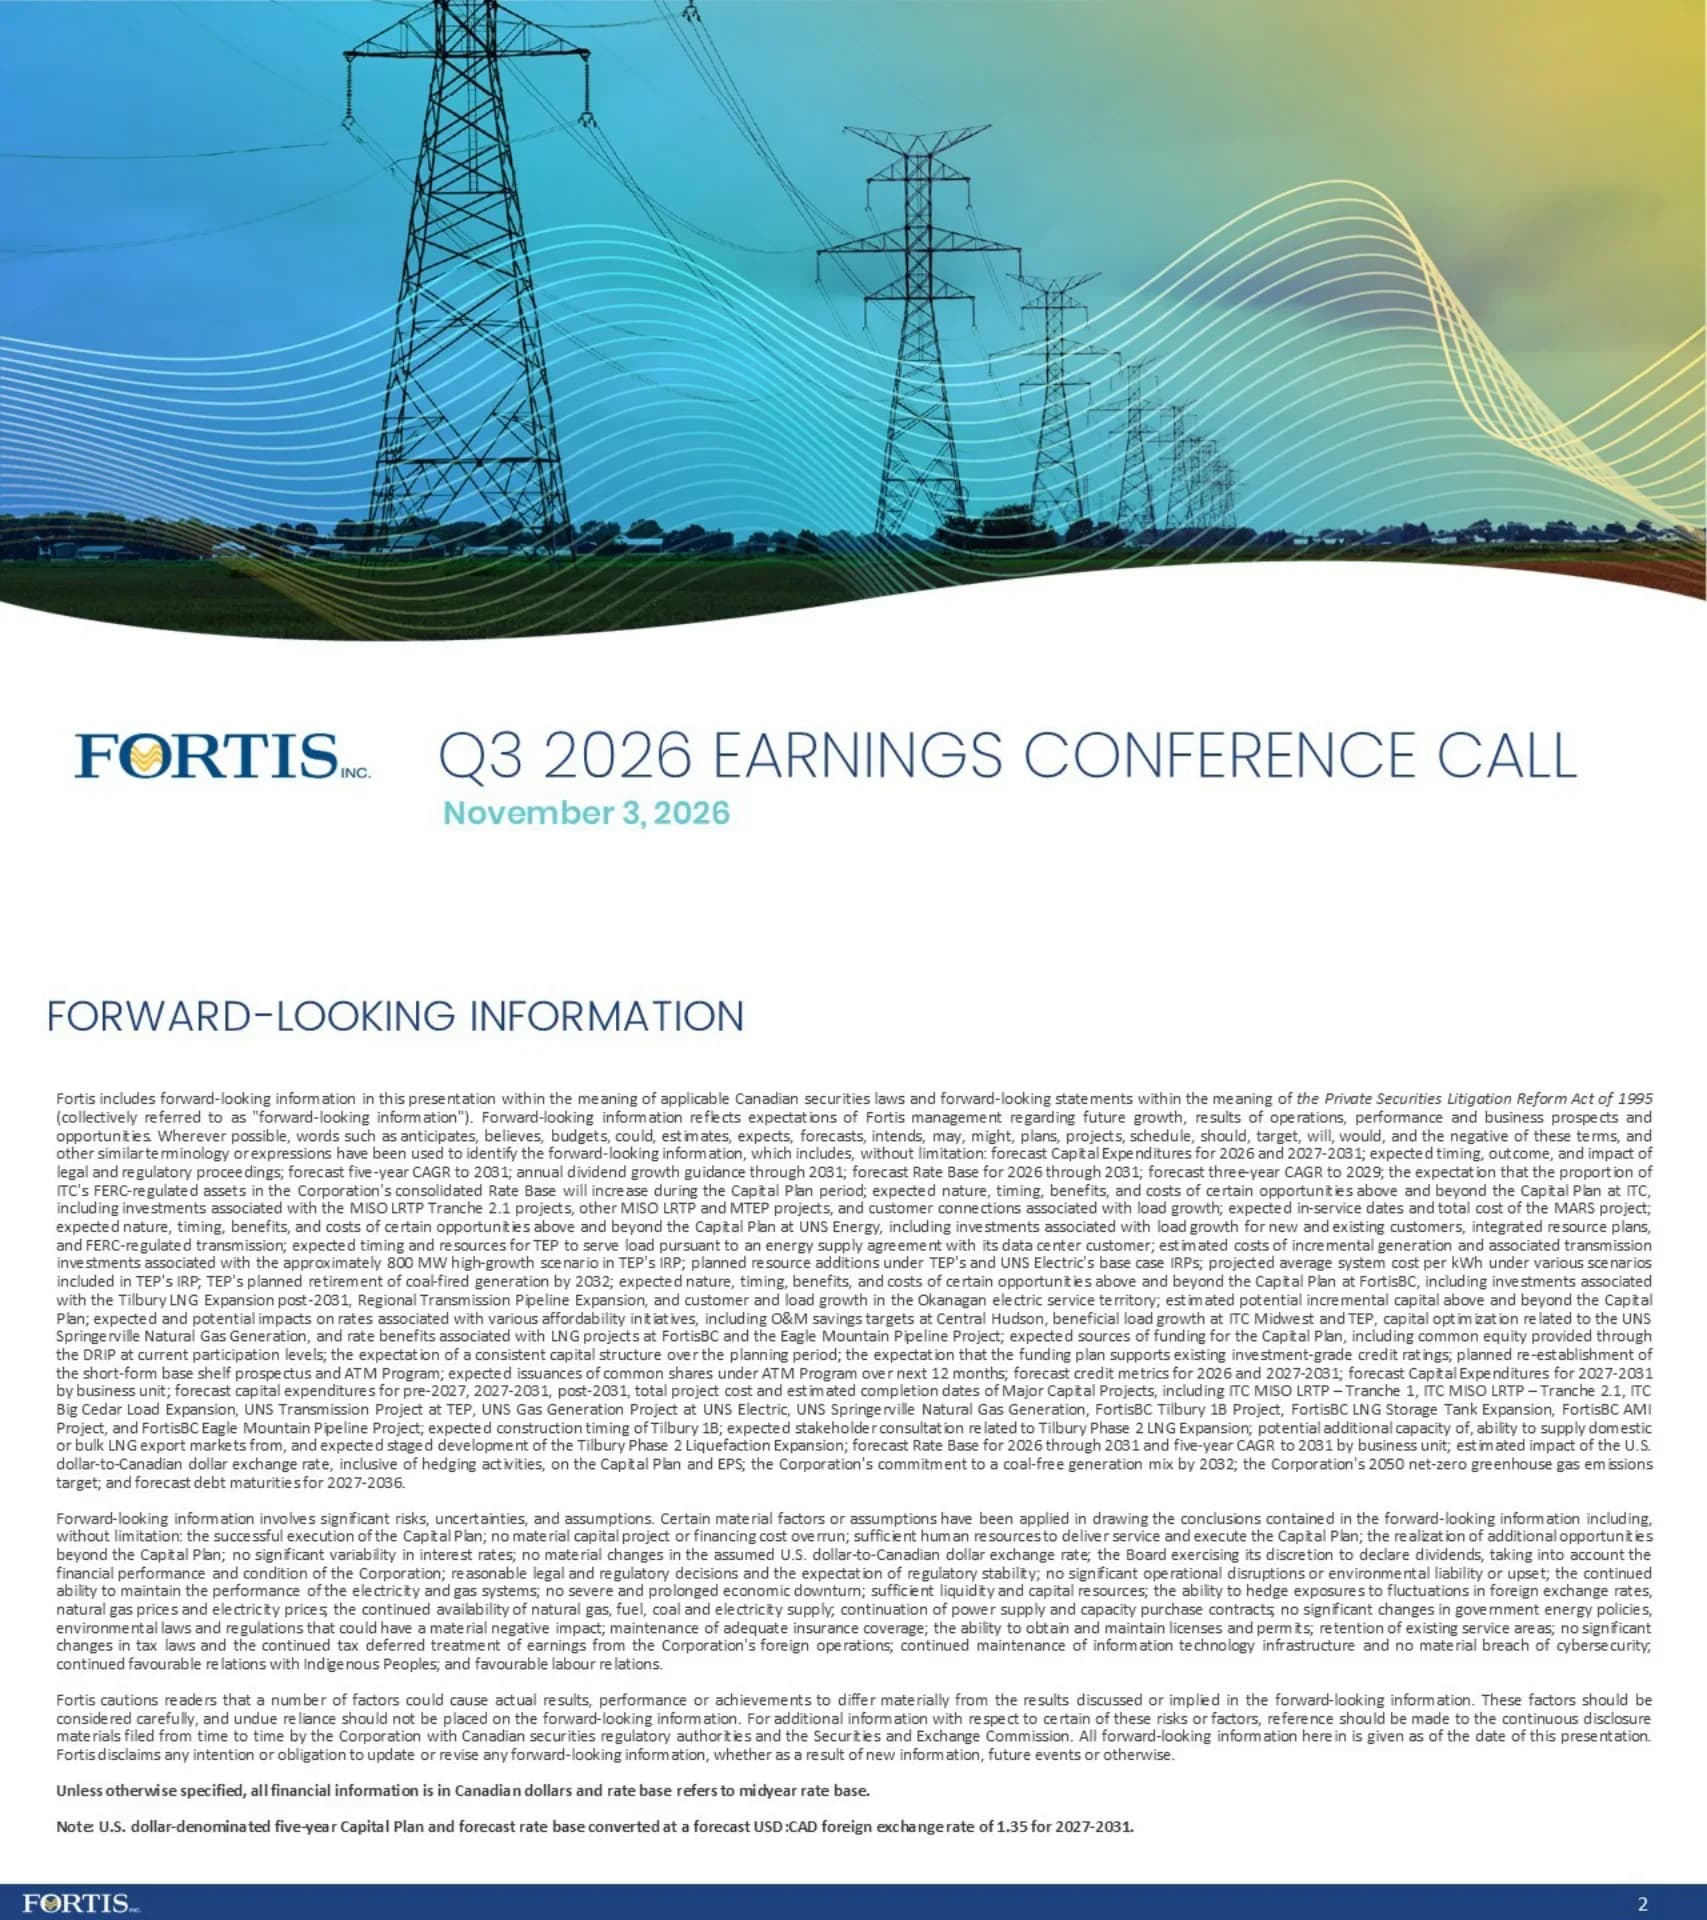
Legal disclaimer covering forward-looking statements under Canadian securities law and the U.S. Private Securities Litigation Reform Act of 1995. It lists the topics covered (2026 and 2027-2031 capital expenditures, rate base forecasts, dividend guidance through 2031, MISO LRTP projects, Tilbury LNG, TEP's IRP, coal exit by 2032, the ATM program and debt maturities) along with the key assumptions and risks. It states that all financial information is in Canadian dollars unless otherwise specified, and that U.S.-dollar capital plan and rate base figures are converted at a forecast USD:CAD rate of 1.35 for 2027-2031.
Single dense text block under the title, with two bolded notes at the bottom about currency and the FX assumption.
Introduces the call speakers: David Hutchens, President and Chief Executive Officer, and Jocelyn Perry, EVP and Chief Financial Officer, Fortis Inc.
The cover-style photo banner, with two circular headshots overlapping the curve and names and titles below.
Seven highlights: top-quartile safety and reliability relative to industry peers; capital expenditures of C$4.2B through YTD September, with the annual forecast raised from C$5.6B to C$6.0B; Q3 2026 actual and adjusted EPS of C$0.92 vs. adjusted EPS of C$0.87 in Q3 2025; a new C$32.2B 2027-2031 capital plan, the largest in Fortis history; environmental approval received for the Tilbury LNG Storage Tank and Phase 2 Expansion in British Columbia; a competitive project in Iowa awarded to ITC; and a 4% Q4 dividend increase, marking 53 consecutive years of increases in dividends paid.
Vertical timeline bracket on the left with seven teal headline and grey subline pairs; decorative pipeline photo on the right edge.
Two EPS bridges. Third quarter: Q3 2025 actual EPS of C$0.81, plus C$0.06 for the disposition of FortisTCI, gives Q3 2025 adjusted EPS of C$0.87, against C$0.92 Q3 2026 actual and adjusted EPS (up C$0.05). Year-to-date: YTD 2025 actual EPS of C$2.57, plus C$0.06 for FortisTCI, gives C$2.63 adjusted, against C$2.69 YTD 2026 actual and adjusted (up C$0.06). Note: adjusted EPS is a Non-U.S. GAAP measure reconciled on slide 26.
Two side-by-side bar bridges separated by a vertical divider, each with a callout above the final bar.
Waterfall from Q3 2025 adjusted basic EPS of C$0.87 to Q3 2026 of C$0.92: U.S. Transmission (ITC) +C$0.03, U.S. Electric & Gas (UNS Energy and Central Hudson) +C$0.02, Western Canadian Electric & Gas +C$0.02, Other Electric -C$0.01, Corporate & Other -C$0.01, Foreign Exchange +C$0.01 (average rate of 1.40 vs. 1.38) and Weighted Average Shares -C$0.01. A callout notes that Q3 2026 EPS reflects C$0.02 of dilution from the 2025 dispositions (Turks and Caicos utility sold in September 2025; Belize investments sold in October 2025).
Full-width waterfall chart with a speech-bubble callout at top right, a central arrow banner summarizing the increase, and footnotes.
YTD waterfall from C$2.63 to C$2.69: U.S. Transmission (ITC) +C$0.07, Western Canadian Electric & Gas +C$0.07, U.S. Electric & Gas +C$0.03, Other Electric -C$0.01, Corporate & Other -C$0.03, Foreign Exchange -C$0.03 (average rate of 1.38 vs. 1.40, plus 2025 FX gains on U.S.-dollar short-term liabilities) and Weighted Average Shares -C$0.04. The YTD figure reflects C$0.05 of dilution from the 2025 dispositions.
Same waterfall template as the prior slide, with a callout bubble and footnotes.
Four regulatory items. ITC transmission incentives: FERC's 2021 supplemental NOPR proposing to eliminate the 50 bps RTO ROE adder remains open, with timing and outcome unknown. TEP general rate application: in October 2026 the ACC ALJ issued a recommended opinion and order with a 9.65% allowed ROE, a 55.5% equity ratio, a formulaic rate adjustment mechanism with a +/-50 bps band, post-test-year adjustments and deferral of Roadrunner Reserve II costs; new rates are proposed by December 1, 2026, with an ACC decision expected in November 2026. FortisAlberta third PBR term: the Court of Appeal of Alberta dismissed the appeal in Q3 2026. FortisAlberta depreciation study: the AUC approved a settlement resulting in a C$130M true-up, proposed to be returned to customers over multiple years, with no earnings impact anticipated.
Four equal light-blue cards, each topped by a subsidiary logo (ITC, UNS Energy, FortisAlberta x2), a teal heading and bullets.
Three headline metrics: capital expenditures of C$32.2B for 2027-2031, up C$3.4B over the prior plan; rate base 5-year CAGR of 7.5%, up 50 bps over the prior plan; and annual dividend growth guidance of 4-6% extended to 2031, with a 4% increase in the Q4 2026 dividend.
Wide photo band of field workers, with three circular icons overlapping three white KPI cards below.
The five-year capital plan rises 12%, from C$28.8B (2026-2030 plan) to C$32.2B (2027-2031 plan), a C$3.4B increase. Incremental drivers: ITC +C$1.7B (MISO LRTP Tranche 2.1 projects, baseline reliability and interconnections), FortisBC +C$1.0B (Tilbury Phase 1B, Tilbury LNG Storage Tank Expansion and reliability projects) and other regulated utilities +C$0.7B (FortisAlberta, Central Hudson and Newfoundland Power). U.S.-dollar capex is converted at 1.35.
Two-bar comparison chart on the left; three rows of photo thumbnails with driver descriptions on the right.
The C$32.2B 2027-2031 plan splits into Transmission 47%, Distribution 29%, LNG & Renewable Gases 7%, Generation 6%, IT 6% and Other 5%. Consolidated rate base grows from C$45.3B (2026F) to C$48.2B, C$52.4B, C$55.8B, C$58.9B and C$63.9B (2031F), a 7.5% five-year CAGR and a 7.7% three-year CAGR. The capital is 100% regulated, with geographic split of 62% U.S., 36% Canada and 2% Cayman Islands.
Donut chart at left, rate base bar chart in the center, and a sidebar with regulated and geographic stats above a photo of grid equipment.
The Marshalltown-Lehigh-Sub T-Montezuma-East Adair (MARS) project (MISO Tranche 2.1, Nos. 38 and 39) was awarded to ITC. It lies mainly in ITC Midwest's current footprint, comprises two new 345 kV lines and two new 765 kV lines (about 300 miles in total), has expected in-service dates of 2029-2034 and an expected total cost of about US$1B, of which about US$0.5B is included in the 2027-2031 capital plan.
Map of the Iowa service territory with route lines on the left; teal-headed project fact box on the right.
ITC's 2027-2031 capital plan is C$11.6B: Infrastructure Investments 45%, MISO Long Range Transmission Plan 28%, Interconnections 22% and IT, General & Other 5%. Rate base grows from C$14.8B (2026F) to C$21.9B (2031F), an 8.6% CAGR. Opportunities beyond the plan: MISO LRTP Tranche 2.1 ROFR projects in Michigan/Minnesota and Iowa system upgrades (US$2.9-3.4B), the MARS project (US$0.5B), customer connections representing 10,000+ MW of potential load growth (mainly data centers), and about 32 GW of large-load requests being studied through MTEP26.
Business-unit template: capital donut, two-bar rate base chart and an 'Opportunities Above and Beyond the Plan' sidebar above a transmission tower photo.
UNS Energy's 2027-2031 capital plan is C$5.6B: Transmission Infrastructure 38%, Distribution Infrastructure 30%, Energy Resources 21% and IT, General & Other 11%. Rate base grows from C$9.1B (2026F) to C$12.7B (2031F), a 7.4% CAGR. Opportunities beyond the plan: load growth from data centers, manufacturing and mining, where 800 MW of new generation could require up to US$1.5B; base-case IRP opportunities at TEP and UNSE of up to US$1.6B, subject to RFP; and FERC-regulated transmission.
Same business-unit template with a solar-panel photo in the sidebar.
TEP base-case IRP timeline: 160 MW in 2027 (80 MW solar + 80 MW storage), 400 MW in 2029 (200 MW solar + 200 MW storage), 730 MW in 2030 (Springerville gas conversion), 300 MW in 2031 (new combined cycle) and 800 MW in 2034-2041 (400 MW solar + 400 MW storage). The coal exit converts Springerville Units 1 and 2 (793 MW) to natural gas and exits Four Corners (110 MW). UNS Electric base-case IRP: 280 MW in 2028 (140 MW solar + 140 MW storage), 196 MW of gas generation in 2030, 125 MW of gas generation in 2031 and 100 MW in 2034-2041 (50 MW solar + 50 MW storage). TEP's IRP average system cost per kWh is 15.52 US cents (base scenario), 15.76 (clean energy), 14.31 (high-growth) and 15.19 (high-growth, clean). Fortis is on track for a coal-free generation mix by 2032. The TEP base case assumes 5.7% average annual retail sales growth, with RFP opportunities of up to about US$1.3B (TEP) and about US$0.3B (UNSE).
Two horizontal arrow timelines with circular plant icons (TEP above, UNS Electric below), a legend, and a sidebar bar chart of system cost scenarios with checkmark bullets.
FortisBC's 2027-2031 capital plan is C$6.0B: Reliability & Integrity 40%, LNG Projects & Renewable Gases 40%, IT, General & Other 13% and the AMI Project 7%. Rate base grows from C$8.7B (2026F) to C$12.8B (2031F), a 7.9% CAGR. Opportunities beyond the plan: the Tilbury LNG expansion (Tilbury 1B, the LNG Storage Tank, and Tilbury Phase 2 LNG Expansion at C$2-4B), Regional Transmission Pipeline Expansion, and customer and load growth in the Okanagan electric territory.
Business-unit template with an aerial photo of the Tilbury LNG site in the sidebar.
Table in C$ billions. Tilbury Phase 1A: total cost 0.5, in service 2018. Phase 1B / Marine Jetty: 0.2 pre-2027, 1.1 in 2027-2031, 0.4 beyond 2031, total 1.7, in service 2031 (estimated life-of-project spend C$1.8B including AFUDC). LNG Storage Tank Expansion: 0.1 / 0.8 / 0.2, total 1.1, in service 2031. Phase 2 LNG Expansion: TBD, total 2.0-4.0, post-2031. Total Tilbury LNG opportunity: 0.3 / 1.9 / 0.6, total C$5.3-7.3B. An annotated aerial photo shows each component's status: Phase 1A complete; Phase 1B OIC approved (subject to permitting); storage tank approved; marine jetty approved; Phase 2 environmental approval received (subject to FID and permitting).
Color-bordered data table on the left, matched to colored zones on an annotated aerial site photo on the right.
Lists growth opportunities outside the base plan. ITC: LRTP Tranche 2.1, the MARS project, customer connections, and future MISO LRTP/MTEP and SPP ITP projects. UNS Energy: TEP load growth (data centers and other large loads), IRP investments and transmission. FortisBC: Tilbury Phase 1B, Tilbury Phase 2 LNG Expansion, regional transmission, and customer and load growth. Other: Canadian nation-building projects, electrification and customer connections, and regional transmission. A map shows Fortis operations across British Columbia, Alberta, Ontario, PEI, Newfoundland & Labrador, New York, Michigan, Minnesota, Wisconsin, Iowa, Illinois, Missouri, Kansas, Oklahoma, Arizona and the Cayman Islands.
Stacked text panels on the left; a North America map with location dots on the right.
Four affordability initiatives. Central Hudson targets zero O&M growth from its 2025 rate order. At ITC Midwest, network transmission rates are expected to fall about 20% by the end of the decade from the 2026 level due to data-center load growth, with a 13% reduction already reflected in the 2027 projected rate; at TEP, a new data center requiring about 300 MW has an approved ESA expected to save a typical residential customer about US$13 per month. TEP's conversion of two Springerville coal units to natural gas costs about 10% of building new gas generation. At FortisBC, Tilbury LNG marine fuel sales have provided a rate benefit of about 1.5% since 2024, and the Eagle Mountain Pipeline is expected to provide a further rate benefit of about 1.5%.
Four white cards inside a light frame, each with a circular photo, a teal heading, an italic tagline and body text.
Funding for the C$32.2B five-year plan: cash from operations 57%, net debt 32% and equity 11%. The capital structure is expected to remain consistent. Equity funding comes mainly from the DRIP (assumed participation of about 37%), plus stock option and employee plans (about C$250M) and the ATM program (about C$250M). In Q3 2026 Fortis issued US$1B of hybrid debt to repay maturing corporate debt and C$260M of ATM equity. About C$240M remains under the current ATM program; Fortis plans to file a new base shelf prospectus after the current one expires in January 2027 and re-establish a C$500M ATM program. The funding plan supports existing investment-grade credit ratings.
Donut chart of funding sources on the left and an 'Equity Funding Plan' bullet panel on the right, with footnotes.
The 2027-2031F average S&P FFO/Debt is 12.3% against a >12.0% threshold, and Fitch FFO leverage is 5.9x against a <6.2x threshold. Credit ratings: S&P A- (issuer rating; unsecured debt rated BBB+), Fitch BBB+ and Morningstar DBRS A (low), all with stable outlooks, confirmed in Q2 2026. Key credit strengths: a strong business risk profile, 100% regulated with stable and predictable cash flows, geographic and regulatory diversity, and constructive regulatory frameworks.
Two single-bar metric charts with dashed threshold lines on the left; rating boxes and a four-cell credit strengths grid on the right.
Shows a 4% dividend increase in Q4 2026, 53 years of consecutive increases in dividends paid, and 4-6% annual dividend growth guidance through 2031. A bar chart tracks annual dividends paid from 1973 to 2026F; individual bar values are not labelled.
Photo strip on the left; three icon-and-stat rows over a long rising bar chart on the right.
Investment thesis in two halves. Sustainable growth (focused on executing): strong rate base growth, a robust transmission pipeline, a transparent funding plan, investments to strengthen resiliency, 4-6% annual dividend growth and investment-grade credit ratings. Low risk (safe, well-run utilities): strong governance, regulatory and geographic diversity, constructive regulatory relationships, a local business model, 100% regulated, and primarily transmission and distribution assets.
Two photo headers ('Sustainable Growth', 'Low-Risk') above teal banners, each with a 3x2 grid of icon tiles.
Closing slide: Q4 2026 results are expected on February 11, 2027.
Full-bleed aerial photo with a translucent central box and the Fortis logo below.
Section divider for the appendix.
Repeats the cover layout with 'Appendix' in place of the title.
In C$ millions. Q3 2026 net earnings were 474 vs. 409 in Q3 2025; adding back 32 for the FortisTCI disposition (income taxes and closing costs) gives adjusted net earnings of 474 vs. 441, adjusted EPS of C$0.92 vs. C$0.87. YTD: 1,371 vs. 1,292 net earnings, 1,371 vs. 1,324 adjusted, EPS of C$2.69 vs. C$2.63. Capital expenditures: Q3 2026 additions to PP&E of 1,758 and intangibles of 35, less 301 of Eagle Mountain Pipeline CIACs, give 1,492 (vs. 1,316); YTD, 4,862 + 143 - 787 = 4,218 (vs. 4,171).
Single financial table with Q3 and YTD columns plus variances, with footnotes.
Q3 earnings by business unit in C$ millions (Q3 2026 vs. adjusted Q3 2025): ITC 167 vs. 149 (+18); UNS Energy 225 vs. 209 (+16); Central Hudson 33 vs. 31 (+2); FortisBC Energy 6 vs. nil (+6); FortisAlberta 58 vs. 54 (+4); FortisBC Electric 15 vs. 15; Other Electric 36 vs. 41 (-5); Corporate and Other (66) vs. (58) (-8). Common equity earnings were 474 vs. 441 (+33), weighted average shares 513.1M vs. 504.5M, and EPS C$0.92 vs. C$0.87.
Wide variance table with actual, adjustment and adjusted columns for each period plus a variance column.
YTD September earnings by business unit in C$ millions (2026 vs. adjusted 2025): ITC 472 vs. 442 (+30); UNS Energy 390 vs. 394 (-4); Central Hudson 137 vs. 121 (+16); FortisBC Energy 226 vs. 202 (+24); FortisAlberta 142 vs. 132 (+10); FortisBC Electric 61 vs. 57 (+4); Other Electric 122 vs. 129 (-7); Corporate and Other (179) vs. (153) (-26). Common equity earnings were 1,371 vs. 1,324 (+47), weighted average shares 510.4M vs. 502.5M, and EPS C$2.69 vs. C$2.63.
Same variance table template as the Q3 segment slide.
Capital plan in C$ millions for 2027F-2031F. ITC: 2,317 / 2,387 / 2,251 / 2,274 / 2,356, total 11,585. UNS Energy: total 5,619. Central Hudson: total 2,749. U.S. Electric & Gas total: 8,368. FortisBC Energy: 4,564. FortisAlberta: 3,671. FortisBC Electric: 1,418. Other Electric: 2,580. Canadian & Caribbean total: 12,233. Total capital plan: 6,333 / 6,412 / 6,817 / 6,366 / 6,258 by year, 32,186 overall. U.S. capex is converted at 1.35.
Annual forecast table with a five-year total column and grouped subtotals.
Eleven major projects in C$ billions (pre-2027 / 2027-2031 / beyond 2031 / total / completion): ITC MISO LRTP Tranche 1 (0.7 / 1.5 / - / 2.2 / 2030); ITC Tranche 2.1 ROFR awarded (0.1 / 1.1 / 3.9-4.6 / 5.1-5.8 / post-2031); ITC Tranche 2.1 MARS (- / 0.6 / 0.8 / 1.4 / various); ITC Big Cedar Load Expansion (0.3 / 0.5 / - / 0.8 / 2029); UNS Transmission Project at TEP (0.6 total, 2030); UNS Gas Generation at UNS Electric (0.5 total, 2030); UNS Springerville Natural Gas Generation (0.2 total, 2030); FortisBC Tilbury 1B (1.7 total, 2031); FortisBC LNG Storage Tank Expansion (1.1 total, 2031); FortisBC AMI (0.8 total, 2029); FortisBC Eagle Mountain Pipeline (0.8 total net of customer contributions, 2027). Major projects are those costing C$200M or more.
Project table on the left; sidebar callout 'Plan includes 11 major capital projects' above an equipment photo.
Tilbury Phase 1B: in July 2026 the Province of B.C. issued an OIC approving the expansion for LNG marine fueling, including a minority equity partnership with the Musqueam Indian Band (below the BCUC's 20% review threshold) and a marine jetty for bunkering in the Port of Vancouver. C$1.1B is in the 2027-2031 plan; construction could start as early as mid-2027, with service as early as 2031. Tilbury Phase 2 received federal and provincial environmental approvals in September 2026, with remaining permits still required. The LNG Storage Tank Expansion is a new 142,400 m3 (about 3 Bcf) tank, CPCN approved by the BCUC in October 2025, with C$0.8B in the plan and substantial completion in 2031. The Phase 2 Liquefaction Expansion adds up to 2.5 mtpa for domestic, marine or bulk export markets, a potential C$2-4B opportunity beyond the plan period, subject to demand, permitting and FID.
Left panel for Phase 1B; right panel for Phase 2 with two sub-cards (storage tank, liquefaction), each with line-art illustrations.
Rate base in C$ billions, 2026F to 2031F, with five-year CAGR: ITC 14.8 to 21.9 (8.6%); UNS Energy 9.1 to 12.7 (7.4%); Central Hudson 4.0 to 5.3 (6.0%); U.S. Electric & Gas total 13.1 to 18.0 (7.0%); FortisBC Energy 6.9 to 10.1 (8.2%); FortisAlberta 4.9 to 6.4 (5.5%); FortisBC Electric 1.9 to 2.7 (7.0%); Other Electric 3.7 to 4.8 (5.7%); Canadian & Caribbean total 17.4 to 24.0 (6.8%); total 45.3, 48.2, 52.4, 55.8, 58.9, 63.9 (7.5%). Fortis owns 80.1% of ITC; ITC rate base is shown at 100%.
Annual forecast table with a CAGR column and grouped subtotals.
FX: the plan assumes USD:CAD of 1.35. 65% of regulated earnings (2025) and 64% of the capital plan are in U.S. dollars. A +/-C$0.05 change in USD:CAD moves the five-year capital plan by C$800M and EPS by C$0.06, including hedging. Hedging: FX forwards and collars (US$518M notional), US$1.2B of U.S.-dollar debt at Fortis Inc. as a natural hedge, US$400M of cross-currency swaps, and ITC interest rate swaps (US$200M notional). EPS sensitivity to ROE +/-25 bps and equity +/-100 bps: ITC C$0.040 / C$0.035; UNS Energy C$0.030 / C$0.020; FortisBC C$0.020 / C$0.020; Central Hudson C$0.010 / C$0.010; FortisAlberta C$0.010 / C$0.010.
Two bullet sections on the left, a sensitivity table in the center, and a photo of two young workers on the right.
Three sustainability priorities. Climate risk: the 2026 Climate Resiliency Report adds location-specific climate risk assessments and hazard mapping by geography and asset category. Emissions: Scope 1 emissions fell 38% (2019-2025), the company is committed to coal-free generation by 2032 and net-zero by 2050, and the GHG intensity of delivered energy has fallen for five years. Governance and communities: a local leadership model, executive pay linked to climate goals, 50% women on the board (2 of 12 directors identify as a visible minority), a partnership connecting 17 remote First Nations communities in northern Ontario to the grid, C$14M of community investment in 2025 (C$60M over five years), and C$320M on energy efficiency programs in 2025, the highest level ever.
Landscape photo header with the title overlaid, a teal 'Sustainability Priorities' band, and three text columns.
Scope 1 GHG emissions in ktonnes CO2e: 12,308 (2019), 10,418 (2020), 9,742 (2021), 8,748 (2022), 8,155 (2023), 8,069 (2024) and 7,559 (2025), about a 38% reduction. GHG intensity reached a record low in 2025. Since 2019, coal generation has declined 58% while renewable generation has increased 24%. The 2026 Sustainability Report marks 10 years of Fortis sustainability reporting.
Emissions bar chart on the left, bullets and a report thumbnail callout in the center, and a photo of workers on the right.
Change in energy sales, Q3 2026 vs. Q3 2025. ITC: N/A, with peak load up 7% on warmer weather. UNS Energy: +1% (excluding wholesale), on higher industrial and residential consumption and customer growth; weather-normalized retail sales were up 2%. Central Hudson: -1% on milder weather. FortisBC gas: +7% on higher consumption and cooler weather. FortisBC electricity: -3% on lower air-conditioning load. FortisAlberta: +4%, with residential up 5% and C&I up 4%. Other Electric: -1%, with Eastern Canada residential up 3% and C&I up 2%, and Caribbean sales down after the FortisTCI disposition.
Table with subsidiary logos in the left margin, a change column and a commentary column.
Stacked bar chart of 10-year debt maturities from 2027F to 2036F in C$ billions, split into regulated utilities, ITC Holdings and Fortis Inc. 2027F is the largest year at roughly C$2.5B, mostly ITC Holdings, and 2034F is about C$2.1B. Other years range from roughly C$0.9B to C$1.8B. Bar segments are not labelled with exact values, so the figures are approximate readings of the chart. U.S.-dollar debt is translated at the September 30, 2026 closing rate of 1.42.
Full-width stacked column chart with a dashed title rule and a legend.
Fixed and floating rate reset schedule for perpetual preference shares: Series I C$52M (floating, 3-month T-bill + 1.45%, resets quarterly); Series G C$230M (5-year GoC + 2.13%, resets September 1, 2028); Series K C$250M (+2.05%, March 1, 2029); Series M C$600M (+2.48%, December 1, 2029); Series H C$198M (+1.45%, June 1, 2030). Perpetual fixed rate: Series F C$125M (4.90%) and Series J C$200M (4.75%). Preference share ratings: S&P P-2, Fitch BBB- and Morningstar DBRS Pfd-2 (low), stable. S&P and Fitch assign 50% equity credit; Morningstar DBRS assigns 75%.
Horizontal timeline of reset-date boxes with a separate fixed-rate row; navy sidebar with ratings above a city photo.
Ratings by entity (S&P / Morningstar DBRS / Fitch / Moody's): Fortis Inc. A- / A (low) / BBB+ / withdrawn (Moody's withdrew at Fortis' request in January 2026, with no impact on subsidiary ratings); ITC Holdings A- / - / - / Baa2; ITC regulated subsidiaries A+ / - / - / A1; TEP A- / - / - / A3; Central Hudson BBB+ / - / BBB+ / Baa1; FortisBC Energy - / A / - / A3; FortisBC Electric - / A (low) / - / Baa1; FortisAlberta A- / A (low) / - / Baa1; Newfoundland Power - / A / - / A2.
Centered ratings matrix with agency logos as column headers.
Two-column glossary of abbreviations used in the deck, including ACC, ALJ, AMI, ATM, AUC, CAGR, CIACs, CPCN, DRIP, FERC, FFO, IRP, ITC, LRTP, MARS, MISO, MTEP, NOPR, OIC, PBR, Rate Base, ROE, ROO, RTO, Scope 1 Emissions, SPP, TEP and UNS, with definitions of Fortis' subsidiaries.
Two side-by-side term/definition tables in small type with banded rows.
Common questions about this slide and the underlying presentation content.
It is the 40-slide deck Fortis Inc. (NYSE/TSX: FTS) used on its Q3 2026 earnings conference call on November 3, 2026, presented by CEO David Hutchens and CFO Jocelyn Perry. It covers quarterly results, a new C$32.2B 2027-2031 capital plan, rate base growth, funding, credit ratings, sustainability, and an appendix of detailed financial tables.
Fortis is a Canadian company, and the deck was filed with the SEC as an exhibit to Form 6-K. All amounts are in Canadian dollars (C$) unless marked US$. U.S.-dollar capital plan and rate base figures for 2027-2031 are converted at a forecast USD:CAD rate of 1.35.
Q3 2026 actual and adjusted EPS was C$0.92, up from C$0.87 adjusted EPS in Q3 2025, and net earnings were C$474M. Year-to-date adjusted EPS was C$2.69 vs. C$2.63. Growth came mainly from ITC transmission, U.S. electric and gas, and western Canadian utilities, partly offset by dilution from the 2025 sale of Caribbean assets.
The plan totals C$32.2B, up C$3.4B (12%) on the prior plan and the largest in Fortis history. Transmission accounts for 47% and distribution for 29%. ITC (C$11.6B), UNS Energy (C$5.6B) and FortisBC Energy are the largest contributors. It drives a 7.5% rate base CAGR, from C$45.3B in 2026 to C$63.9B in 2031.
Fortis raised its Q4 2026 dividend by 4%, marking 53 consecutive years of increases in dividends paid, and extended its 4-6% annual dividend growth guidance through 2031.
Yes. It shows a clear structure for a regulated utility: highlights, EPS bridges, regulatory updates, the capital plan and rate base, a business-unit page per subsidiary, the funding plan and credit metrics, the dividend record, and an appendix of reconciliations and forecast tables. The donut-plus-bar business-unit layout and the waterfall EPS charts are easy to adapt.
The slides were rasterized for the SEC filing, but headline figures, tables and most footnotes are readable. Two charts, the 1973-2026 dividend history and the 2027-2036 debt maturity stack, do not label individual bar values, so only the highlighted figures and approximate readings are described here.
The deck points to MISO LRTP Tranche 2.1 work at ITC (US$2.9-3.4B of ROFR projects plus the MARS project), data-center and large-load growth at ITC and TEP, IRP generation opportunities in Arizona of up to about US$1.6B, and the Tilbury Phase 2 LNG Expansion in British Columbia, a potential C$2-4B opportunity.
Official investor relations site with quarterly results, presentations and filings

Create Your Own Slides
Turn your ideas into professional presentations in seconds with 2slides AI.
Reference professional designs, choose your style, and generate slides with perfect text rendering. Powered by Nano Banana—start creating your presentation now.
Your AI Agent for slides. Save time, shine faster with intelligent presentation creation.


© 2026 2slides. All rights reserved.