
Part of Investor presentation examples
Expedia Group Q3 2026 Earnings Presentation (November 4, 2026): a 21-slide investor deck covering third-quarter 2026 results for the quarter ended September 30, 2026, filed with the SEC as an exhibit to Form 8-K. It reports 115.7M booked room nights (+7% y/y), $34.0B gross bookings (+11%), $4.9B revenue (+12%), $1,689M Adjusted EBITDA (+17%) at a 34.2% margin (+135 bps), and $9.39 Adjusted EPS (+24%), with B2C and B2B segment breakdowns, operating-efficiency detail, free cash flow and capital return, raised full-year 2026 guidance, and a non-GAAP reconciliation appendix.
Uses this deck’s cover as a style reference for slides made from your own content. Or pick any page below to use its layout as the reference.
Quick Navigation
Tags
Share the slides
Expedia Group Q3 2026 Earnings Presentation (November 4, 2026): a 21-slide investor deck covering third-quarter 2026 results for the quarter ended September 30, 2026, filed with the SEC as an exhibit to Form 8-K. It reports 115.7M booked room nights (+7% y/y), $34.0B gross bookings (+11%), $4.9B revenue (+12%), $1,689M Adjusted EBITDA (+17%) at a 34.2% margin (+135 bps), and $9.39 Adjusted EPS (+24%), with B2C and B2B segment breakdowns, operating-efficiency detail, free cash flow and capital return, raised full-year 2026 guidance, and a non-GAAP reconciliation appendix.
Detailed view of each slide page, including layout, key content and visual elements.
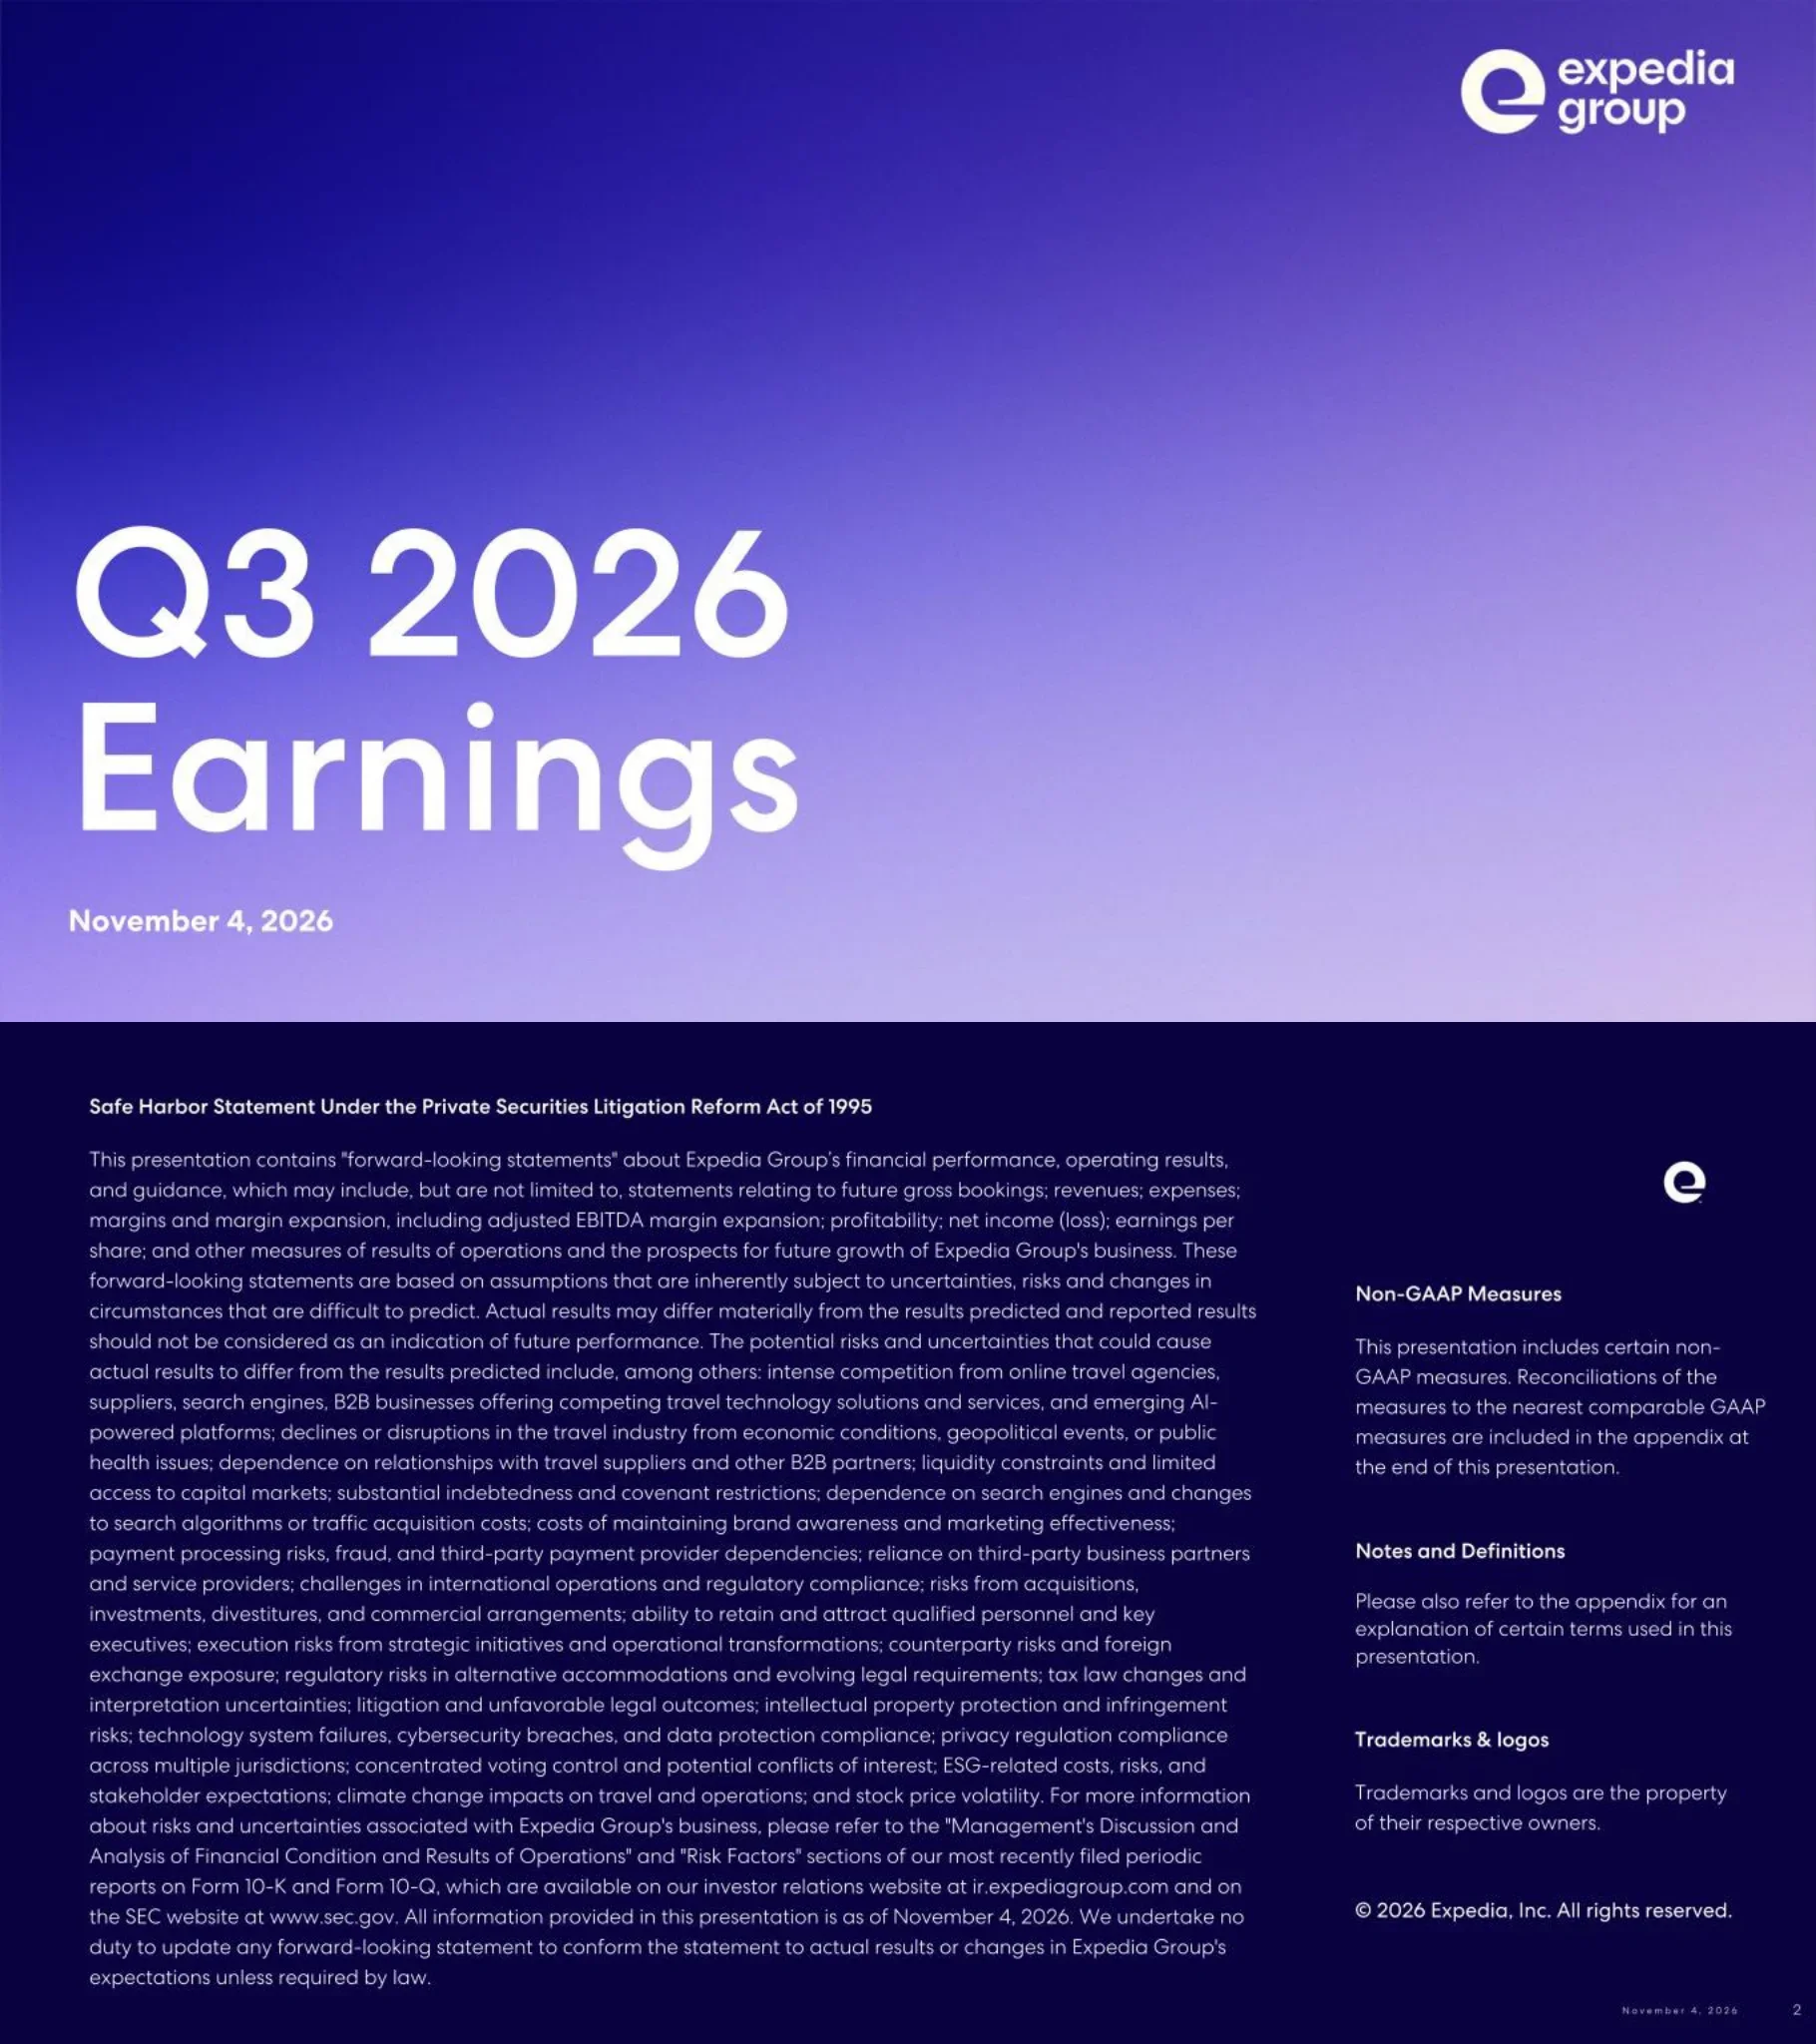
Cover slide reading 'Q3 2026 Earnings' dated November 4, 2026, with the Expedia Group logo in the top-right corner.
Full-bleed indigo-to-lavender gradient background; oversized white title anchored bottom-left with the date beneath; logo top-right.
Forward-looking statements disclaimer under the Private Securities Litigation Reform Act of 1995, listing risks such as competition from online travel agencies, search engines and emerging AI-powered platforms, travel disruptions, indebtedness, payment fraud, regulation of alternative accommodations and cybersecurity; information is as of November 4, 2026. A side column notes that non-GAAP reconciliations and definitions are in the appendix and that trademarks belong to their owners (© 2026 Expedia, Inc.).
Dark navy background; wide left text column for the safe harbor paragraph, narrow right column with three short headed notes and the 'e' logo mark.
Three key takeaways: exceeded top- and bottom-line guidance, expanded Adjusted EBITDA margins, and raised full-year guidance. Six KPI tiles: Booked Room Nights 115.7M (+7% y/y), Adjusted EBITDA $1,689M (+17%), Gross Bookings $34.0B (+11%), Adjusted EBITDA margin 34.2% (+135 bps), Revenue $4.9B (+12%) and Adjusted EPS $9.39 (+24%).
Split layout: left white panel with a large 'Q3-26 snapshot' headline, numbered takeaways and a coastal boardwalk photo; right lavender panel with a 2x3 grid of big blue numbers and labels.
Four paired bar charts comparing Q3-25 with Q3-26: Booked Room Nights 108.2M to 115.7M (+7%, growth led by B2B); Gross Bookings $30.7B to $34.0B (+11%; B2C +7%, B2B +19%); Revenue $4.4B to $4.9B (+12%; B2C +6%, B2B +23%); Adjusted EBITDA $1,449M to $1,689M (+17%, margin up 135 bps).
Four equal columns separated by thin dividers, each with a heading, unit label, grey prior-year and navy current-year bar, a growth-percentage pill with bracket arrow, and a caption below.
Five-quarter room nights: 108.2M (Q3-25), 94.0M, 113.9M, 111.5M, 115.7M (Q3-26), with y/y growth of 11%, 9%, 6%, 6%, 7% and TTM growth of 9%, 8%, 8%, 8%, 7%. Average daily rate: $210, $207, $228, $221, $215, with y/y of 2%, 4%, 7%, 5%, 2%. Regional room-night growth: US up mid single digits, EMEA up low single digits, Rest of World up mid-teens.
Two five-bar charts side by side with growth tables beneath, plus a rounded lavender call-out card on the right for regional commentary.
Gross bookings $30.7B, $27.0B, $35.5B, $33.9B and $34.0B over Q3-25 to Q3-26 (y/y 12%, 11%, 13%, 12%, 11%; lodging 13%, 13%, 13%, 11%, 10%; TTM lodging 9%, 9%, 11%, 13%, 12%). Revenue $4.4B, $3.5B, $3.4B, $4.3B, $4.9B (y/y 9%, 11%, 15%, 14%, 12%; lodging 9%, 11%, 14%, 13%, 11%; EG Advertising 16%, 19%, 13%, 13%, 7%). Commentary: bookings driven by room-night growth, higher ADR and air ticket prices; revenue outgrew bookings on volume flow-through and FX.
Two five-quarter bar charts with three-row growth tables, and a right-hand lavender commentary card with bolded lead phrases.
B2C gross bookings $21.3B, $18.3B, $24.8B, $23.2B, $22.9B (y/y 7%, 5%, 10%, 8%, 7%; TTM 4%, 3%, 6%, 7%, 7%). B2C revenue $2.9B, $2.2B, $2.1B, $2.7B, $3.1B (y/y 4%, 4%, 8%, 8%, 6%) with Adjusted EBITDA margins of 40.7%, 31.5%, 20.1%, 33.2% and 43.5%. Strength came from the US; bookings outgrew revenue on higher air ticket prices; margin rose nearly 3 points on marketing leverage, overhead discipline and favorable revenue mix.
Same two-chart plus commentary-card template as the group performance slide, with growth and margin rows beneath the bars.
B2B gross bookings $9.4B, $8.7B, $10.7B, $10.7B, $11.1B (y/y 26%, 24%, 22%, 21%, 19%; TTM 20%, 20%, 22%, 23%, 21%). B2B revenue $1.4B, $1.3B, $1.2B, $1.5B, $1.7B (y/y 18%, 24%, 25%, 23%, 23%) with Adjusted EBITDA margins of 28.9%, 23.9%, 22.7%, 24.8% and 27.5%. Double-digit growth across all regions helped by elevated partner marketing; revenue outgrew bookings on lodging flow-through and FX; margin pressured by partner mix and acquisition consolidation.
Mirror of the B2C slide: two five-quarter bar charts with growth and margin rows plus a lavender commentary card.
Adjusted cost of revenue rose 11% from $373M to $415M, flat at 8.4% of revenue (4 bps lower), helped by servicing and cloud efficiencies. Direct marketing rose 10% from $1,976M to $2,184M (B2C $1,032M to $1,028M, B2B $855M to $1,048M, Other $89M to $108M); B2C marketing fell from 4.8% to 4.5% of B2C gross bookings (34 bps). Adjusted overhead rose 1% from $620M to $627M, falling from 14.1% to 12.7% of revenue (136 bps) on efficiency savings.
Three columns, each a two-bar comparison with growth pill and a percentage-of-base row using a blue bps oval, topped by a heading and closed by a lavender explanation box.
Adjusted EBITDA $1,449M, $848M, $542M, $1,119M, $1,689M over Q3-25 to Q3-26 (y/y 16%, 32%, 83%, 23%, 17%) with margins of 32.9%, 23.9%, 15.8%, 25.9%, 34.2% and y/y expansion of 208, 368, 591, 196 and 135 bps. Adjusted EPS $7.57, $3.78, $1.96, $5.76, $9.39 (y/y 23%, 58%, 386%, 36%, 24%). Margin expansion came from revenue growth, B2C marketing leverage and overhead discipline; EPS outpaced EBITDA on accretive share repurchases.
Two five-quarter bar charts with growth and margin rows, plus a commentary card on the right.
Balance sheet at September 30, 2026: $5.6B of unrestricted cash and short-term investments and investment-grade ratings of BBB / Baa2 / BBB. Trailing-12-month free cash flow $3.0B, $3.1B, $4.1B, $4.5B, $3.7B (TTM y/y 57%, 34%, 72%, 123%, 25%). TTM capital return $1.7B, $1.9B, $2.2B, $1.8B and $2.0B, the latest split into $1.7B repurchases and $0.2B dividends; adjusted weighted average shares outstanding down 4-5% y/y each quarter.
Three panels: left headline numbers for liquidity and credit ratings, centre five-bar FCF chart, right five-bar capital return chart with a stacked final bar and share-count row.
Q4 2026 guidance: gross bookings $27.9-28.4B (+3.3-5.2%), revenue $3.69-3.75B (+4.0-5.7%), Adjusted EBITDA $830-880M. Full year 2026: gross bookings $131.4-131.9B (+10%), revenue $16.37-16.43B (+11-12%), Adjusted EBITDA margin expansion of 1.8-2.0 points. Figures are year-over-year and include FX; no reconciliation is provided for the forward Adjusted EBITDA measures.
Left two-thirds holds two rounded lavender cards (Q4 2026 and Full Year 2026) with metric, range and growth columns; right third is a full-height resort photograph.
Closing brand slide showing only the Expedia Group logo, marking the end of the main presentation before the appendix.
Solid dark navy background with a centred white logo lockup.
Section divider titled 'Appendix' with the 'Q3 2026 Earnings' eyebrow label.
Same gradient background as the cover, large white title at bottom-left, logo mark top-right.
Defines booked room nights (hotel room nights plus alternative-accommodation property nights), ADR booked (lodging gross bookings divided by room nights), gross bookings, and lodging metrics (booked basis except revenue on a stayed basis). Describes the B2C segment and its brands (Expedia, Hotels.com, Vrbo, Orbitz, Travelocity, Wotif Group, ebookers, Hotwire.com, CarRentals.com), the B2B segment serving airlines, travel agents, retailers, corporate travel and financial institutions, the trivago metasearch segment, and Expedia Group Advertising.
Two-column glossary with bold term names followed by plain definitions on a white background.
Defines Adjusted EBITDA as net income attributable to Expedia Group adjusted for nine items including non-controlling interests, income taxes, other expenses, stock-based compensation, acquisition-related impacts, restructuring, legal reserves and occupancy tax, certain revenue hedging gains or losses, and depreciation, and explains why management uses it.
Single full-width numbered list with sub-items and a closing explanatory paragraph.
Explains trailing-twelve-month information, defines free cash flow as operating cash flow less capital expenditures, explains why adjusted expenses exclude stock-based compensation, and notes that forward Adjusted EBITDA guidance is not reconciled because FX and minority investment gains or losses cannot be predicted.
Four bold-led paragraphs stacked full width.
Defines Adjusted Net Income as net income plus nine after-tax adjustments (stock-based compensation, acquisition impacts, currency effects on USD cash, equity investment fair value changes, restructuring, legal and occupancy tax reserves, discontinued operations, related NCI impact, unrealized revenue hedge gains or losses). Notes that a convertible-note conversion option loss was excluded in Q4 2025 and Q1 2026, and that the long-term projected tax rate moved from 21.5% to 20.0% after the US tax law enacted in Q3 2025.
Numbered list with sub-items, two explanatory paragraphs and a footnote on tax rate.
Defines Adjusted EPS as Adjusted Net Income divided by adjusted weighted average shares, using the treasury stock method for convertible debt dilution instead of the GAAP if-converted method, and cautions that it should be read alongside the consolidated statements of operations.
Single paragraph at the top of an otherwise white slide.
Five-quarter reconciliation table. Q3 2026: net income attributable to Expedia Group $1,030M, income before taxes $1,303M, adjusted income before taxes $1,448M, adjusted net income $1,148M at a 20.0% adjusted tax rate; GAAP diluted EPS $8.42 to Adjusted EPS $9.39 on 122,280 thousand shares. Prior quarters: Q2-26 $878M to $706M ($7.16 to $5.76), Q1-26 $(6)M to $245M ($(0.05) to $1.96), Q4-25 $205M to $478M ($1.60 to $3.78), Q3-25 $959M to $962M ($7.33 to $7.57).
Dense financial table with line-item labels on the left and five quarterly columns, split into a dollar section and a per-share section with share counts at the bottom; two footnotes.
Bridges net income to Adjusted EBITDA for five quarters. Q3 2026: operating income $1,326M plus stock-based compensation $120M, depreciation and amortization $224M and other items gives Adjusted EBITDA $1,689M; net income margin 20.9% and Adjusted EBITDA margin 34.2%. Segment Adjusted EBITDA for Q3 2026: B2C $1,331M, B2B $470M, trivago $19M, less $131M unallocated corporate costs; segment margins B2C 43.5% and B2B 27.5% (versus 40.7% and 28.9% in Q3 2025).
Two stacked tables with five quarterly columns: the top table bridges net income to Adjusted EBITDA, the bottom shows segment Adjusted EBITDA and margins; footnotes define margins and unallocated costs.
Common questions about this slide and the underlying presentation content.
For the quarter ended September 30, 2026, Expedia Group reported 115.7M booked room nights (+7% y/y), $34.0B gross bookings (+11%), $4.9B revenue (+12%), Adjusted EBITDA of $1,689M (+17%) at a 34.2% margin (+135 bps), and Adjusted EPS of $9.39 (+24%). The company said it beat its top- and bottom-line guidance and raised full-year guidance.
It is Expedia Group's own Q3 2026 earnings presentation dated November 4, 2026, filed with the SEC as an exhibit to Form 8-K. The slides were rasterized as images in that filing, and this PDF was assembled from those slide images. The company's investor relations site is ir.expediagroup.com.
B2B grew faster: gross bookings +19% to $11.1B and revenue +23% to $1.7B, with Adjusted EBITDA margin of 27.5% (down from 28.9% on partner mix and acquisition consolidation). B2C gross bookings rose 7% to $22.9B and revenue 6% to $3.1B, while its Adjusted EBITDA margin widened to 43.5% from 40.7% on marketing leverage and overhead discipline.
Q4 2026 guidance is gross bookings of $27.9-28.4B (+3.3-5.2%), revenue of $3.69-3.75B (+4.0-5.7%) and Adjusted EBITDA of $830-880M. Full-year 2026 guidance is gross bookings of $131.4-131.9B (+10%), revenue of $16.37-16.43B (+11-12%) and Adjusted EBITDA margin expansion of 1.8-2.0 points.
Yes. The appendix (pages 15-21) defines booked room nights, ADR, gross bookings and segments, explains Adjusted EBITDA, free cash flow, Adjusted Net Income and Adjusted EPS, and provides five-quarter reconciliation tables from GAAP net income to Adjusted Net Income, Adjusted EPS and Adjusted EBITDA, including segment Adjusted EBITDA.
Yes, as a layout reference. Its repeatable pattern (a five-quarter bar chart, a y/y growth table under the bars, and a lavender commentary card on the right) works for any recurring metric, and the snapshot slide shows how to compress a quarter into three takeaways and six KPI tiles. Replace Expedia's figures and branding with your own.
Expedia Group is classified under the GICS sub-industry Hotels, Resorts & Cruise Lines. It operates consumer travel brands such as Expedia, Hotels.com and Vrbo, a B2B travel technology and supply business, the trivago metasearch site, and Expedia Group Advertising.
Mostly. The headline charts, guidance and the appendix reconciliation tables are legible at the published resolution. Because the SEC filing stores the slides as images, some very small footnote text at the bottom of the chart pages is faint, so check exact footnote wording against the original Form 8-K exhibit.
Original exhibit filed by Expedia Group, Inc. with its Form 8-K for Q3 2026 results.

Create Your Own Slides
Turn your ideas into professional presentations in seconds with 2slides AI.
Reference professional designs, choose your style, and generate slides with perfect text rendering. Powered by Nano Banana—start creating your presentation now.
Your AI Agent for slides. Save time, shine faster with intelligent presentation creation.


© 2026 2slides. All rights reserved.