
Part of Investor presentation examples · Japanese investor presentation examples
Ebara Q3 FY2026 Earnings Presentation: Ebara Corporation (TSE 6361) nine-month results for January–September 2026 (FY ending December 2026), with record nine-month orders, revenue, operating profit and net profit, an upward revision to full-year orders, and segment detail for Precision & Electronics, Energy, Building & Industrial, Infrastructure and Environmental. This is a Japanese-language deck (決算説明会資料) dated November 13, 2026; the original was published on TDnet, the Tokyo Stock Exchange timely disclosure system.
Uses this deck’s cover as a style reference for slides made from your own content. Or pick any page below to use its layout as the reference.
Quick Navigation
Tags
Share the slides
Ebara Q3 FY2026 Earnings Presentation: Ebara Corporation (TSE 6361) nine-month results for January–September 2026 (FY ending December 2026), with record nine-month orders, revenue, operating profit and net profit, an upward revision to full-year orders, and segment detail for Precision & Electronics, Energy, Building & Industrial, Infrastructure and Environmental. This is a Japanese-language deck (決算説明会資料) dated November 13, 2026; the original was published on TDnet, the Tokyo Stock Exchange timely disclosure system.
Detailed view of each slide page, including layout, key content and visual elements.
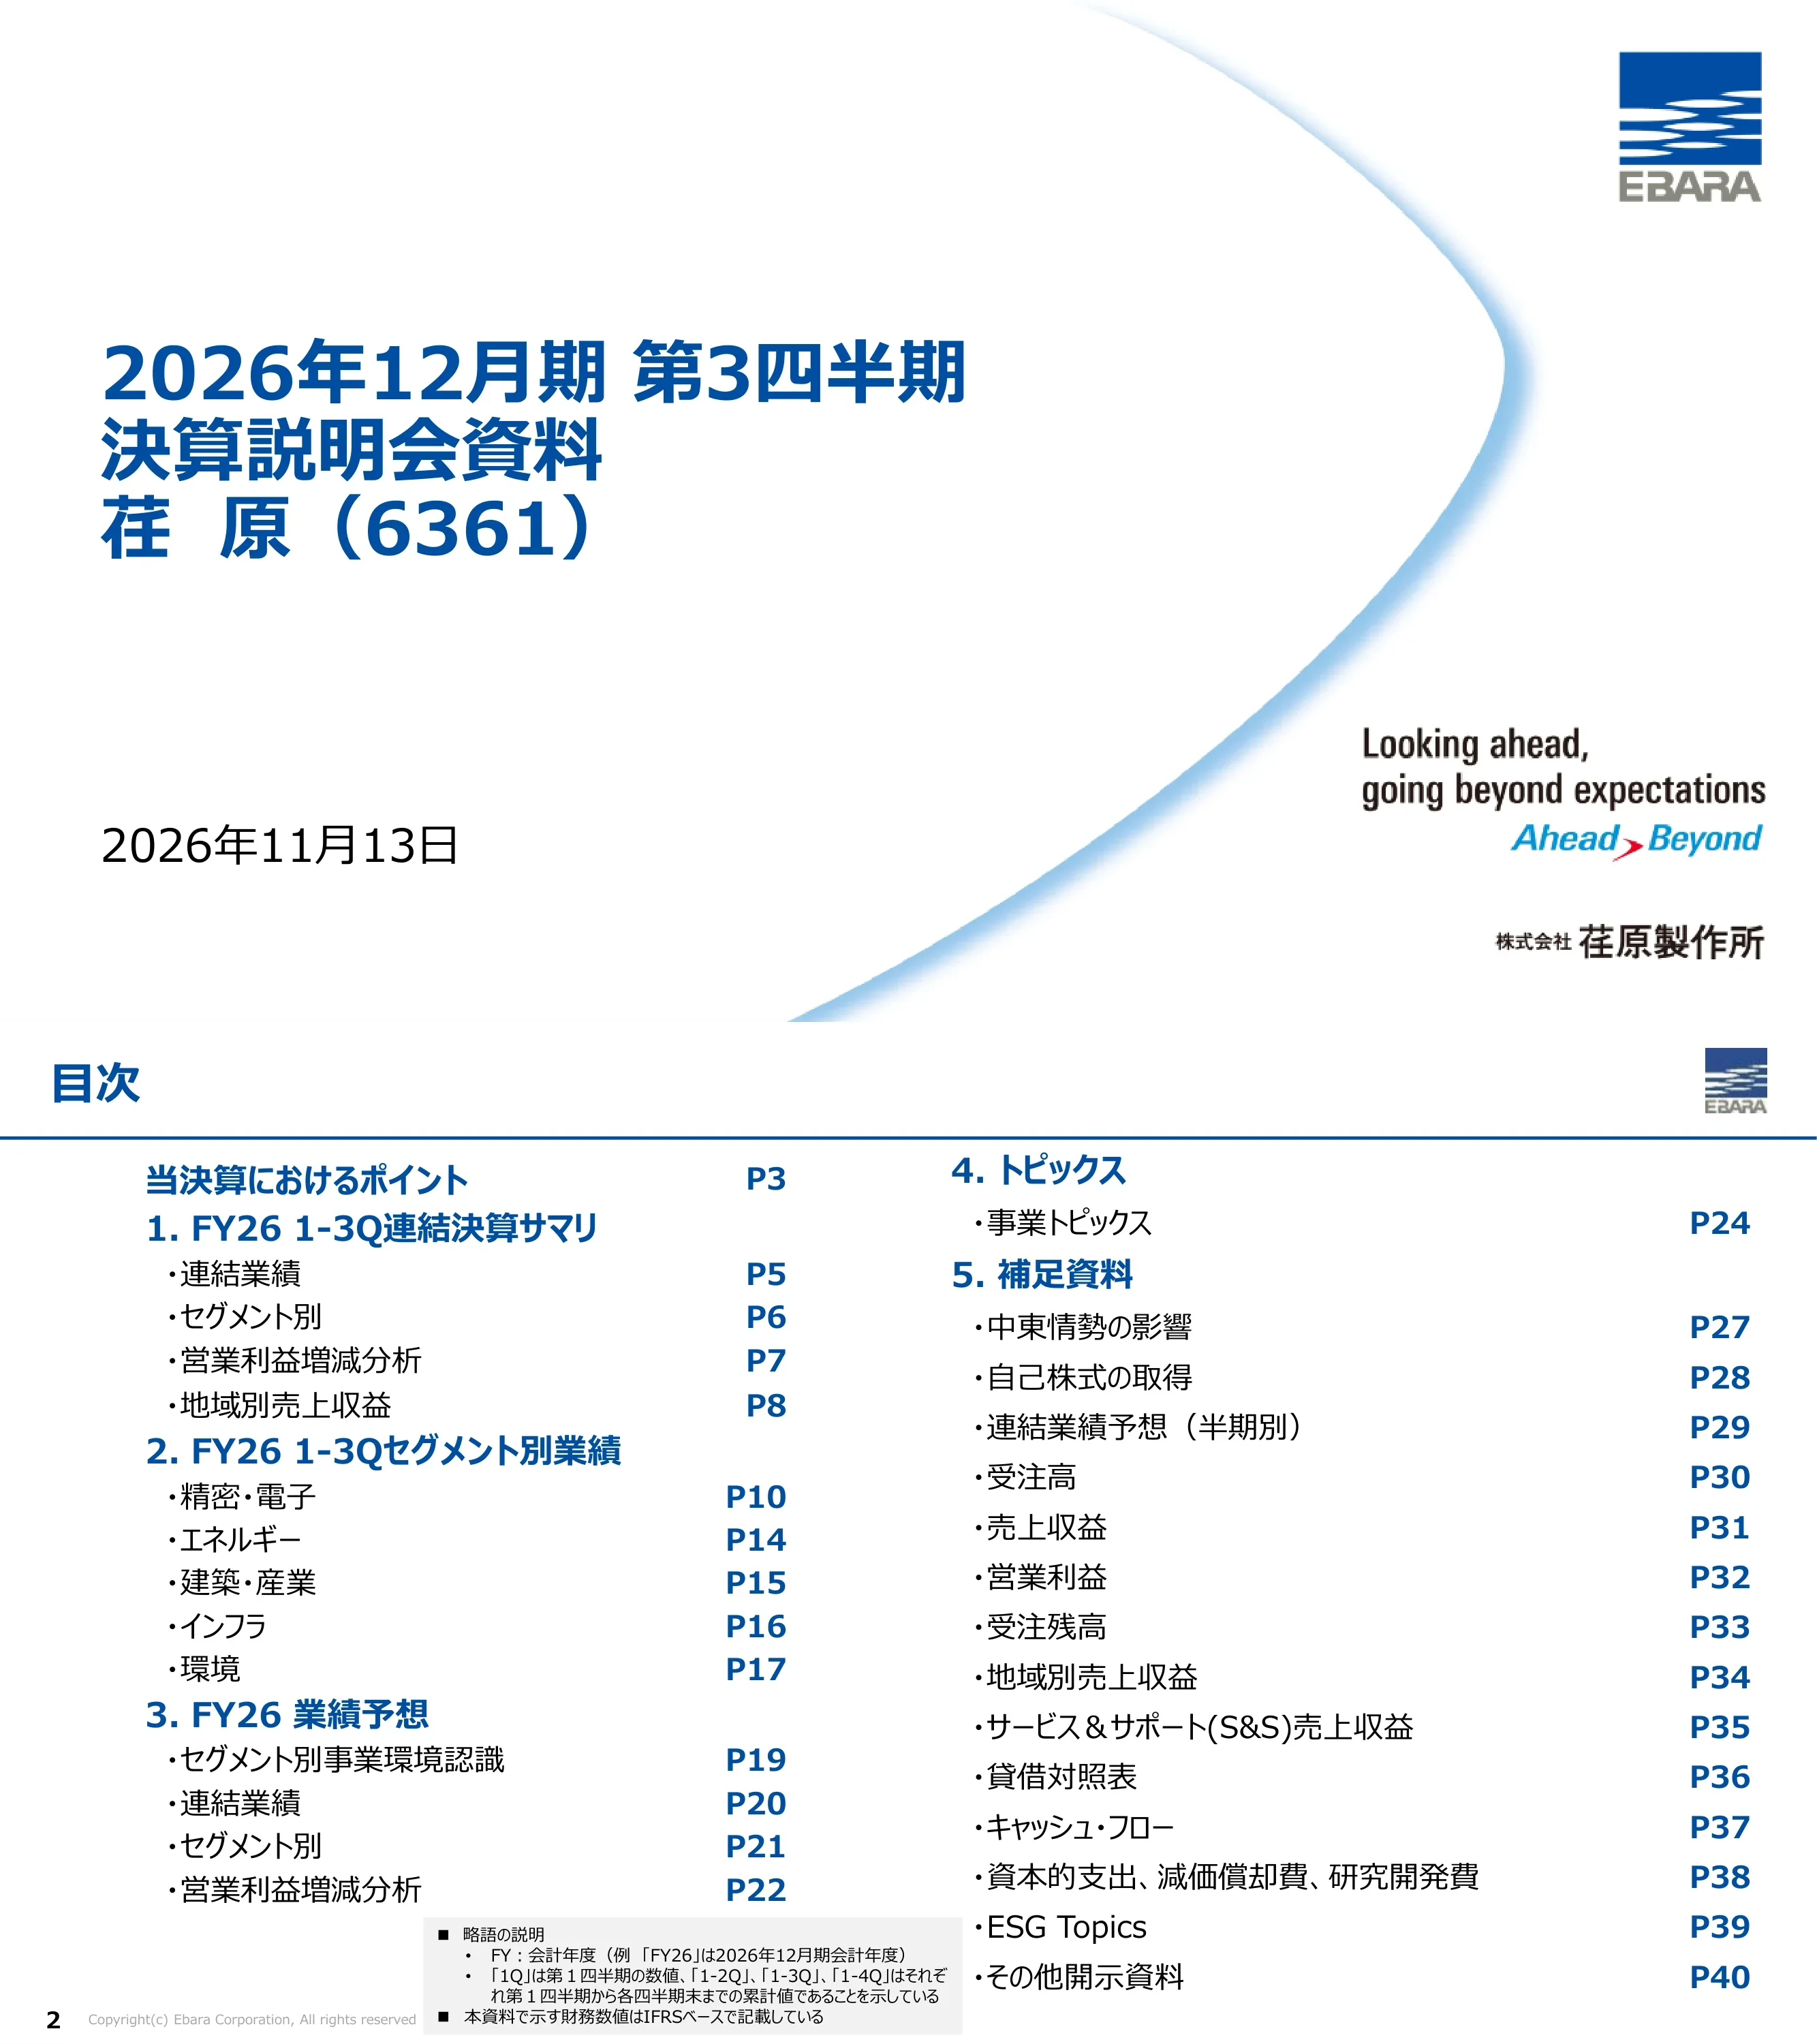
Title slide reading 'FY ending December 2026, Third Quarter, Earnings Presentation Materials, Ebara (6361)', dated November 13, 2026, with the Ebara Corporation name, logo and the tagline 'Looking ahead, going beyond expectations / Ahead > Beyond'.
Large left-aligned blue title block, date at lower left, logo top right, tagline and company name bottom right, sweeping light-blue arc across the right half.
Agenda with page references: Key points of these results (p3); 1. FY26 1-3Q consolidated summary (consolidated results, by segment, operating-profit change analysis, regional revenue); 2. FY26 1-3Q segment results (Precision & Electronics, Energy, Building & Industrial, Infrastructure, Environmental); 3. FY26 forecast (business environment by segment, consolidated, by segment, operating-profit analysis); 4. Topics (business topics, p24); 5. Supplementary materials (Middle East impact, share buyback, half-year forecasts, orders, revenue, operating profit, backlog, regional revenue, S&S revenue, balance sheet, cash flow, capex/depreciation/R&D, ESG topics, other disclosures). A note defines FY26 as the year ending December 2026, '1-3Q' as cumulative figures, and states figures are on an IFRS basis.
Two-column agenda list with blue section headings and right-aligned page numbers; grey footnote box with abbreviations at bottom center.
FY26 1-3Q results vs. prior year: orders 9,790 億円 (+2,988, +43.9%), revenue 7,459 億円 (+823, +12.4%), operating profit 835 億円 (+140, +20.2%), operating margin 11.2% (+0.7pts), quarterly profit attributable to owners of the parent 714 億円 (+267, +60.0%). FY26 full-year plan: orders 1兆2,950 億円 (+3,453, +36.4% YoY; +500, +4.0% vs. the August 14, 2026 plan), revenue 1兆530 億円 (+947, +9.9%), operating profit 1,250 億円 (+111, +9.8%), margin 11.9%, net profit 995 億円 (+228, +29.8%). Points: orders, revenue, operating profit and net profit hit record highs for a third quarter; Precision & Electronics and Energy drove order growth; other segments offset Energy's lower revenue and profit; a 206 億円 pre-tax gain was booked on the transfer of shares in 水ing (an equity-method affiliate until Q1). Forecast: orders raised to reflect strong Precision & Electronics demand; revenue and operating profit kept unchanged; Precision & Electronics revenue kept despite Kumamoto earthquake supply-chain impact; Energy operating profit revised down because Middle East-related S&S sales fell short. Capital policy: additional share buyback of up to 50 億円.
Two side-by-side KPI tables (nine-month actuals and full-year plan) with trend arrows, followed by a 'Points' section with three labeled rows: FY26 1-3Q results, FY26 forecast, capital policy.
Section divider highlighting section 1 (consolidated summary) with the other four sections greyed out.
Vertical list of five section titles; the active one in bold blue, the others in light grey.
Table in 億円 comparing FY25 1-3Q with FY26 1-3Q: orders 6,801 → 9,790 (+2,988, +43.9%); revenue 6,635 → 7,459 (+823, +12.4%); operating profit 695 → 835 (+140, +20.2%); operating margin 10.5% → 11.2% (+0.7pts); quarterly profit attributable to owners of the parent 446 → 714 (+267, +60.0%); basic EPS ¥96.76 → ¥156.67 (+59.91, +61.9%). Average exchange rates: USD ¥148.18 → ¥158.48, EUR ¥165.50 → ¥184.06, CNY ¥20.53 → ¥23.23.
Single financial table with blue header (prior year, current year, change, change rate), bold current-year column, separate FX-rate sub-table below.
FY25 1-3Q vs. FY26 1-3Q by segment (億円). Precision & Electronics: orders 2,010 → 4,266 (+112.2%), revenue 2,233 → 2,935 (+31.5%), OP 328 → 581 (+77.0%), margin 14.7% → 19.8%. Energy: orders 1,509 → 1,689 (+11.9%), revenue 1,593 → 1,448 (-9.1%), OP 170 → 14 (-91.7%), margin 10.7% → 1.0%. Building & Industrial: orders 1,883 → 2,236 (+18.8%), revenue 1,734 → 1,949 (+12.4%), OP 105 → 131 (+24.1%), margin 6.1% → 6.7%. Infrastructure: orders 456 → 387 (-15.2%), revenue 417 → 437 (+4.9%), OP 36 → 47 (+29.4%), margin 8.8% → 10.8%. Environmental: orders 933 → 1,203 (+28.9%), revenue 648 → 680 (+4.9%), OP 72 → 90 (+24.2%), margin 11.2% → 13.3%. Other/adjustments OP -19 → -29. Footnote: from FY26 Q1 part of the hydrogen business P&L is included in Energy.
Long table grouped by segment with color-coded side bars; four metrics per segment; columns for prior year, current year, change and change rate.
Waterfall from FY25 1-3Q operating profit of 695 億円 to FY26 1-3Q of 835 億円: revenue effect +232 (higher revenue in Precision & Electronics, Building & Industrial, Infrastructure, Environmental), profitability +136 (mainly Precision & Electronics, Building & Industrial, Environmental), fixed costs -286 (higher personnel costs including base-pay increases, higher depreciation), FX +49, other +9. Headline: profit rose mainly on revenue growth and better profitability.
Horizontal waterfall chart with dark-blue start/end bars, light-blue positive and grey negative steps, annotation boxes linked by thin lines.
Clustered bars comparing FY25 1-3Q and FY26 1-3Q revenue by customer location (億円): Japan 2,240 → 2,395 (+6.9%); Taiwan, Korea and other Asia 1,315 → 1,863 (+41.7%); China 1,147 → 1,243 (+8.4%); North America 896 → 868 (-3.1%); Europe 417 → 514 (+23.3%); Middle East 375 → 285 (-24.1%); Other 243 → 288 (+18.7%). Donut chart of FY26 1-3Q mix: Japan 32%, Taiwan/Korea/other Asia 25%, China 17%, North America 12%, Europe 7%, Middle East 4%, Other 4%; domestic 32%, overseas 68%.
Paired bar chart on the left with boxed percentage changes; donut chart on the right with domestic/overseas split in the center.
Section divider highlighting section 2 (segment results).
Five-item section list with the active item in bold blue and the rest greyed out.
Cumulative trend charts (FY25 vs. FY26; FY26 1-4Q is plan): orders 1,512 / 2,674 / 4,266 with a 6,000 plan (FY25: 739 / 1,413 / 2,010 / 3,034); revenue 829 / 1,836 / 2,935, plan 4,250; operating profit 135 / 325 / 581, plan 790; margin 16.3% / 17.7% / 19.8%, plan 18.6%. Product vs. S&S revenue: products 1,538 → 2,078, S&S 695 → 857 (S&S ratio 31% → 29%). Regional revenue: Japan 436 → 555, Asia 1,407 → 1,900, North America 268 → 303, Europe 110 → 168, Other 9 → 9 (domestic 19%, overseas 81%). OP bridge: 328 +261 revenue +66 profitability -109 fixed costs +35 FX = 581. Points: AI-related demand leads the market, customer fab utilization high and capacity investment expanding, China flat year on year; equipment and component orders up, CMP products sharply up for logic/foundry and memory; revenue up for both products and S&S; profit up on revenue, mix and gross margin, partly offset by personnel, depreciation and R&D costs.
Segment dashboard: four mini charts (orders, revenue, operating profit, margin) top left; product/S&S bar chart, regional bar chart and OP waterfall along the bottom; 'Points' panel with market, orders, revenue and OP rows on the right.
Quarterly orders and revenue FY24–FY26 for the segment and its two sub-segments (CMP and 'other' merged into 'Equipment'; the other sub-segment is 'Components'). Segment orders FY26: 1,512 / 1,162 / 1,592, 4Q plan 1,733; equipment 1,146 / 715 / 1,026, 4Q plan 1,211; components 365 / 446 / 565, 4Q plan 523. Segment revenue FY26: 829 / 1,007 / 1,098, 4Q plan 1,315; equipment 539 / 684 / 712, 4Q plan 963; components 289 / 322 / 386, 4Q plan 351. FY24 and FY25 quarterly bars are also labeled.
Two rows (orders, revenue) by three columns (segment, equipment, components) of quarterly bar charts grouped by fiscal year; plan bars shown as outlined boxes.
Half-year orders and revenue FY24–FY26. Segment orders: FY24 1,159 / 1,441; FY25 1,413 / 1,621; FY26 2,674 / 3,325 (2H plan). Equipment orders FY26 1,862 / 2,237 plan; components 811 / 1,088 plan. Segment revenue: FY24 1,222 / 1,561; FY25 1,505 / 1,917; FY26 1,836 / 2,413 plan; equipment FY26 1,224 / 1,675 plan; components 612 / 737 plan. Callout: the Kumamoto earthquake's supply-chain impact pushed 20,000–30,000 million yen (200–300 億円) of equipment revenue into FY27, but FY26 revenue is kept unchanged.
Same 2x3 grid as the quarterly page using half-year bars, with an orange-bordered callout box over the equipment revenue chart.
Stacked bars of quarterly product revenue split into memory and non-memory, FY23 1Q to FY26 3Q. FY26: 1Q 587 (memory 28%, non-memory 72%), 2Q 716 (27% / 73%), 3Q 775 (28% / 72%). Earlier peaks include FY25 4Q at 920 (32% / 68%). Footnotes: memory/non-memory split is company-defined; the FY26 2Q mix was restated retroactively to correct an error.
Full-width stacked column chart with totals above bars and percentage labels inside segments, grouped by fiscal year.
Cumulative FY26: orders 557 / 1,125 / 1,689, plan 2,200 (FY25 1-4Q 1,947); revenue 465 / 967 / 1,448, plan 2,050 (FY25 2,178); operating profit -16 / -7 / 14, plan 130 (FY25 259); margin -3.6% / -0.8% / 1.0%, plan 6.3%. Product revenue 768 → 654, S&S 825 → 794 (S&S ratio 52% → 55%). Regional: Japan 68 → 18, Asia 564 → 651, North America 487 → 387, Europe 109 → 116, Middle East 286 → 206, Other 76 → 68 (domestic 1%, overseas 99%). OP bridge: 170 -93 revenue +7 profitability -74 fixed costs +4 FX = 14. Points: oil & gas demand recovering overall with uncertainty from the Middle East; petrochemicals slowing in China; LNG solid in North America and the Middle East; power solid in China. Orders up on large oil & gas projects (petrochemical orders in China down); S&S orders up. Product revenue down due to lower opening backlog; S&S revenue down due to delayed parts shipments and fewer supervisor dispatches to the Middle East. OP hit by lower revenue, hydrogen-related fixed costs and an operation loss at the US Jeannette plant.
Standard segment dashboard in red: four mini charts, product/S&S and regional bars, OP waterfall, Points panel on the right.
Cumulative FY26: orders 703 / 1,484 / 2,236, plan 2,800; revenue 630 / 1,295 / 1,949, plan 2,650; operating profit 44 / 83 / 131, plan 190; margin 7.0% / 6.4% / 6.7%, plan 7.2%. Products 1,359 → 1,546, S&S 375 → 403 (S&S ratio 22% → 21%). Regional: Japan 739 → 759, Asia 426 → 502, North America 132 → 174, Europe 197 → 229, Middle East 70 → 67, Other 166 → 216 (domestic 39%, overseas 61%). OP bridge: 105 +46 revenue +28 profitability -67 fixed costs +10 FX +9 other = 131. Points: GDP growth recovering in North America but weak elsewhere; strong data-center and semiconductor demand; China building-equipment market still weak on property-investment curbs. Domestic orders up for products and S&S; data-center orders strong; in China, industrial orders tied to data centers and semiconductors rose. Revenue up in Japan and in every overseas region except the Middle East, especially the Americas. Profit helped by productivity gains despite material costs and by no repeat of last year's bad-debt allowance for a bankrupt US customer.
Segment dashboard in teal with mini charts, product/S&S and regional bars, OP waterfall and Points panel.
Cumulative FY26: orders 147 / 263 / 387, plan 600 (FY25 1-4Q 629); revenue 232 / 321 / 437, plan 600; operating profit 61 / 56 / 47, plan 60; margin 26.3% / 17.4% / 10.8%, plan 10.0%. Products 213 → 226, S&S 204 → 211 (S&S ratio 49% → 48%). Regional: Japan 342 → 377, Asia 59 → 49, North America 6 → 3, Middle East 9 → 3, Other 0 → 3 (domestic 86%, overseas 14%). OP bridge: 36 +8 revenue +4 profitability -1 fixed costs +0 FX = 47. Points: domestic public pump market solid; investment in disaster prevention/mitigation and aging-infrastructure measures under Japan's First Mid-term Plan for National Resilience remains steady. Domestic orders below the prior year, which had several large projects, with some public projects delayed; overseas orders flat. Revenue up, led by domestic public projects; profitability improved on more completed projects.
Segment dashboard in blue with mini charts, product/S&S and regional bars, OP waterfall and Points panel.
Cumulative FY26: orders 324 / 808 / 1,203, plan 1,350 (FY25 1-4Q 1,353); revenue 301 / 479 / 680, plan 980; operating profit 61 / 66 / 90, plan 135; margin 20.5% / 14.0% / 13.3%, plan 13.8%. EPC revenue 150 → 113, O&M 498 → 567 (O&M ratio 77% → 83%). Regional: Japan 642 → 676, Asia 5 → 3 (domestic 99%, overseas 1%). OP bridge: 72 +10 revenue +33 profitability -25 fixed costs +0 FX = 90. Points: new-build demand for public waste-treatment plants in Japan steady; O&M orders at typical levels. Two large orders won in FY26 1-3Q (one waste-plant DBO contract, one refurbishment/long-term comprehensive contract) vs. three in the prior-year period. Revenue up on O&M, centered on life-extension and maintenance. Profit up on O&M mix and release of contingencies on completed EPC projects. Definitions: DBO = design, procurement, construction plus operation and maintenance for a set period; EPC = plant design, procurement and construction.
Segment dashboard in green; EPC/O&M split replaces the product/S&S chart; includes a small table of large orders.
Section divider highlighting section 3 (FY26 forecast).
Five-item section list with the active item highlighted in blue.
Table of main markets, trends and company market outlook for FY26 (as of November 2026). Precision & Electronics (semiconductor manufacturing): market expanding on AI; logic/foundry and memory investment growing; fab utilization high; WFE (wafer fab equipment) expected to grow 20% or more globally. Energy (oil & gas, new energy, power): products solid, petrochemicals slowing in China, LNG solid, Middle East impact watched; service uncertainty around Middle East parts and services; decarbonization (ammonia, hydrogen, CCUS) moving toward commercialization; LNG ~6% growth, ethylene ~3% growth. Building & Industrial: overseas ~2% growth (Europe weak, China weak, US cautious but data-center demand rising, Middle East impact limited); domestic flat. Infrastructure (water infrastructure, ventilation): domestic flat on national resilience plans; overseas ~4% growth on Asian water demand, North American aging facilities and drainage pump demand. Environmental (solid-waste treatment): domestic flat, with rising life-extension demand.
Five-row matrix with colored segment cells, market column, bullet-point trend column, arrow icons (global/overseas/domestic) and outlook column.
Headline: orders revised up; revenue, operating profit and net profit kept. Table (億円): FY25 actual / FY26 prior plan (Aug 14, 2026) / FY26 plan (Nov 13, 2026): orders 9,496 / 12,450 / 12,950 (+3,453 YoY, +36.4%; +500 vs. prior plan, +4.0%); revenue 9,582 / 10,530 / 10,530 (+947, +9.9%); operating profit 1,138 / 1,250 / 1,250 (+111, +9.8%); margin 11.9% for all three; net profit 766 / 995 / 995 (+228, +29.8%). ROIC 11.9% / 11.8% / 11.8%; ROE 15.6% / 18.8% / 18.8%; basic EPS ¥166.31 / ¥217.93 / ¥218.10; annual dividend ¥59.0 / ¥66.0 / ¥66.0. Assumed FX: USD ¥145, EUR ¥175, CNY ¥20 (FY25 actual 149.63 / 168.94 / 20.83).
Headline message bar above a large forecast table with highlighted current-plan column, ratio block and FX block.
Full-year segment plan (億円), FY25 actual → FY26 new plan (change vs. prior plan): Precision & Electronics orders 3,034 → 6,000 (+500), revenue 3,422 → 4,250 (unchanged), OP 577 → 790 (+20), margin 18.6%. Energy orders 1,947 → 2,200, revenue 2,178 → 2,050, OP 259 → 130 (-50 vs. prior plan of 180), margin 6.3%. Building & Industrial orders 2,492 → 2,800, revenue 2,419 → 2,650, OP 152 → 190, margin 7.2% (unchanged). Infrastructure orders 629 → 600, revenue 571 → 600, OP 46 → 60 (+5), margin 10.0%. Environmental orders 1,353 → 1,350, revenue 978 → 980, OP 130 → 135 (+5), margin 13.8%. Other/adjustments OP -28 → -55 (+20 vs. prior plan of -75). Footnotes on the hydrogen reclassification and the Kumamoto earthquake revenue shift.
Segment-grouped table with color bars, highlighted new-plan column and YoY / vs.-prior-plan change columns.
Left waterfall, FY25 actual 1,138 to FY26 new plan 1,250 億円: Precision & Electronics +212 (AI-related demand), Energy -129 (lower revenue, hydrogen-related fixed costs, US Jeannette plant operation loss), Building & Industrial +37 (domestic S&S, Americas and EMEA growth), Infrastructure +13 (backlog conversion), Environmental +4 (revenue and contingency releases), Other -26 (settlement loss from retirement benefit plan revision). Right waterfall, prior plan 1,250 to new plan 1,250: Precision & Electronics +20 (mix and gross margin), Energy -50 (see p25), Infrastructure +5 (smooth construction progress), Environmental +5 (fixed-cost cuts and profitability), Other +20 (review of corporate costs including the retirement benefit plan revision).
Two side-by-side waterfall charts with callout boxes for each driver.
Section divider highlighting section 4 (topics).
Five-item section list with the active item highlighted in blue.
To meet medium- to long-term demand growth, Ebara is expanding equipment production capacity: (1) strengthening production at the Kumamoto plant for step-by-step volume increases; (2) leasing a large, high-spec cleanroom at the Mobara plant — part of a factory that Shinko Electric Industries plans to acquire from Japan Display — to secure capacity while shortening start-up time and investment versus building a new plant, and improving BCP and supply stability. Lease outline: Japan Display Mobara Plant Building J1 (to be acquired by Shinko Electric in March 2027), Hayano, Mobara City, Chiba Prefecture; part of J1 (cleanroom etc.); contract signed November 13, 2026; lease start April 1, 2027 (planned); 12 years from handover. Capacity image (2026 = 1.0): 1.5x in 2027 after Kumamoto upgrades; room to expand to 2.5x from 2028 with the Mobara plant.
Text bullets and lease-outline table on the left; capacity bar chart with arrows on the right.
Full-year Energy OP plan: initial 210 → prior plan 180 (Aug 14, -30 due to US Jeannette plant operation loss and Middle East impact) → new plan 130 (Nov, -50). Reasons for the new cut: Jeannette losses largely ended by 1H; heightened Middle East instability means S&S sales (repairs, technical advisors, parts) expected in 2H fall short; product sales progressing but not enough to cover the S&S profit drop. Half-year OP: FY24 75 / 205, FY25 111 / 148, FY26 1H -7, 2H plan 137 (22 in 3Q plus 115 expected in 4Q). Q4 outlook: 115 億円 profit expected from high-margin S&S parts concentrated in 4Q, products from the normalized Jeannette plant and strict fixed-cost cuts. Toward FY27: Jeannette loss expected to end in FY26; productivity, delivery and cost gains from normalization and automation; conversion of the high backlog; S&S growth from the Houston flagship and a new Abu Dhabi base; more orders in LNG upstream/midstream and turnaround S&S.
Left column with two small bar charts (plan revisions, half-year OP); right column with red-headed text blocks; bottom 'Toward FY27' band.
Section divider highlighting section 5 (supplementary materials).
Five-item section list with the active item highlighted in blue.
Impact mainly expected in Energy and Building & Industrial; the plan assumes current tensions and logistics constraints continue to end-December 2026, with direct impact built into the forecast; further impact possible. Direct OP impact (億円) — FY26 1-2Q actual / prior full-year estimate (Aug 14) / new full-year estimate (Nov 13): Precision & Electronics (material and logistics costs) -1 / -2 / -2; Energy (delayed S&S sales in the Middle East, logistics disruption and costs) -16 / -10 / -60; Building & Industrial (raw material and energy prices, lead-time-driven sales delays) -5 / -10 / -10; Infrastructure (no impact) 0 / 0 / 0; Environmental (construction delays from material shortages such as resin) 0 / -1 / -1; consolidated total -22 / -23 / -73.
Three bullet points above a table with segment, main impacts and three numeric columns.
Additional buyback: while making needed investments and staying within financial discipline (D/E ratio 0.4–0.5 and cash at 1.5–2.0 months of revenue), Ebara keeps adjusting equity toward its ROE target (18% or more by FY28). 100 億円 already repurchased in FY26; an additional buyback of up to 50 億円 was decided. Terms: common stock; up to 1,700,000 shares; up to 50 億円; November 16 – December 31, 2026; purpose: optimize equity and raise long-term shareholder value. Chart of dividends and buybacks (cash-flow basis, 億円): 2021 dividends 104 + buyback 200 = 304; 2022 182; 2023 189; 2024 227; 2025 277 + 200 = 477; 2026 plan 292 + 100 + additional 50.
Policy text and terms table on the left; stacked bar chart of shareholder returns on the right.
Half-year table FY24–FY26 (億円). Consolidated: orders FY24 3,996 / 4,609, FY25 4,513 / 4,983, FY26 1H 6,362 / 2H plan 6,587; revenue 3,945 / 4,721, 4,487 / 5,095, 4,907 / 5,622; OP 399 / 580, 500 / 638, 506 / 743; margin 10.1% / 12.3%, 11.2% / 12.5%, 10.3% / 13.2%. FY26 2H plan by segment: Precision & Electronics orders 3,325, revenue 2,413, OP 464 (19.3%); Energy 1,074 / 1,082 / 137 (12.7%); Building & Industrial 1,315 / 1,354 / 106 (7.9%); Infrastructure 336 / 278 / 3 (1.4%); Environmental 541 / 500 / 68 (13.6%); Other/adjustments OP -38.
Dense table grouped by consolidated total and five segments, with half-year columns per fiscal year and a highlighted FY26 2H plan column.
Cumulative orders (億円) FY25 1Q/1-2Q/1-3Q/1-4Q and FY26 1Q/1-2Q/1-3Q/1-4Q plan. Consolidated: 1,998 / 4,513 / 6,801 / 9,496; FY26 3,249 / 6,362 / 9,790 / plan 12,950. Precision & Electronics FY26 1-3Q 4,266 (plan 6,000) — equipment 2,888 (plan 4,100), components 1,377 (plan 1,900). Energy 1,689 (2,200); Building & Industrial 2,236 (2,800); Infrastructure 387 (600); Environmental 1,203 (1,350); Other 7.
Table with segment rows and cumulative-period columns; FY26 1-3Q bold, plan column shaded.
Cumulative revenue (億円). Consolidated FY25: 2,126 / 4,487 / 6,635 / 9,582; FY26: 2,463 / 4,907 / 7,459 / plan 10,530. FY26 1-3Q by segment (full-year plan): Precision & Electronics 2,935 (4,250) — equipment 1,937 (2,900), components 998 (1,350); Energy 1,448 (2,050); Building & Industrial 1,949 (2,650); Infrastructure 437 (600); Environmental 680 (980); Other 7.
Same table format as the orders page.
Cumulative operating profit (億円). Consolidated FY25: 226 / 500 / 695 / 1,138; FY26: 267 / 506 / 835 / plan 1,250. FY26 1-3Q by segment (plan): Precision & Electronics 581 (790); Energy 14 (130); Building & Industrial 131 (190); Infrastructure 47 (60); Environmental 90 (135); Other/adjustments -29 (-55).
Same table format as the orders and revenue pages.
Quarter-end backlog (億円) from FY24 4Q to FY26 3Q plus FY26 4Q plan. Consolidated: 9,171 (FY24 4Q); FY25 8,868 / 9,005 / 9,196 / 9,120; FY26 9,933 / 10,592 / 11,389, 4Q plan 11,540. FY26 3Q by segment (4Q plan): Precision & Electronics 2,823 (3,265); Energy 2,389 (2,313); Building & Industrial 1,041 (907); Infrastructure 773 (834); Environmental 4,360 (4,216); Other 0 (1).
Table of quarter-end balances by segment with bold FY26 3Q column and shaded 4Q plan.
Cumulative regional revenue by segment (億円) with FY26 composition ratios. Precision & Electronics FY26 1-3Q 2,935: Japan 555 (19%), Asia excl. Japan 1,900 (65%), North America 303 (10%), Europe 168 (6%), Other 9. Energy 1,448: Japan 18 (1%), Asia 651 (45%), North America 387 (27%), Europe 116 (8%), Middle East 206 (14%), Other 68 (5%). Building & Industrial 1,949: Japan 759 (39%), Asia 502 (26%), North America 174 (9%), Europe 229 (12%), Middle East 67 (3%), Other 216 (11%). Infrastructure 437: Japan 377 (86%), Asia 49 (11%), North America 3, Middle East 3. Environmental 680: Japan 676 (99%), Asia 3 (1%). FY25 1Q–1-4Q figures are also shown.
Long dense table: segment total rows followed by regional rows; FY26 columns paired with composition-ratio columns.
S&S revenue and ratio by segment (億円), FY25 1Q to 1-4Q and FY26 1Q to 1-3Q. FY26 1-3Q: Precision & Electronics 857 (29%); Energy 794 (55%); Building & Industrial 403 (21%); Infrastructure 211 (48%); Environmental O&M revenue 567 (O&M ratio 83%). FY25 full year: 970 (28%), 1,173 (54%), 546 (23%), 268 (47%), O&M 753 (77%).
Table with two rows per segment (revenue and ratio) across cumulative-period columns.
(億円) FY25 3Q / FY25 4Q / FY26 3Q: total assets 10,482 / 10,822 / 11,204; current assets 7,031 / 7,173 / 7,348 (cash and equivalents 1,739 / 1,434 / 1,582; trade receivables 2,614 / 3,324 / 3,066; inventories 2,202 / 1,976 / 2,194; other 475 / 437 / 504); non-current assets 3,450 / 3,648 / 3,856. Total liabilities 5,558 / 5,605 / 5,640 (trade payables 1,320 / 1,252 / 1,273; interest-bearing debt 2,071 / 2,247 / 2,222; other 2,167 / 2,105 / 2,144). Total equity 4,923 / 5,216 / 5,563, of which owners of the parent 4,798 / 5,088 / 5,443. Equity attributable to owners ratio 45.8% / 47.0% / 48.6%; D/E ratio 0.43 / 0.44 / 0.41.
Balance-sheet table with hierarchical indentation and two change columns (vs. prior-year 3Q and vs. year-end).
(億円) 1-3Q FY25 → FY26: operating CF 441 → 984 (+542); investing CF -605 → -354 (+250); free CF -164 → 629 (+793); financing CF 181 → -490 (-672). Full year: FY25 actual / FY26 prior plan / FY26 new plan: operating 407 / 1,000 / 1,000; investing -912 / -550 / -600; free CF -504 / 450 / 400; financing 168 / -350 / -200. Footnote: FY26 1-3Q includes cash from the 水ing share transfer — 53 億円 dividends received (operating) and 242 億円 proceeds from selling the equity-method investment (investing).
Cash-flow table split into nine-month and full-year blocks with a shaded new-plan column and footnote.
(億円) 1-3Q FY25 → FY26: capex 772 → 588 (-183); depreciation 249 → 309 (+60); R&D 161 → 179 (+18). Full year FY25 actual / FY26 prior plan / new plan: capex 1,007 / 990 / 930 (Precision & Electronics 210, Energy 260, Building & Industrial 140, Infrastructure 10, Environmental 20, Other 290); depreciation 348 / 420 / 420; R&D 232 / 250 / 250 (Precision & Electronics 110, Energy 50, Building & Industrial 50, Infrastructure 10, Environmental 30).
Two-block table (nine-month and full-year) with segment breakdowns under each of the three metrics.
Recent news releases. Environment: Ebara Environmental Plant is running a feasibility study with three companies on resource recycling through green methanol made from woody biomass and waste, described as a first in Japan (2026/9); 'ecoCSV' activities with suppliers recognizing proposals that cut greenhouse gases and improve efficiency (2026/9); Ebara Environmental Plant received a Minister of the Environment award for waste and septic-tank R&D (2026/10). Social: President Hosoda paid a courtesy visit to the Governor of Kumamoto Prefecture to express thanks and support for recovery (2026/10); 'Ebara Group Health White Paper 2026' published (2026/10). IR: continued inclusion in ESG indices (2026/8); second factory tour for individual shareholders of FY2026 held (2026/11).
Three-band table (E, S, IR activities) with news-release titles and dates.
Reference list of related disclosures with dates and contents: Integrated Report 2026 business pages (2026/06/30) — targets, strategy, products, markets, market share, sites, competitors, regional mix, S&S ratio; long-term vision 'E-Vision2035' and medium-term plan 'E-Plan2028' (2026/02/13) — financial and non-financial targets, portfolio, cash allocation; IR Day 2026 sessions (2026/07/14) on the Precision & Electronics company (CMP equipment demand, hybrid Cu bonding, BS-PDN, components), the Energy company (LNG, S&S, hydrogen, ammonia, CCUS) and the Building & Industrial company (restructuring, chillers for semiconductors, cooling pumps for data centers); acquisition of Mitsubishi Electric's three-phase motor business (2025/11/13).
Three-column table: material title (underlined links), disclosure date, key points; alternating light-blue rows.
Standard disclaimer: forecasts, plans and forward-looking statements are based on information available on the release date and on assumptions about uncertain factors; actual results may differ materially.
Large grey title at upper left, centered paragraph, light-blue arc at top right, logo.
Common questions about this slide and the underlying presentation content.
The deck is in Japanese. It is Ebara Corporation's earnings presentation (決算説明会資料) for the nine months to September 2026, dated November 13, 2026, and the original was published on TDnet, the Tokyo Stock Exchange timely disclosure system. The page summaries on this page are English translations of the slide titles and key figures.
Ebara's fiscal year ends in December, so FY2026 Q3 (1-3Q) covers January to September 2026. Figures are cumulative from the first quarter and reported under IFRS.
Orders were 9,790 億円 (+43.9%), revenue 7,459 億円 (+12.4%), operating profit 835 億円 (+20.2%, margin 11.2%) and profit attributable to owners of the parent 714 億円 (+60.0%). The company says all four were record highs for a third quarter.
Orders were raised by 500 億円 to 12,950 億円 because of strong Precision & Electronics demand. Revenue (10,530 億円), operating profit (1,250 億円) and net profit (995 億円) were kept at the August 14, 2026 plan; the Energy segment's profit cut is offset by other segments.
Energy's full-year operating profit plan was cut from 180 to 130 億円 mainly because Middle East instability pushed expected service & support sales below plan. The deck also notes an operation loss at the US Jeannette plant, which it says largely ended by the first half, and expects 115 億円 of profit in Q4.
The segment dashboards (pages 10 and 14–17) fit orders, revenue, profit, margin, mix, regions and a profit bridge onto one slide. The waterfall charts (pages 7 and 22), the forecast tables (pages 20–21) and the Middle East impact table (page 27) are also strong reference layouts.
Ebara has repurchased 100 億円 of shares in FY2026 and decided on an additional buyback of up to 50 億円 (up to 1.7 million shares) from November 16 to December 31, 2026. The planned annual dividend is ¥66 per share.
Yes. Every page image was reviewed and the figures, including the dense appendix tables, are legible. Amounts are in 億円 (¥100 million) unless otherwise stated.

Create Your Own Slides
Turn your ideas into professional presentations in seconds with 2slides AI.
Reference professional designs, choose your style, and generate slides with perfect text rendering. Powered by Nano Banana—start creating your presentation now.
Your AI Agent for slides. Save time, shine faster with intelligent presentation creation.


© 2026 2slides. All rights reserved.