
Part of Investor presentation examples · Japanese investor presentation examples
Dentsu Group Q3 FY2026 Earnings Presentation - a 52-slide bilingual (Japanese/English) investor deck covering dentsu's results for the third quarter (July-September) and first nine months (January-September) of fiscal 2026, including the CEO's business and strategy update by region, consolidated P&L, regional and practice-level organic growth, operating margin, revised FY2026 organic growth guidance, cash flow, balance sheet, leverage and dentsu Japan detail. It is a Japanese-language deck (2026年度 第3四半期 決算説明会資料) with English shown alongside the Japanese on almost every slide, originally published on TDnet (Tokyo Stock Exchange timely disclosure) on November 16, 2026.
Uses this deck’s cover as a style reference for slides made from your own content. Or pick any page below to use its layout as the reference.
Quick Navigation
Tags
Share the slides
Dentsu Group Q3 FY2026 Earnings Presentation - a 52-slide bilingual (Japanese/English) investor deck covering dentsu's results for the third quarter (July-September) and first nine months (January-September) of fiscal 2026, including the CEO's business and strategy update by region, consolidated P&L, regional and practice-level organic growth, operating margin, revised FY2026 organic growth guidance, cash flow, balance sheet, leverage and dentsu Japan detail. It is a Japanese-language deck (2026年度 第3四半期 決算説明会資料) with English shown alongside the Japanese on almost every slide, originally published on TDnet (Tokyo Stock Exchange timely disclosure) on November 16, 2026.
Detailed view of each slide page, including layout, key content and visual elements.
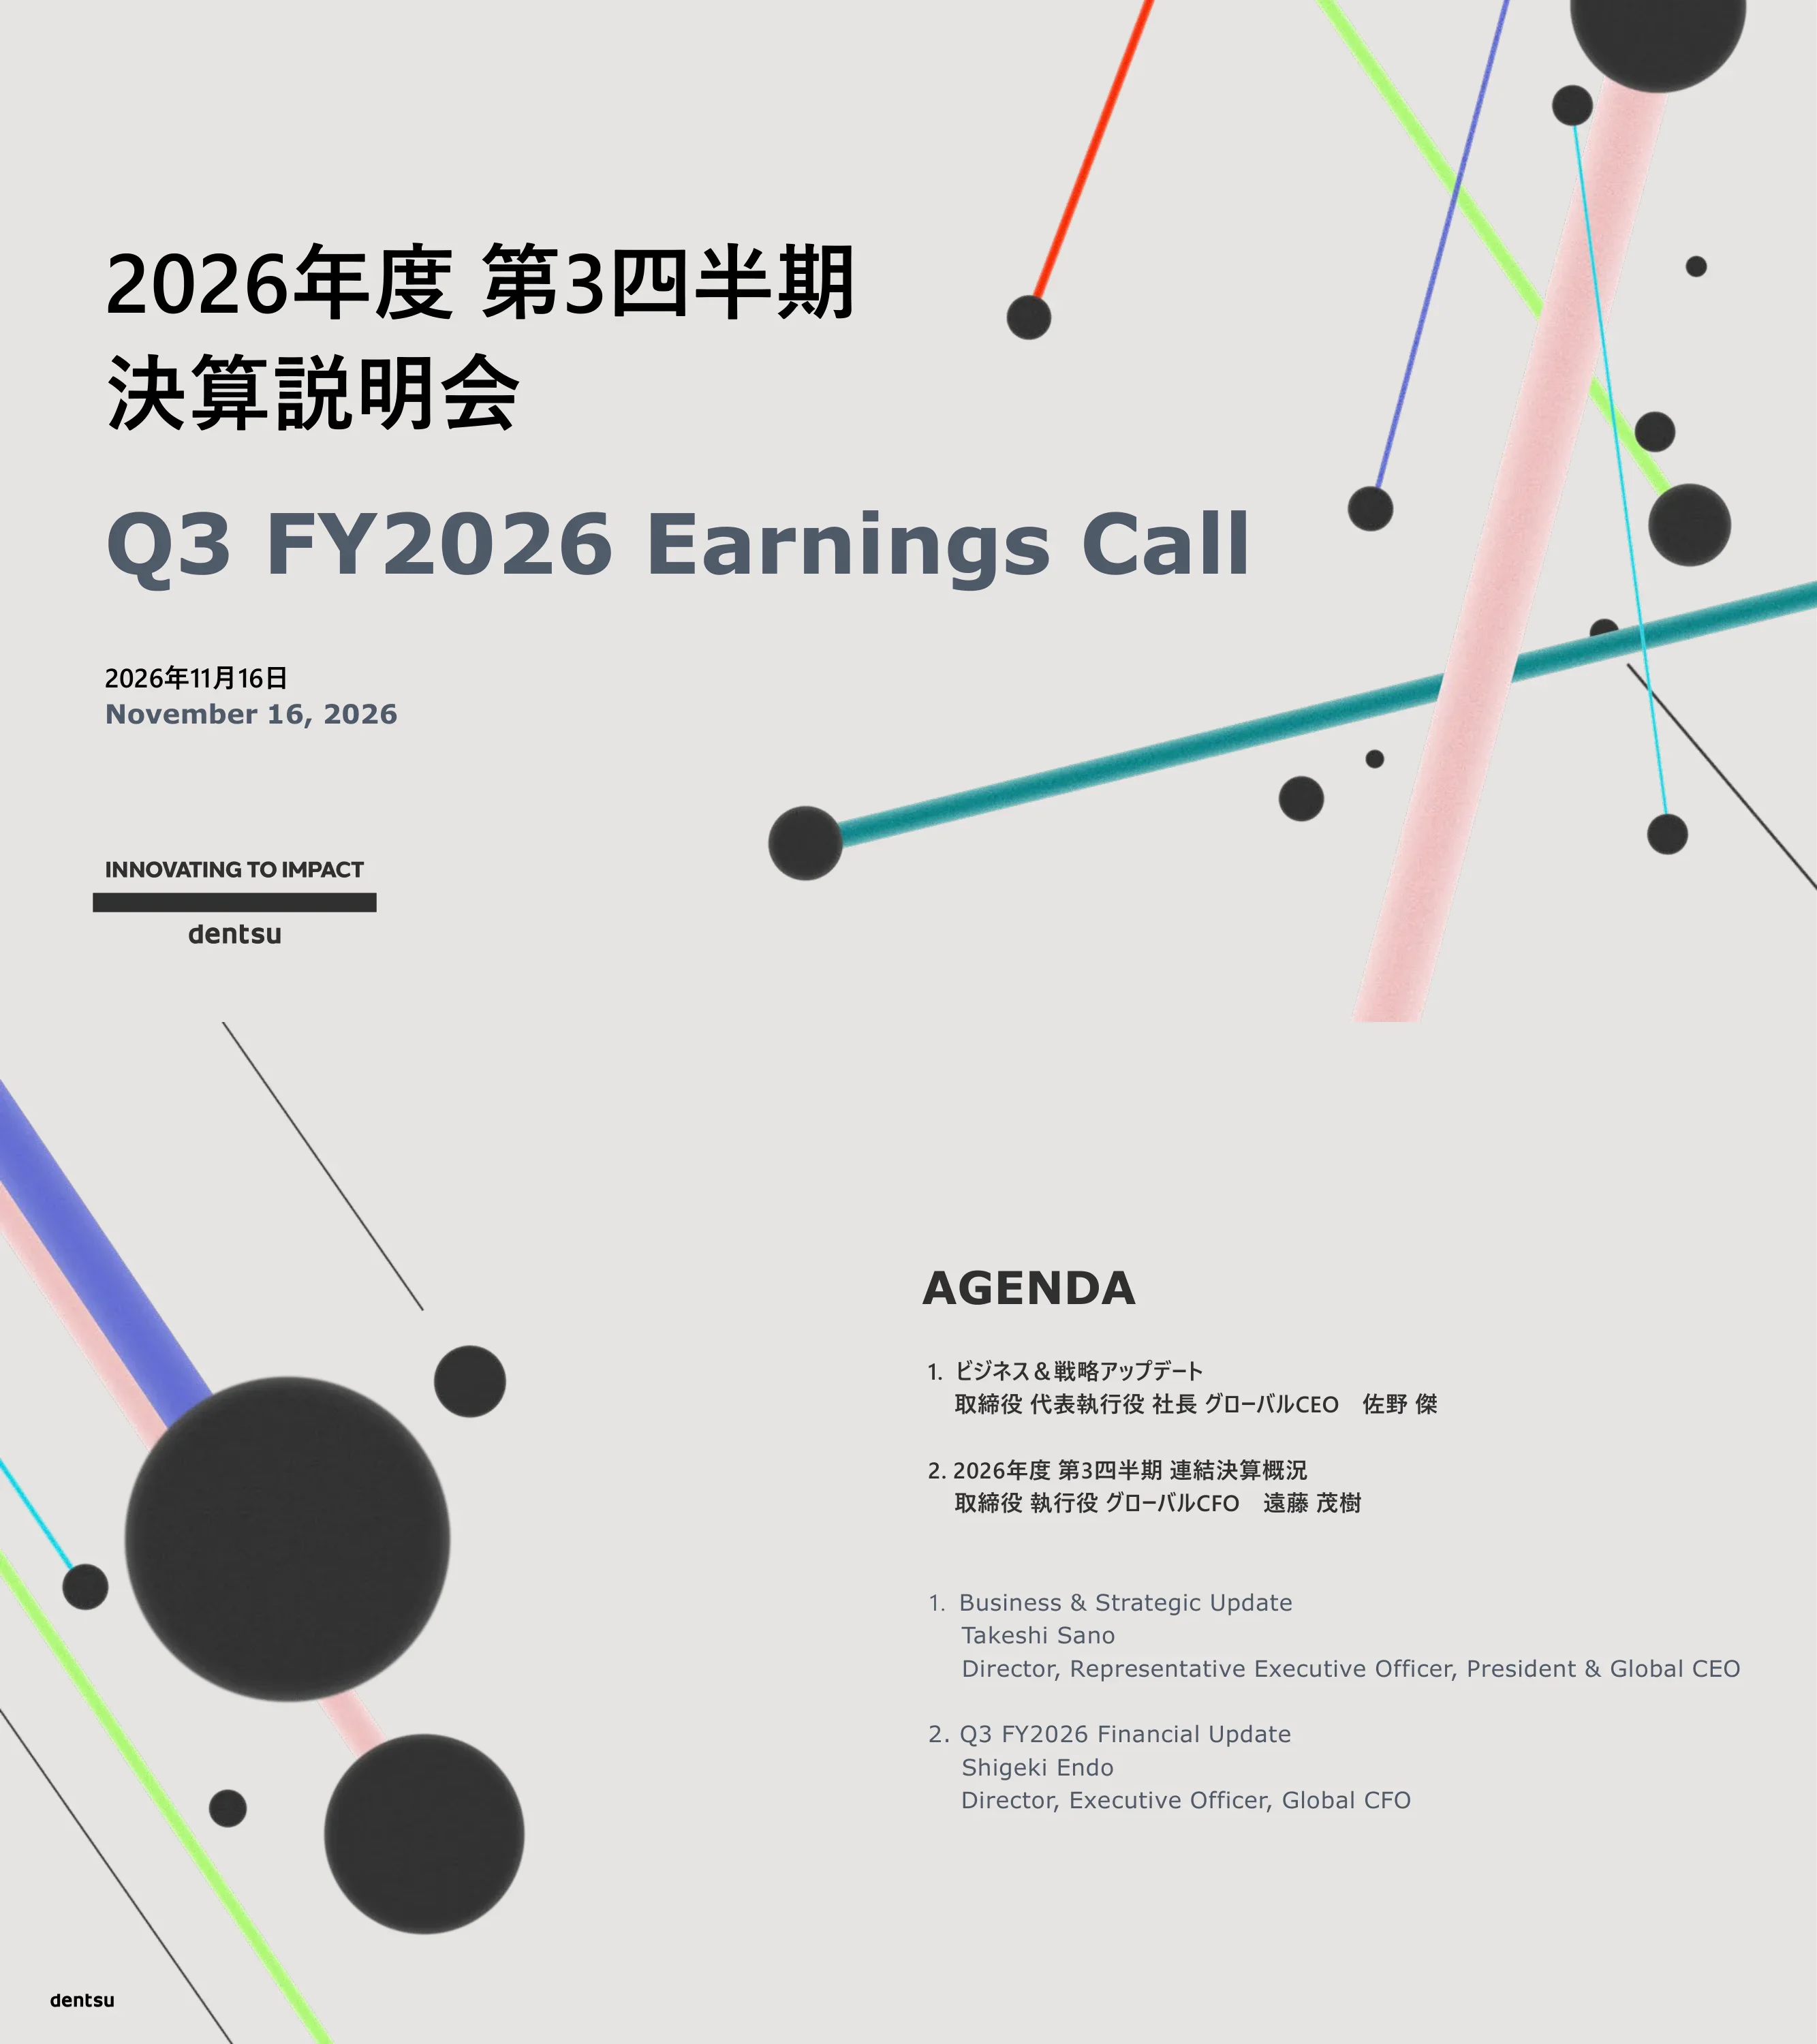
Cover slide for dentsu's Q3 FY2026 earnings call, dated November 16, 2026. Shows the Japanese and English titles and the dentsu wordmark with the tagline Innovating to Impact.
Left-aligned title block (Japanese in black, English in large slate-grey bold) with the date below; abstract 3D lines and dark spheres on a light grey background on the right; logo lockup bottom-left.
Two agenda items: 1) Business & Strategic Update presented by Takeshi Sano, Director, Representative Executive Officer, President & Global CEO; 2) Q3 FY2026 Financial Update presented by Shigeki Endo, Director, Executive Officer, Global CFO.
Abstract graphic on the left half; agenda text on the right with Japanese listing above the English listing.
Section divider for the CEO's business and strategy update, dated November 16, 2026, presented by Takeshi Sano, President & Global CEO of dentsu and CEO of dentsu Japan.
Large bilingual section title on the left with presenter details below; abstract red, blue and teal lines with spheres on the right.
Q3 group organic growth was (3.7)% (Q3 2025: +1.4%; 9M (1.0)% vs 9M 2025 +0.3%). Operating margin was 10.5%, down 450 bps YoY (9M 11.8%, down 120 bps), and statutory net profit was ¥6.8 billion, down ¥5.4 billion YoY (9M ¥53.0 billion, up ¥114.6 billion). By region, Q3 organic growth was Japan (2.4)%, Americas (6.5)%, EMEA (7.1)% and APAC +10.3%, with Q3 operating margins of 19.5%, 21.0%, 9.3% and 4.8% respectively.
Three KPI cards across the top with large teal figures; a regional table below with a teal header row (Japan, Americas, EMEA, APAC) showing Q3 and 9M organic growth and operating margin.
Awards: 12 at D&AD 2026 including Design Agency of the Year; 6 at the 2026 APAC Effie Awards (2 Gold, 1 Silver, 3 Bronze); 23 at the London International Awards including Global Design Company of the Year; 22 at MAD STARS 2026 including the Design Grand Prix and Agency of the Year. Merkle was named a Leader in the IDC MarketScape for AI-enabled Adobe professional services. Client wins listed: ServiceNow and Air India (Global), Hitachi Construction Machinery and Pan Pacific International Holdings (Japan), Great Wall Motors and DOUGLAS Group (EMEA).
Left two-thirds: row of award photos and logos above bilingual bullet points; right third: a light grey Client Wins panel listing clients with their regions.
Restoring profitability: Global HQ and the EMEA operating structure were optimized and clusters/markets simplified, with headcount reductions of about 3,400 reaching the FY2027 target early. The FY2026 plan is on track, with costs of about ¥26 billion (約260億円) and expected annual savings of about ¥42 billion (約420億円). Restoring competitiveness: about ¥7 billion (約70億円) was invested in the first nine months, mainly in Media, AI and Data & Technology, and the FY2026 investment plan was revised from about ¥14 billion to about ¥11 billion (約140億円 to 約110億円).
Two-by-two grid of rounded panels: Japanese text on the left, English on the right, for each of the two themes; footnote defining 'cluster'.
Japan's Q3 net revenue was ¥111.7 billion in 2026, against ¥120.8 billion in 2025 (including ¥6.2 billion from CARTA HOLDINGS) and ¥109.9 billion in 2024 (including ¥5.2 billion). Q3 organic growth was 2.8% (2024), 9.9% (2025) and (2.4)% (2026). Growth turned negative against the high +9.9% prior-year comparison and cautious client spending, but net revenue was the third-highest Q3 on record. Average Q3 organic growth for 2024-2026 was 3.6%, internet advertising grew turnover by double digits for the 11th consecutive quarter, and DX grew in the mid-single digits.
Left: teal column chart for 2024-2026 with an orange trend arrow and an organic growth row below; right: grey panel of bilingual bullets. A red Japan tag sits top-right.
Pitch win rates stayed above 50% in both Q3 and 9M. Three pillars: expanding across clients' value chains (about 500 AI transformation projects; AI SaaS deployed to about 50 clients; generative AI used in next-generation mobility design to speed development by up to 20x); developing growth areas (a retail media JV of 7-Eleven, Dentsu Inc. and CyberAgent; B2B support for 200+ companies in Q3); and sports & entertainment (Growth Partner of the Japan Basketball Association and Integrated Growth Partner of J.LEAGUE).
Bilingual summary banner at the top; three columns below with dark headers, each holding case cards with logos and photos.
Dentsu Group will keep a stake of about 62% in Dentsu Soken, which stays a core company of dentsu Japan, and taking it private is meant to enable faster decisions and long-term growth investment. Key synergies: DX/AI (Dentsu Soken consulting and development combined with ITOCHU's client base), IT infrastructure (Dentsu Soken solutions combined with CTC's IT infrastructure and operations), and retail media (Dentsu Inc. planning combined with Gate One in-store media and Data One purchase data).
Bordered summary box at the top with two bilingual points; chevron arrow; dark banner; three rows with teal labels (DX·AI, IT infrastructure, Retail media) and bilingual descriptions.
CXM in the Americas returned to positive quarterly organic growth for the first time since 2022, reaching 0.8% in Q3 FY2026. The line chart tracks CXM organic growth from Q1 FY2023 to Q3 FY2026; only the latest point (0.8%) is labeled and earlier values are not shown as numbers. Recovery drivers: a focus on Marketing Transformation and AI Transformation, better client retention and extra project wins, and new revenue from a wider client base.
Bilingual summary banner; bottom-left line chart under a dark header; bottom-right light teal panel listing recovery drivers. Blue Americas tag top-right.
Media was hurt by lower spend from major clients, but Q3 net new media wins turned positive. Highlights: consultative selling with data-driven B2B propositions (ranked #1 US B2B Marketing Agency and #1 Global B2B Marketing Agency in 2025 and 2026 by B2B Marketing); integrated retail proposals that won a new client; and AI transformation through an expanded ServiceNow partnership, with the global media contract extended through 2030.
Summary banner; blue Business Highlights bar; three outlined columns, each with a boxed sub-headline and bilingual description.
EMEA Media turned negative after H1 momentum because of macro uncertainty and lower spend from major clients, while new wins and growth with existing clients continued. Highlights: integrated media-led work for Netflix and DOUGLAS across 20+ European markets and selection by GWM (Great Wall Motors) as integrated market-entry partner; iProspect LLM solutions launched in France for AI search and agent visibility; and the proprietary Pipes media optimization platform used in 35+ markets with 1,700+ clients.
Summary banner; green Business Highlights bar; three outlined columns with client logos, an iProspect image and a Markets/Clients stat box.
APAC returned to positive growth in both Q3 and 9M, helped by a rebound from prior-year one-offs and investment in growth markets. Highlights: new global business with Air India and a bigger role within the Tata ecosystem; a new TSB win based on Data & Technology and Media; the launch of Dentsu Performance Studio in India, producing 1,000+ creative assets a month; and selection as a ChatGPT Ads launch partner, supporting rollout in seven markets including Southeast Asia and Taiwan.
Summary banner; purple Business Highlights bar; three outlined columns with logos and small promotional images.
dentsu published its first People & Culture Report (人的資本レポート), which shows how investing in talent and culture creates corporate value, and its Integrated Report 2026, which sets out a new growth phase built on Client-Centricity, Agility and Collaboration. The slide shows report covers, a CEO and CHRO message spread and a value-creation diagram; the small text inside those report images is not legible at this resolution.
Bilingual summary banner at the top; two collages below: People & Culture Report cover with an interview spread (left) and Integrated Report 2026 cover with a value-creation diagram (right).
Section divider for the CFO's financial update, dated November 16, 2026, presented by Shigeki Endo, Director, Executive Officer, Global CFO. A footnote says figures may differ from the financial statements because they are prepared to help investors understand the business, and points to the Appendices for definitions.
Bilingual title on the left, presenter block below, disclaimer footnote at the bottom; abstract line art on the right.
Jan-Sep 2026 vs 2025: net revenue ¥867.2 billion vs ¥851.3 billion (+1.9%); organic growth (1.0)% vs 0.3%; underlying operating profit ¥101.9 billion vs ¥111.0 billion ((8.1)%); operating margin 11.8% vs 13.0% ((120) bps). Underlying net profit was ¥53.7 billion vs ¥56.6 billion ((5.0)%) and underlying basic EPS ¥206.89 vs ¥217.88. Statutory operating profit was ¥103.6 billion vs a ¥(7.4) billion loss, statutory net profit ¥53.0 billion vs ¥(61.5) billion, and statutory basic EPS ¥204.33 vs ¥(237.04).
Full-width table with a teal header (2026 Jan-Sep, 2025 Jan-Sep, YoY); Japanese labels in the left column, English labels in the middle; key rows in teal.
9M organic growth was (1.0)% for the group: Japan +2.5%, Americas (5.5)%, EMEA (2.6)% and APAC +0.7%. Shares of 9M net revenue: Japan 40%, Americas 27%, EMEA 24%, APAC 9%. A line chart shows quarterly group organic growth from 24Q1 to 26Q3, ending at (3.7)% in 26Q3; the earlier data points carry no value labels.
World-map watermark background; top-left table of regional organic growth; bottom-left donut chart of revenue mix; right-side line chart.
Japan Q3: net revenue ¥111.7 billion ((7.5)% YoY), organic growth (2.4)%, underlying operating profit ¥21.8 billion ((26.1)%), operating margin 19.5% ((490) bps). 9M: net revenue ¥347.7 billion ((2.7)%), organic growth +2.5%, underlying operating profit ¥82.2 billion ((6.4)%), margin 23.6% ((100) bps). 9M organic growth was slightly below expectations and the margin slightly above. The Q3 decline reflects a high prior-year comparison, cautious clients and a revaluation of assets in the rights business, and growth is expected in Q4.
Top-left: 9M OG circle badge and a Japan vs Group quarterly organic growth line chart; top-right: KPI table in ¥ billion; bottom: bordered box of bilingual commentary.
Americas Q3: net revenue ¥77.6 billion (+1.1%), organic growth (6.5)% (Media (6.6)%, Creative (15.6)%, CXM +0.8%), underlying operating profit ¥16.3 billion ((14.3)%), margin 21.0% ((380) bps). 9M: net revenue ¥233.7 billion (+1.4%), organic growth (5.5)% (Media (2.5)%, Creative (17.4)%, CXM (0.7)%), underlying operating profit ¥45.7 billion ((12.7)%), margin 19.6% ((310) bps). CXM returned to growth while Media was hit by lower client spend, and staff cost control kept SG&A below the prior year.
Same template as the Japan page: OG badge plus Americas vs Group line chart on the left, KPI table with practice split on the right, commentary box below.
EMEA Q3: net revenue ¥66.7 billion ((0.5)%), organic growth (7.1)% (Media (9.8)%, Creative (2.2)%, CXM (2.2)%), underlying operating profit ¥6.2 billion ((32.7)%), margin 9.3% ((440) bps). 9M: net revenue ¥204.6 billion (+8.7%), organic growth (2.6)% (Media (1.9)%, Creative (3.3)%, CXM (4.0)%), underlying operating profit ¥18.3 billion (+23.1%), margin 9.0% (+110 bps). The Q3 Media decline reflects prior-year UK one-offs, client losses and delayed spending amid geopolitical uncertainty.
Regional template: OG badge and EMEA vs Group line chart on the left, KPI table on the right, bilingual commentary box below.
APAC Q3: net revenue ¥26.7 billion (+15.4%), organic growth +10.3% (Media (3.5)%, Creative +53.5%, CXM (22.0)%), underlying operating profit ¥1.3 billion, margin 4.8%. 9M: net revenue ¥76.3 billion (+8.5%), organic growth +0.7% (Media (2.6)%, Creative +13.0%, CXM (19.8)%), underlying operating loss ¥(1.9) billion, margin (2.5)%. Q3 Creative growth reflects a rebound from prior-year one-offs and growth in India, and Q3 turned to an underlying operating profit.
Regional template: OG badge and APAC vs Group line chart (Q3 spike labeled +10.3%) on the left, KPI table on the right, commentary box below.
Waterfall bridge from 9M 2025 underlying operating profit of ¥111.0 billion to ¥101.9 billion in 9M 2026: change in net revenue (28.1), staff cost +21.6, other operating expenses (8.1), depreciation +3.9 and currency +1.7 (¥ billion).
Full-width waterfall chart with teal start and end bars, grey decreases and dark slate increases; bilingual category labels under the axis.
Organic growth guidance was changed from 0-1% to about (1)%, and the rest of the forecast table is unchanged from February. FY2026 forecasts vs FY2025 actuals: revenue ¥1,491.5 billion (vs ¥1,435.2 billion), net revenue ¥1,230.2 billion (vs ¥1,197.5 billion), underlying operating profit ¥166.3 billion (vs ¥172.5 billion), operating margin in the 13% range (vs 14.4%), underlying net profit ¥85.2 billion (vs ¥93.5 billion), underlying basic EPS ¥328.21 (vs ¥360.38), dividend per share not shown (-), statutory operating profit ¥152.6 billion (vs ¥(289.2) billion) and statutory net profit ¥69.7 billion (vs ¥(327.6) billion). Regional organic growth outlook: Japan 3%+, Americas (6)-(5)%, EMEA c. (2)%, APAC c. 1%; the Americas and EMEA figures were updated from August. FX assumptions: JPY/USD ¥156.7, JPY/GBP ¥211.9.
Bold bilingual headline; main guidance table with a teal header; currency table below; a bordered regional breakdown box on the right.
Divider slide that introduces the appendix section of detailed financial tables, footnotes, disclaimers and definitions.
Large APPENDICES title on the right; cyan and teal diagonal bands with dark spheres on the left.
Jan-Sep 2026: turnover ¥4,864.9 billion (+7.4%), revenue ¥1,067.6 billion (+5.3%), net revenue ¥867.2 billion (+1.9%; (3.1)% at constant currency). Net revenue by region: Japan ¥347.7 billion, Americas ¥233.7 billion, EMEA ¥204.6 billion, APAC ¥76.3 billion. Underlying operating profit ¥101.9 billion ((8.1)%; (9.9)% at constant currency), margin 11.8%, underlying net profit ¥53.7 billion, underlying EPS ¥206.89, statutory operating profit ¥103.6 billion, statutory net profit ¥53.0 billion and underlying EBITDA ¥109.8 billion ((7.1)%). Average FX: JPY/USD ¥158.5 (vs ¥148.0), JPY/GBP ¥213.2 (vs ¥194.6).
Large data table with a teal header including a constant currency column; smaller currency table below.
Q3 (Jul-Sep) 2026: turnover ¥1,570.0 billion (+0.9%), revenue ¥350.2 billion (+6.0%), net revenue ¥284.1 billion ((1.8)%), underlying operating profit ¥29.9 billion ((31.1)%), margin 10.5% ((450) bps), underlying net profit ¥15.5 billion ((35.8)%), statutory operating profit ¥19.7 billion, statutory net profit ¥6.8 billion and underlying EBITDA ¥32.6 billion. Q2 net revenue was ¥288.0 billion and Q1 ¥295.1 billion, with operating margins of 11.9% and 12.8%.
Wide table with three quarter columns (Jul-Sep, Apr-Jun, Jan-Mar 2026), each paired with a YoY column; regional net revenue sub-rows.
Group quarterly organic growth in 2026: Q1 +0.8%, Q2 (0.2)%, Q3 (3.7)%, YTD (1.0)% (2025 full year +0.5%; 2024 (0.1)%). 2026 YTD by region: Japan +2.5%, Americas (5.5)%, EMEA (2.6)%, APAC +0.7%. In Q3 2026, Japan was (2.4)%, Americas (6.5)%, EMEA (7.1)% and APAC +10.3%.
Two stacked tables: group consolidated by quarter for 2024-2026 on top; regional breakdown by quarter and year below.
Group operating margin in 2026: Q1 12.8%, Q2 11.9%, Q3 10.5%, YTD 11.8% (2025: Q3 15.0%, full year 14.4%; 2024 full year 14.8%). 2026 YTD margins by region: Japan 23.6%, Americas 19.6%, EMEA 9.0%, APAC (2.5)%. The Q3 2026 regional margins were 19.5%, 21.0%, 9.3% and 4.8%.
Same two-table layout as the organic growth appendix: group consolidated on top, regional matrix below.
Quarterly organic growth by practice (Media, Creative, CXM) for the Americas, EMEA and APAC for FY2024-FY2026. FY2026 YTD: Americas Media (2.5)%, Creative (17.4)%, CXM (0.7)%; EMEA Media (1.9)%, Creative (3.3)%, CXM (4.0)%; APAC Media (2.6)%, Creative +13.0%, CXM (19.8)%. Stacked bars show the net revenue mix for Jan-Sep 2026: Americas 48% Media, 21% Creative, 31% CXM; EMEA 63%, 13%, 24%; APAC 56%, 36%, 8%.
Three stacked yearly tables on the left (FY2024, FY2025, FY2026); two stacked bar charts on the right for the 2025 full year and Jan-Sep 2026.
Jul-Sep 2026 organic growth bands. 5% or more: India, Netherlands, Poland, Spain. 0-5%: Denmark, France, Norway, Sweden. (10)% to 0%: Australia, Canada, China, Japan, Taiwan, USA. Below (10)%: Germany, Italy, Singapore, Switzerland, Thailand, UK.
Two-column table: growth band on the left (grey cells), market names in Japanese and English on the right.
Jan-Sep 2026 organic growth bands. 5% or more: India, Poland, Spain. 0-5%: Denmark, France, Japan, Netherlands. (10)% to 0%: Canada, China, Italy, Norway, Singapore, Sweden, Switzerland, Taiwan, Thailand, UK, USA. Below (10)%: Australia, Germany.
Same two-column band table as the Q3 version.
Jan-Sep 2026 net revenue: Japan ¥347.7 billion, Americas ¥233.7 billion, EMEA ¥204.6 billion, APAC ¥76.3 billion; total ¥862.3 billion plus eliminations of ¥4.9 billion gives ¥867.2 billion consolidated. Underlying operating profit: 82.2, 45.7, 18.3 and (1.9), with central costs of (42.4), for ¥101.9 billion consolidated. Operating margins: 23.6%, 19.6%, 9.0%, (2.5)%, 11.8% consolidated. 2025 comparatives: consolidated net revenue ¥851.3 billion, underlying operating profit ¥111.0 billion, margin 13.0%.
Two stacked segment tables (2026 and 2025 Jan-Sep) with columns for each region, total, eliminations/central costs and consolidated.
Waterfall from 9M 2025 net revenue of ¥851.3 billion to ¥867.2 billion in 9M 2026: organic (9.1), acquisitions (19.0) and currency +43.9 (¥ billion). Currency tailwinds more than offset the organic decline and the net effect of disposals.
Waterfall chart with teal endpoint bars and thin intermediate bars; bilingual axis labels.
Repeats the underlying operating profit bridge in the appendix: ¥111.0 billion (9M 2025) less net revenue change (28.1), plus staff cost +21.6, less other operating expenses (8.1), plus depreciation +3.9 and currency +1.7, giving ¥101.9 billion (9M 2026).
Full-width waterfall chart, same as page 22.
Jan-Sep 2026: net revenue ¥867.2 billion; staff cost ¥585.8 billion (67.6% of net revenue, (3.6)% YoY at constant currency); other operating expenses ¥152.2 billion (17.6%, +5.6%); depreciation ¥27.8 billion (3.2%, (12.3)%). Net revenue was (3.1)% YoY at constant currency.
Compact table in the upper-left with a teal header and three rows (amount, ratio to net revenue, YoY at constant currency); the rest of the slide is white space.
Underlying operating profit of ¥101.9 billion plus adjustment items of ¥1.6 billion gives statutory operating profit of ¥103.6 billion (2025: ¥111.0 billion and (118.4), giving ¥(7.4) billion). Adjustments: amortization of purchased intangibles (18.2), acquisition costs (0.1) and one-off items +19.9, which include a gain on sale or retirement of non-current assets of +29.6, business transformation cost (17.6), no impairment (2025: (86.6)) and others +8.0.
Reconciliation table with indented sub-items and shaded top and bottom total rows.
Underlying net profit of ¥53.7 billion plus adjustments of (0.7) gives statutory net profit of ¥53.0 billion (2025: ¥56.6 billion less (118.1), giving ¥(61.5) billion). Components: operating profit adjustments +1.6, revaluation of earnout and M&A put-option liabilities +0.2, related income tax (2.6), non-controlling interest adjustments +0.2, others 0.0.
Reconciliation table in the same style as the previous slide.
Statutory operating profit ¥103.6 billion, plus share of results of associates ¥3.8 billion, gives profit before interest and tax of ¥107.4 billion. Net finance costs of (14.0) (finance income 6.5, finance costs 20.5) give profit before tax of ¥93.4 billion, and after income tax of ¥33.6 billion net profit is ¥59.7 billion. Of that, ¥53.0 billion is attributable to owners of the parent and ¥6.7 billion to non-controlling interests (2025: ¥(55.6) billion total).
Full-width P&L table with alternating shaded subtotal rows and YoY columns.
Jan-Sep 2026: underlying operating profit ¥101.9 billion, business transformation cost spent (21.9), cash flow before working capital ¥115.0 billion, change in working capital (19.6) (vs (77.3)), cash flows from operations ¥95.4 billion (vs ¥57.0 billion), and net cash flows from operating activities ¥49.3 billion (vs ¥10.6 billion). Capital spend +9.9, acquisitions and disposals (14.0), lease repayments (26.9), gross cash flow (4.5) (vs (55.9)), no dividends paid (vs (18.1)), and transfer to assets held for sale +17.5. Net debt changed by +5.2 (vs (102.6)).
Long dense table with a teal header and three numeric columns (2026, 2025, YoY); subtotal rows shaded grey.
End of September 2026 vs end of December 2025: goodwill ¥319.2 billion (320.1), intangibles ¥160.9 billion (178.2), PPE ¥23.7 billion, right-of-use assets net of lease liabilities (77.5), equity instruments ¥76.8 billion, net working capital ¥38.8 billion (22.9), net debt (167.9) vs (173.1), M&A-related debt (3.8), others ¥116.9 billion. Net assets were ¥487.1 billion (+8.7%), with owners' interests ¥427.3 billion and non-controlling interests ¥59.9 billion. Period-end FX: JPY/USD ¥157.3, JPY/GBP ¥208.6.
Balance sheet summary table with variance and variance % columns, plus currency rows at the bottom.
At end-September 2026, total debt was ¥(461.1) billion (vs ¥(502.8) billion a year earlier), cash and cash equivalents ¥293.3 billion (vs ¥225.0 billion), and net debt ¥(167.9) billion (vs ¥(277.9) billion). Underlying EBITDA (LTM) was ¥173.8 billion vs ¥201.0 billion.
Small table in the upper-left of a mostly blank slide with a teal header for the two year-end columns.
dentsu Japan net revenue by company for Jan-Sep 2026: DENTSU Inc. ¥165.6 billion (+0.4%), Dentsu Soken ¥48.0 billion (+9.6%), Dentsu Digital ¥37.5 billion (+9.3%), SEPTENI HOLDINGS ¥20.2 billion (+7.6%), Dentsu Promotion ¥11.0 billion ((6.7)%, excluding Dentsu Tempo), Dentsu Live ¥5.3 billion ((30.0)%), others ¥60.1 billion ((21.2)%). Total net revenue was ¥347.7 billion ((2.7)%), underlying operating profit ¥82.2 billion ((6.4)%) and margin 23.6% ((100) bps). Revenue mix bar: 48%, 14%, 11%, 6%, 3%, 2% and 17%.
Table with color swatches for each company; a horizontal 100% stacked bar of net revenue mix below.
Jan-Sep 2026 dentsu Japan turnover was ¥1,526.3 billion (+2.7%), of which Q3 was ¥504.5 billion (+0.3%). By category (9M): television ¥428.5 billion (+2.4%; Q3 (5.8)%), internet ¥368.8 billion (+15.2%), OOH ¥41.1 billion (+25.8%), creative ¥167.1 billion (+5.6%), marketing/promotion ¥169.8 billion ((6.5)%), content services ¥119.7 billion (+18.0%), newspapers ¥28.7 billion ((5.0)%), magazines ¥7.7 billion ((13.2)%), radio ¥9.3 billion (+7.9%). The wider internet domain was ¥460.7 billion (+12.3%). Footnotes explain the pro forma treatment excluding CARTA HD and the Japan GAAP basis.
Wide table with four period columns (9M, Q3, Q2, Q1), each with a YoY column; dense bilingual footnotes at the bottom.
Dentsu Inc. Jan-Sep 2026 turnover was ¥1,057.9 billion (+6.9%), with Q3 at ¥350.7 billion (+2.6%). Largest client industries (9M): information/telecom/mass media/software ¥157.3 billion (14.9%, +38.8%), food/beverages/tobacco ¥151.4 billion (14.3%, (2.2)%), food services/other consumer services ¥132.9 billion (12.6%, +11.4%), household/personal products ¥114.7 billion (10.8%), finance/insurance ¥99.9 billion (+10.3%). Pharmaceuticals fell (14.8)% and automobiles (9.2)%.
Wide industry table with ratio and YoY columns for 9M and each quarter.
Group turnover by client industry (covering about 90% of international businesses and all of Dentsu Inc.) for Jan-Sep 2026 was ¥4,147.2 billion (+12.8%), with Q3 at ¥1,352.8 billion (+3.8%). Largest categories: household/personal products ¥647.6 billion (15.6%, +13.7%), food/beverages/tobacco ¥574.1 billion (13.8%, +4.6%), information/telecom/mass media/software ¥536.2 billion (12.9%, +18.1%), distribution/retailing ¥528.0 billion (12.7%, +24.1%), food services/consumer services ¥384.8 billion (9.3%). Jan-Mar figures were revised from the Q1 announcement.
Same industry table template as the previous page, with three footnotes.
Average Jan-Sep 2026 rates (vs 2025): JPY/USD ¥158.5 (148.0), JPY/EUR ¥184.0 (165.5), JPY/GBP ¥213.2 (194.6), JPY/INR ¥1.7 (1.7), JPY/CNY ¥23.2 (20.5). Period-end September 2026: USD ¥157.3, EUR ¥178.3, GBP ¥208.6, INR ¥1.6, CNY ¥23.5. Net revenue by currency: JPY 40.1%, USD 23.6%, EUR 11.1%, GBP 7.1%, INR 2.0%, CNY 1.7%, others 14.4%.
Upper table of average and period-end rates; lower single-row table of net revenue share by currency.
Japanese footnotes for slides 16/23, 25/26, 27-29, 37 and 41: net profit and EPS figures are attributable to owners of the parent; definition of underlying EBITDA; Russia is excluded from 2024 onward; total debt excludes lease liabilities of 1,888億円 (¥100 million units) at end-Sep 2026 and 1,914億円 at end-Sep 2025.
Text-only slide with slide references in a left column and explanatory notes on the right.
English version of the footnotes: net profit and EPS are after attribution to non-controlling interests; underlying EBITDA excludes IFRS 16 depreciation adjustments; Russia results are excluded from 2024 onwards; total debt is loans plus bonds, excluding lease liabilities of ¥188.8 billion (Sep 30, 2026) and ¥191.4 billion (Sep 30, 2025).
Text-only two-column footnote layout matching the Japanese page.
Japanese forward-looking statements disclaimer, a note that IFRS 16 Leases has applied since January 1, 2019 under the modified retrospective approach, and a list of 12 key risks: competitiveness/long-term strategy, business transformation, sustainability targets, talent, enterprise technology, cyber security, data governance, corporate culture, compliance, litigation, economic cycles and disasters/geopolitics.
Dense text slide with bullet paragraphs and a numbered risk list.
English forward-looking statements disclaimer: actual results may differ materially, the IFRS 16 note says past results are not restated, and the same 12 risk factors are listed. Dentsu Group disclaims any obligation to update the statements except as required by law.
Text-only slide with bullets and a numbered list.
Japanese definitions of the KPIs used in the deck: turnover, underlying operating profit, M&A-related items, one-off items, operating margin, underlying net profit, underlying basic EPS, payout ratio, underlying EBITDA, constant currency basis, currency impact, M&A growth, organic growth, net working capital and net debt.
Glossary layout with square bullets, terms on the left and definitions on the right.
English glossary. Operating margin is underlying operating profit divided by net revenue. Organic growth is constant-currency YoY growth after adjusting for businesses acquired or disposed of since the start of the prior year. Net debt is total debt less cash and cash equivalents. Underlying EBITDA is underlying operating profit before depreciation and amortization, excluding IFRS 16 effects.
Text-only glossary with square bullets.
Common questions about this slide and the underlying presentation content.
It is the Japanese 決算説明会資料 (2026年度 第3四半期 決算説明会資料) for Dentsu Group's Q3 FY2026 earnings call, with an English translation next to the Japanese on almost every slide. It was originally released on November 16, 2026 through TDnet, the Tokyo Stock Exchange's timely disclosure system.
Dentsu's fiscal year is the calendar year. Q3 FY2026 is July-September 2026, and the cumulative nine-month (9M) figures cover January-September 2026.
Group organic growth was (3.7)% in Q3, the operating margin was 10.5% (down 450 bps YoY) and statutory net profit was ¥6.8 billion. For the nine months, net revenue was ¥867.2 billion (+1.9%), underlying operating profit ¥101.9 billion ((8.1)%) and statutory net profit ¥53.0 billion.
Yes. Organic growth guidance was cut from 0-1% to about (1)%. The rest of the forecast table, including net revenue of ¥1,230.2 billion and underlying operating profit of ¥166.3 billion, is unchanged from February. Regional outlooks: Japan 3%+, Americas (6)-(5)%, EMEA c. (2)%, APAC c. 1%.
Q3 organic growth was Japan (2.4)%, Americas (6.5)%, EMEA (7.1)% and APAC +10.3%. Q3 operating margins were 19.5%, 21.0%, 9.3% and 4.8% respectively.
Restructuring: headcount reductions of about 3,400 were reached ahead of the FY2027 target, and annual savings of about ¥42 billion are expected. Strategic news includes the Dentsu Soken JV with ITOCHU Group (dentsu keeps about 62%), a 7-Eleven/Dentsu/CyberAgent retail media JV, the Americas CXM return to growth, selection as a ChatGPT Ads launch partner in APAC, and the first People & Culture Report.
The appendix has the consolidated results, quarterly results, quarterly organic growth and margin by region since 2024, organic growth by practice, market-level growth bands, segment information, revenue and profit bridges, an SG&A breakdown, profit reconciliations, cash flow, financial position, leverage, dentsu Japan results by company, turnover by media and by industry, FX rates, a disclaimer and KPI definitions.
It is a clean corporate template on a white or light grey background, with teal table headers, Japanese titles in black above English titles in slate grey, color-coded region tags (red for Japan, blue for the Americas, green for EMEA, purple for APAC) and abstract line-and-sphere art on the divider slides.

Create Your Own Slides
Turn your ideas into professional presentations in seconds with 2slides AI.
Reference professional designs, choose your style, and generate slides with perfect text rendering. Powered by Nano Banana—start creating your presentation now.
Your AI Agent for slides. Save time, shine faster with intelligent presentation creation.


© 2026 2slides. All rights reserved.