
Part of Investor presentation examples
Credicorp Strategic Update 2026: Scaling our Ecosystem Advantage - investor day presentation from Credicorp Ltd (NYSE: BAP), Peru's largest financial services group, filed with the SEC as an exhibit to Form 6-K on 17 November 2026
Uses this deck’s cover as a style reference for slides made from your own content. Or pick any page below to use its layout as the reference.
Quick Navigation
Tags
Share the slides
Credicorp Strategic Update 2026: Scaling our Ecosystem Advantage - investor day presentation from Credicorp Ltd (NYSE: BAP), Peru's largest financial services group, filed with the SEC as an exhibit to Form 6-K on 17 November 2026
Detailed view of each slide page, including layout, key content and visual elements.
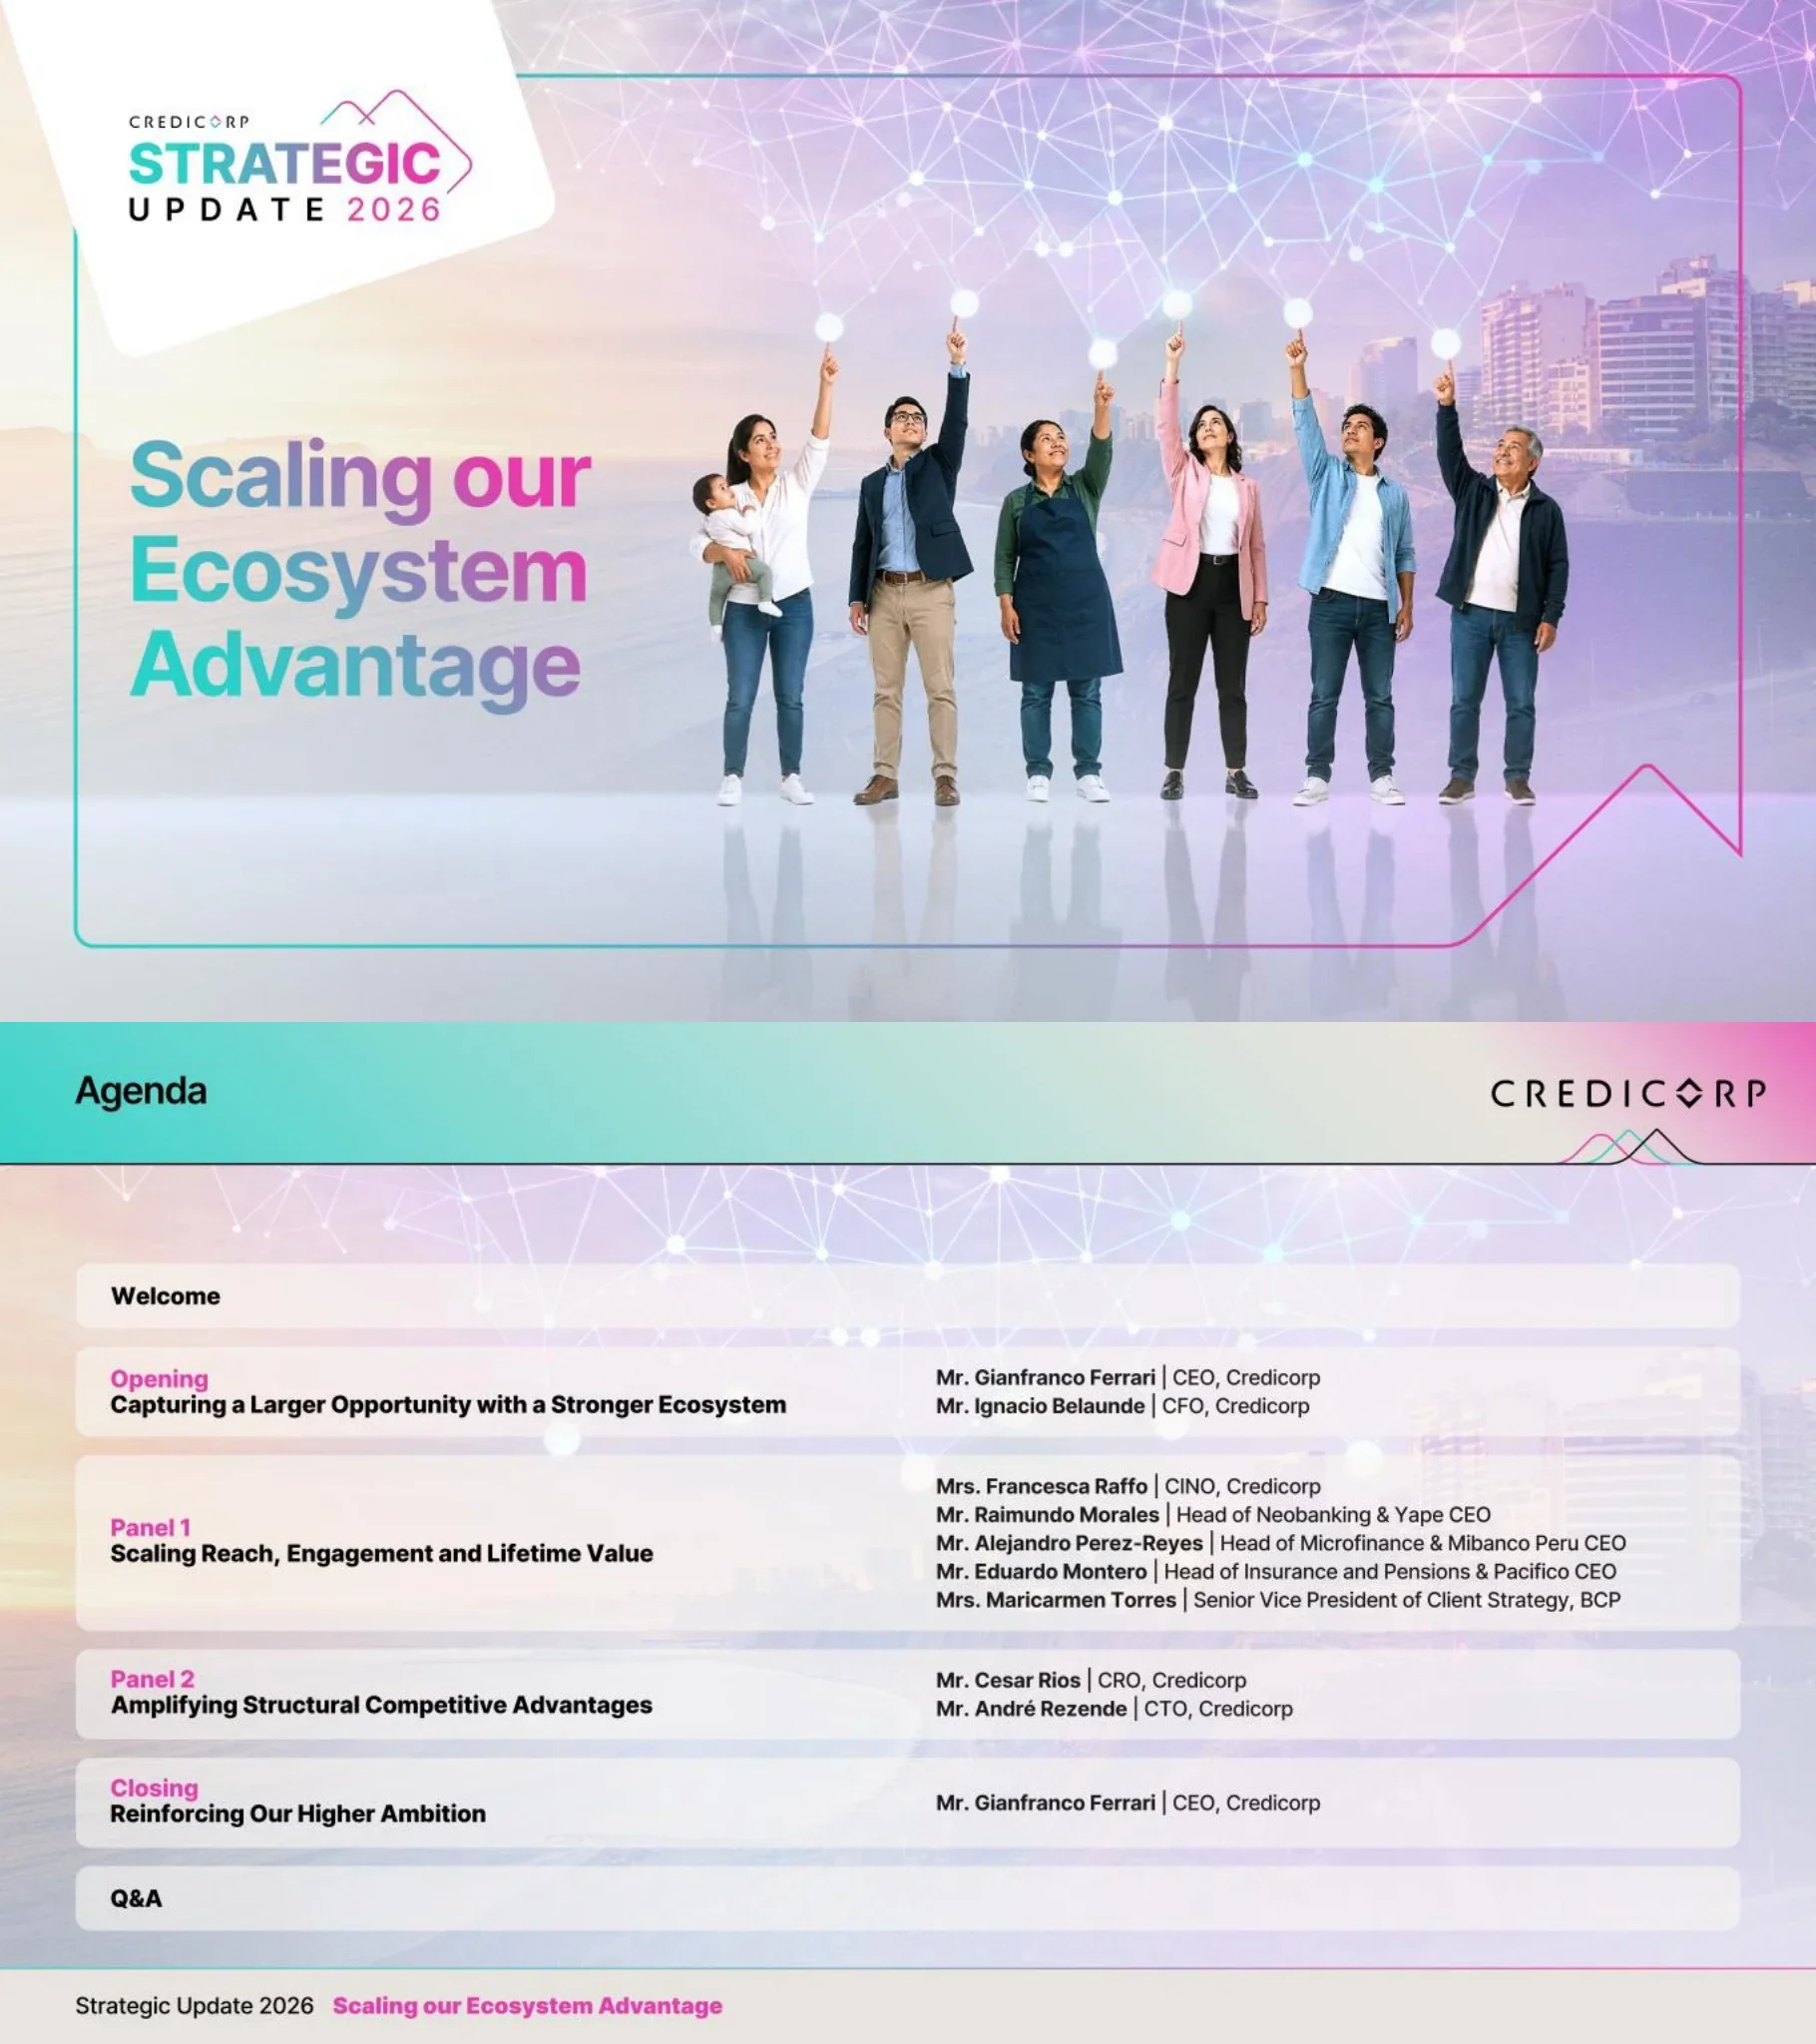
The cover of the Credicorp Strategic Update 2026 carries the headline 'Scaling our Ecosystem Advantage' in a teal-to-magenta gradient. Six diverse people point upward toward a glowing network of connected nodes over a Lima coastline, signalling a connected ecosystem serving many types of customers.
Full-bleed photographic background with a tilted white logo card at top left, large gradient headline on the left and a group photo at right, framed by a thin teal-to-pink outline.
The agenda lists Welcome, an Opening ('Capturing a Larger Opportunity with a Stronger Ecosystem') by CEO Gianfranco Ferrari and CFO Ignacio Belaunde, and Panel 1 ('Scaling Reach, Engagement and Lifetime Value') with five speakers including Yape and Mibanco Peru leaders. Panel 2 ('Amplifying Structural Competitive Advantages') features CRO Cesar Rios and CTO Andre Rezende, followed by a Closing by the CEO and Q&A.
Header band with title and logo; six rounded rows with section names in pink and bold on the left and speaker names and titles on the right.
A dense cautionary note on forward-looking statements, referencing Section 27A of the U.S. Securities Act of 1933 and Section 21E of the Exchange Act of 1934. It bulleted risk factors including political and regulatory conditions in Peru, Sol/US Dollar exchange rate, loan portfolio quality, competition, cybersecurity and changes in Bermuda laws, and refers readers to Item 3.D Risk Factors in the Form 20-F.
Single large text card with a bold heading, paragraphs and a bulleted risk list, under the standard header and footer.
Section divider titled 'Opening: Capturing a Larger Opportunity with a Stronger Ecosystem'. It introduces Gianfranco Ferrari (Chief Executive Officer) and Ignacio Belaunde (Chief Financial Officer) with headshots.
Cover-style background with logo card top left, centered pink label and black title, two framed portrait photos with names and roles below.
Two bar charts compare Peru with peers. GDP growth (2026 vs 2024 CAGR) shows Peru at 3.4% against 2.4% for Latam and 2.0% for advanced economies. Financial penetration (loans to GDP, 2025) shows Peru at 35% versus Colombia 41%, Bolivia 51%, Ecuador 58% and Chile 85%.
Two side-by-side chart cards with Peru highlighted in magenta against teal and grey bars; footnote with IMF and World Bank sources.
A hub-and-spoke graphic shows Credicorp at the center of a 'leading integrated ecosystem' with BCP, Yape, Mibanco, Pacifico Seguros, Krealo, Credicorp Capital, Prima AFP and Pacifico Salud. On the right, 'scalable shared capabilities' (technology platforms, data and analytics, AI, risks and cybersecurity) are paired with 'disciplined execution' (prudent risk management, capital discipline, proven track record, innovation mindset).
Two cards: left a radial ecosystem diagram with circular logos around a gradient hub; right two rows of four icon tiles in teal and pink.
For BCP plus Yape, total clients grew from 11 million in 2021 to 21 million in Sep26, with digital clients rising from 46% to 81% of total and cost to serve down 34%. Active lending clients grew from 1 million to 4 million, lifting active lending clients as a share of total clients from 9% to 19%. The tiny footnotes define digital clients (70% or more of transactions via digital channels in the last 6 months) and cost to serve (9M26 annualized vs 2021).
Two chart cards with paired bars and percentage badges above; a highlighted magenta -34% badge and a long source footnote at the bottom.
Four value creation engines are named: growth in core businesses, innovation portfolio, ecosystem monetization and operating leverage. A line chart (2019-2029) shows operating income rising faster than operating expense, with an innovation portfolio breakeven marked around 2026. Mid-term ambitions are ~22% ROE and an efficiency ratio below 42%, with risk-adjusted NIM, non-interest income and operating leverage as key drivers.
Top strip of four icons, then three panels: a phased area/line chart, a driver list with arrows, and large ambition numbers.
Divider for Panel 1, 'Scaling Reach, Engagement and Lifetime Value'. Panelists shown are Francesca Raffo (CINO), Alejandro Perez-Reyes (Head of Microfinance and Mibanco Peru CEO), Raimundo Morales (Head of Neobanking and Yape CEO), Eduardo Montero (Head of Insurance and Pensions and Pacifico CEO) and Maricarmen Torres (SVP of Client Strategy, BCP).
Cover-style background with a centered title and a row of five framed portraits with names and roles.
A four-row scorecard compares 2021 with Sep 2026: Yape monthly active users 4.5 to 17.0 million (3.8x), BCP mass-market net income contribution 6% to 21% (3.5x), Mibanco digital transactions 6% to 45% (7.5x) and Pacifico bancassurance contribution 26% to 35% (1.3x). Footnotes define each metric.
Rows with brand logo at left, metric name, teal 2021 box, chevron arrows, magenta Sep 2026 box and a colored circle multiplier with arrow.
A stacked area chart of active lending clients (millions, 2016 to Sep 26) shows BCP's total reaching 4.3 million, of which Yape accounts for 3.2 million. Callouts state pre-approved clients grew from 2 million to 10 million since 2023, and there are more than 6 million cumulative borrowers.
Left chart card with teal and magenta areas; right two stacked highlight boxes, one outlined and one gradient-filled.
Mass-market accounts for ~50% of BCP's annual profit YoY growth as of Sep26. Growth across the three value pools since 2019 is shown as ~3x loan portfolio, ~2x deposits balance and ~2x fees. Two cohort line charts (cross-selling per customer and monthly fee transactions per customer) show newer cohorts reaching higher value earlier; the axis labels are very small and only partly legible.
Left column with a big-number card and a gradient strip of three circles; right panel with two multi-line cohort charts.
Mibanco's monthly active users rose from 47 thousand (Jun 23) to 141 thousand (Sep 26), while the share of digital transactions climbed from 12% to 45%, labeled ~4x in 2 years. Digital transactions went from ~163 thousand (Jan-24) to ~915 thousand (Sep-26, 5.6x), non-financial income from 129 (2024) to 206 (2026E) million (1.6x), and retail deposits from 40% to 50% of total liabilities (+10pp). The currency for non-financial income is not printed on the slide.
Left combined bar-and-line chart; right three outlined rows with before/after values and circular multiplier badges.
A two-way diagram links Credicorp (customers and distribution) with Pacifico (protection expertise). Retail market share rose from 25.5% (2022) to 27.7% (Aug26), +220 bps, and insured customers grew from 4.7 million to 7.4 million (~1.6x).
Left crossing-arrow diagram between two outlined boxes; right gradient card with two before/after KPI blocks and white highlight pills.
An illustrative area chart (2022-2031) shows the innovation portfolio going from ~10% of risk-adjusted revenues today toward 30%, with next-wave initiatives at 10%. A note states that Yape continues scaling its monetization, growing over 30% YoY in risk-adjusted revenue; the chart is split between Actual and Illustrative at 2026.
One large chart card with a dashed 2026 divider, layered magenta and teal areas and right-aligned labels.
Monthly revenue-generating transactions per MAU rose from 1.5 (2022) to 5.0 (2024) and 7.5 (Sep 26), a 5x increase, with a 2029 ambition bar that carries no printed value. Lending clients reach 6.3 million cumulative borrowers and 3.2 million active in Sep 26, versus a 2029 ambition of 9.0 million and 4.5 million. A callout cites average tickets of S/440 for Yape versus S/20,000 for BCP mass-market (S/ is Peruvian soles).
Two chart cards on top and three outlined callout boxes with peaked tops below.
A six-step customer journey runs from payments to savings, recurring services, credit, insurance and investments. Principal customers and customers with 3 or more products are each shown as ~3x (variation 2023 to 2026). Loan penetration is 20% in 2026 with a 2x ambition for 2029, and health insurance penetration is 3% with a 3x 2029 ambition.
Top horizontal journey of six colored circles with chevrons; bottom two outlined panels labeled 'The model is proven' and 'The largest opportunity is still ahead'.
WhatsApp banking is presented as a key growth channel, with four trend charts for its first 8 months: onboarded customers reaching 21.0 thousand by August, disbursements 14,700, deposit accounts 16,400 and transfers 57,000. The slide also states a branch and agency network of more than 282 nationwide combined with a holistic customer view; the units of disbursements and transfers are not printed.
Left column with a phone photo and a gradient message card; right panel with a 2x2 grid of icon-titled line charts.
Insurance penetration gaps are illustrated: 2 in 7 families with life coverage, 1 in 4 vehicles insured and 5% of the middle class with private health insurance. Capabilities to expand access include a product launch time to market of 1.5 months and about 60 thousand annual consultations at Middle Class Innovation primary care (telehealth platform and affordable walk-in clinics).
Three outlined stat cards with segmented progress bars on top, and a full-width gradient banner with two capability stats below.
Divider for Panel 2, 'Amplifying Structural Competitive Advantages', introducing Cesar Rios (Chief Risk Officer) and Andre Rezende (Chief Technology Officer).
Cover-style background with centered title and two framed portraits with names and roles.
A from/to table contrasts old and new approaches: technology moves from business-specific solutions to standardized platforms and a shorter path from development to deployment; data from independently built analytics to group-wide assets and collective knowledge; AI from isolated use cases to workflow processes and reusable components; cyber from distributed capabilities to an integrated defense model and coordinated response.
Four rows of blue arrow labels, light-teal 'From' cells and pink 'To' cells with bullets.
Data volume in petabytes grows from 1.4 PB in 2020 to 3.8 PB in 2025 and 6.1 PB in 2026E, labeled 4x, with 2027E and 2028E shown as grey projection bars without printed values. Two stats: 90% of disbursements are originated by leads, and +5k users are potentially empowered by trusted corporate data products.
Top bar chart with an arrow, two stat cards in the middle and a gradient takeaway banner at the bottom.
Phase 1 (adoption) reports 90% of employees using tools such as GitHub Copilot, M365 Copilot and GenIA, and more than 100 AI use cases with 400+ in the pipeline. Phase 2 (business impact) targets 20%-80% cycle-time reduction by AI agents and 40%-60% of client inquiries handled through automation. Three principles follow: increase reuse, agentic workflows, and governed and trusted AI.
Left circular AI icon with concentric rings; center and right two phase cards with big numbers; bottom strip with three icon principles.
A qualitative slide titled 'Cybersecurity that protects today and enables tomorrow' with three pillars: anticipate (high and critical vulnerabilities), detect (reduction in mean time to detect, MTTD) and respond (reduction in mean time to respond, MTTR). No numeric values are printed. The takeaway reads 'Secure scale that protects customers, enables transformation, strengthens resilience and preserves trust.'
One large card with a two-color headline, three icon columns and a gradient message banner.
BCP's SME digital working capital portfolio grew from S/1.6 billion (Sep-25) to S/2.9 billion (Sep-26), ~2x, and the Yape portfolio from S/0.6 billion to S/2.3 billion, ~4x. At the retail portfolio level, loans rose +18%, net interest income +26% and provisions fell -8% from Sep-25 to Sep-26, supporting growth with improving asset quality.
Left two small bar-chart cards with growth arrows; right three icon cards and a gradient message banner.
Credicorp lays out prioritized fronts (infrastructure and continuity, employees, clients and community, communications) and an early-signals-to-action flow from multi-source signals to monitor and adjust. A donut shows direct exposure of ~8% of total loan portfolio as of September 2026: 5% BCP retail, 2% Mibanco microfinance and 1% BCP wholesale.
Left column of four outlined boxes with bullets; right top a five-icon process row and bottom a donut chart with leader lines to segments.
Divider for the Closing section, 'Reinforcing Our Higher Ambition', presented by Gianfranco Ferrari, Chief Executive Officer.
Cover-style background with centered title and a single framed portrait with name and role.
Four themes frame the strategy: deeper relationships and greater lifetime value, shared capabilities and stronger economics, clear ambitions for value creation, and disciplined execution with sustainable value. Mid-term ambitions are ~22% ROE, an efficiency ratio below 42% and ~6 million active lending clients, and the 2031 ambition is ~30% of risk-adjusted revenues from the innovation portfolio.
Left stack of four numbered gradient bars; center and right cards with large ambition figures.
The deck closes by repeating the cover artwork and its headline 'Scaling our Ecosystem Advantage' with the Strategic Update 2026 logo, bookending the presentation before Q&A.
Identical to the cover: full-bleed photo background, logo card top left, gradient headline and group photo of six people.
Common questions about this slide and the underlying presentation content.
It is a 29-page investor-day deck titled 'Scaling our Ecosystem Advantage'. It covers Peru's macro tailwinds, Credicorp's integrated ecosystem (BCP, Yape, Mibanco, Pacifico and others), digital and lending growth metrics, shared capabilities in data, AI and cybersecurity, an El Nino risk-response case, and closing ambitions.
The slides print mid-term ambitions of ~22% ROE, an efficiency ratio below 42% and ~6 million active lending clients. For 2031 the ambition is for the innovation portfolio to reach ~30% of risk-adjusted revenues, up from ~10% today. These are forward-looking statements covered by the safe-harbor page.
It is Credicorp Ltd's (NYSE: BAP) Strategic Update 2026, filed with the SEC as an exhibit to Form 6-K on 17 November 2026. It is a public company disclosure, so the content reflects management's own presentation of its strategy.
BCP (including its mass-market segment and the 'Principality' model), Yape (the digital wallet and lending), Mibanco (microfinance, including WhatsApp banking) and Pacifico (insurance) get dedicated slides. The ecosystem diagram also shows Krealo, Credicorp Capital, Prima AFP and Pacifico Salud.
Yape monthly active users grew from 4.5 million in 2021 to 17.0 million in Sep 2026 (3.8x). Its active lending clients reached 3.2 million, there are more than 6 million cumulative borrowers, and the 2029 ambition is 9.0 million cumulative borrowers and 4.5 million active lending clients.
The deck uses S/ for Peruvian soles (for example S/440 average Yape ticket and S/ billions for the SME and Yape portfolios). Some figures, such as Mibanco non-financial income, do not print a currency on the slide.
It works well as a design and structure reference: agenda, speaker dividers, KPI scorecards, before/after charts, from/to tables and a closing ambition slide. Download the editable PPTX to adapt the layouts with your own content, and remember the Credicorp branding and data belong to Credicorp.
The deck is offered as a PDF and as an editable PPTX. Note that a few footnotes and chart axes (for example the cohort charts on the BCP mass-market slide) are very small, and some projection bars have no printed values.

Create Your Own Slides
Turn your ideas into professional presentations in seconds with 2slides AI.
Reference professional designs, choose your style, and generate slides with perfect text rendering. Powered by Nano Banana—start creating your presentation now.
Your AI Agent for slides. Save time, shine faster with intelligent presentation creation.


© 2026 2slides. All rights reserved.