
Part of Investor presentation examples · E-commerce presentation examples
Coupang Q3 2026 Earnings Presentation: the 23-slide deck Coupang, the US-listed South Korean e-commerce company, released on November 3, 2026 for its third-quarter 2026 financial results, covering revenue, gross profit, net loss, adjusted EBITDA, cash flow, segment results and non-GAAP reconciliations.
Uses this deck’s cover as a style reference for slides made from your own content. Or pick any page below to use its layout as the reference.
Quick Navigation
Tags
Share the slides
Coupang Q3 2026 Earnings Presentation: the 23-slide deck Coupang, the US-listed South Korean e-commerce company, released on November 3, 2026 for its third-quarter 2026 financial results, covering revenue, gross profit, net loss, adjusted EBITDA, cash flow, segment results and non-GAAP reconciliations.
Detailed view of each slide page, including layout, key content and visual elements.
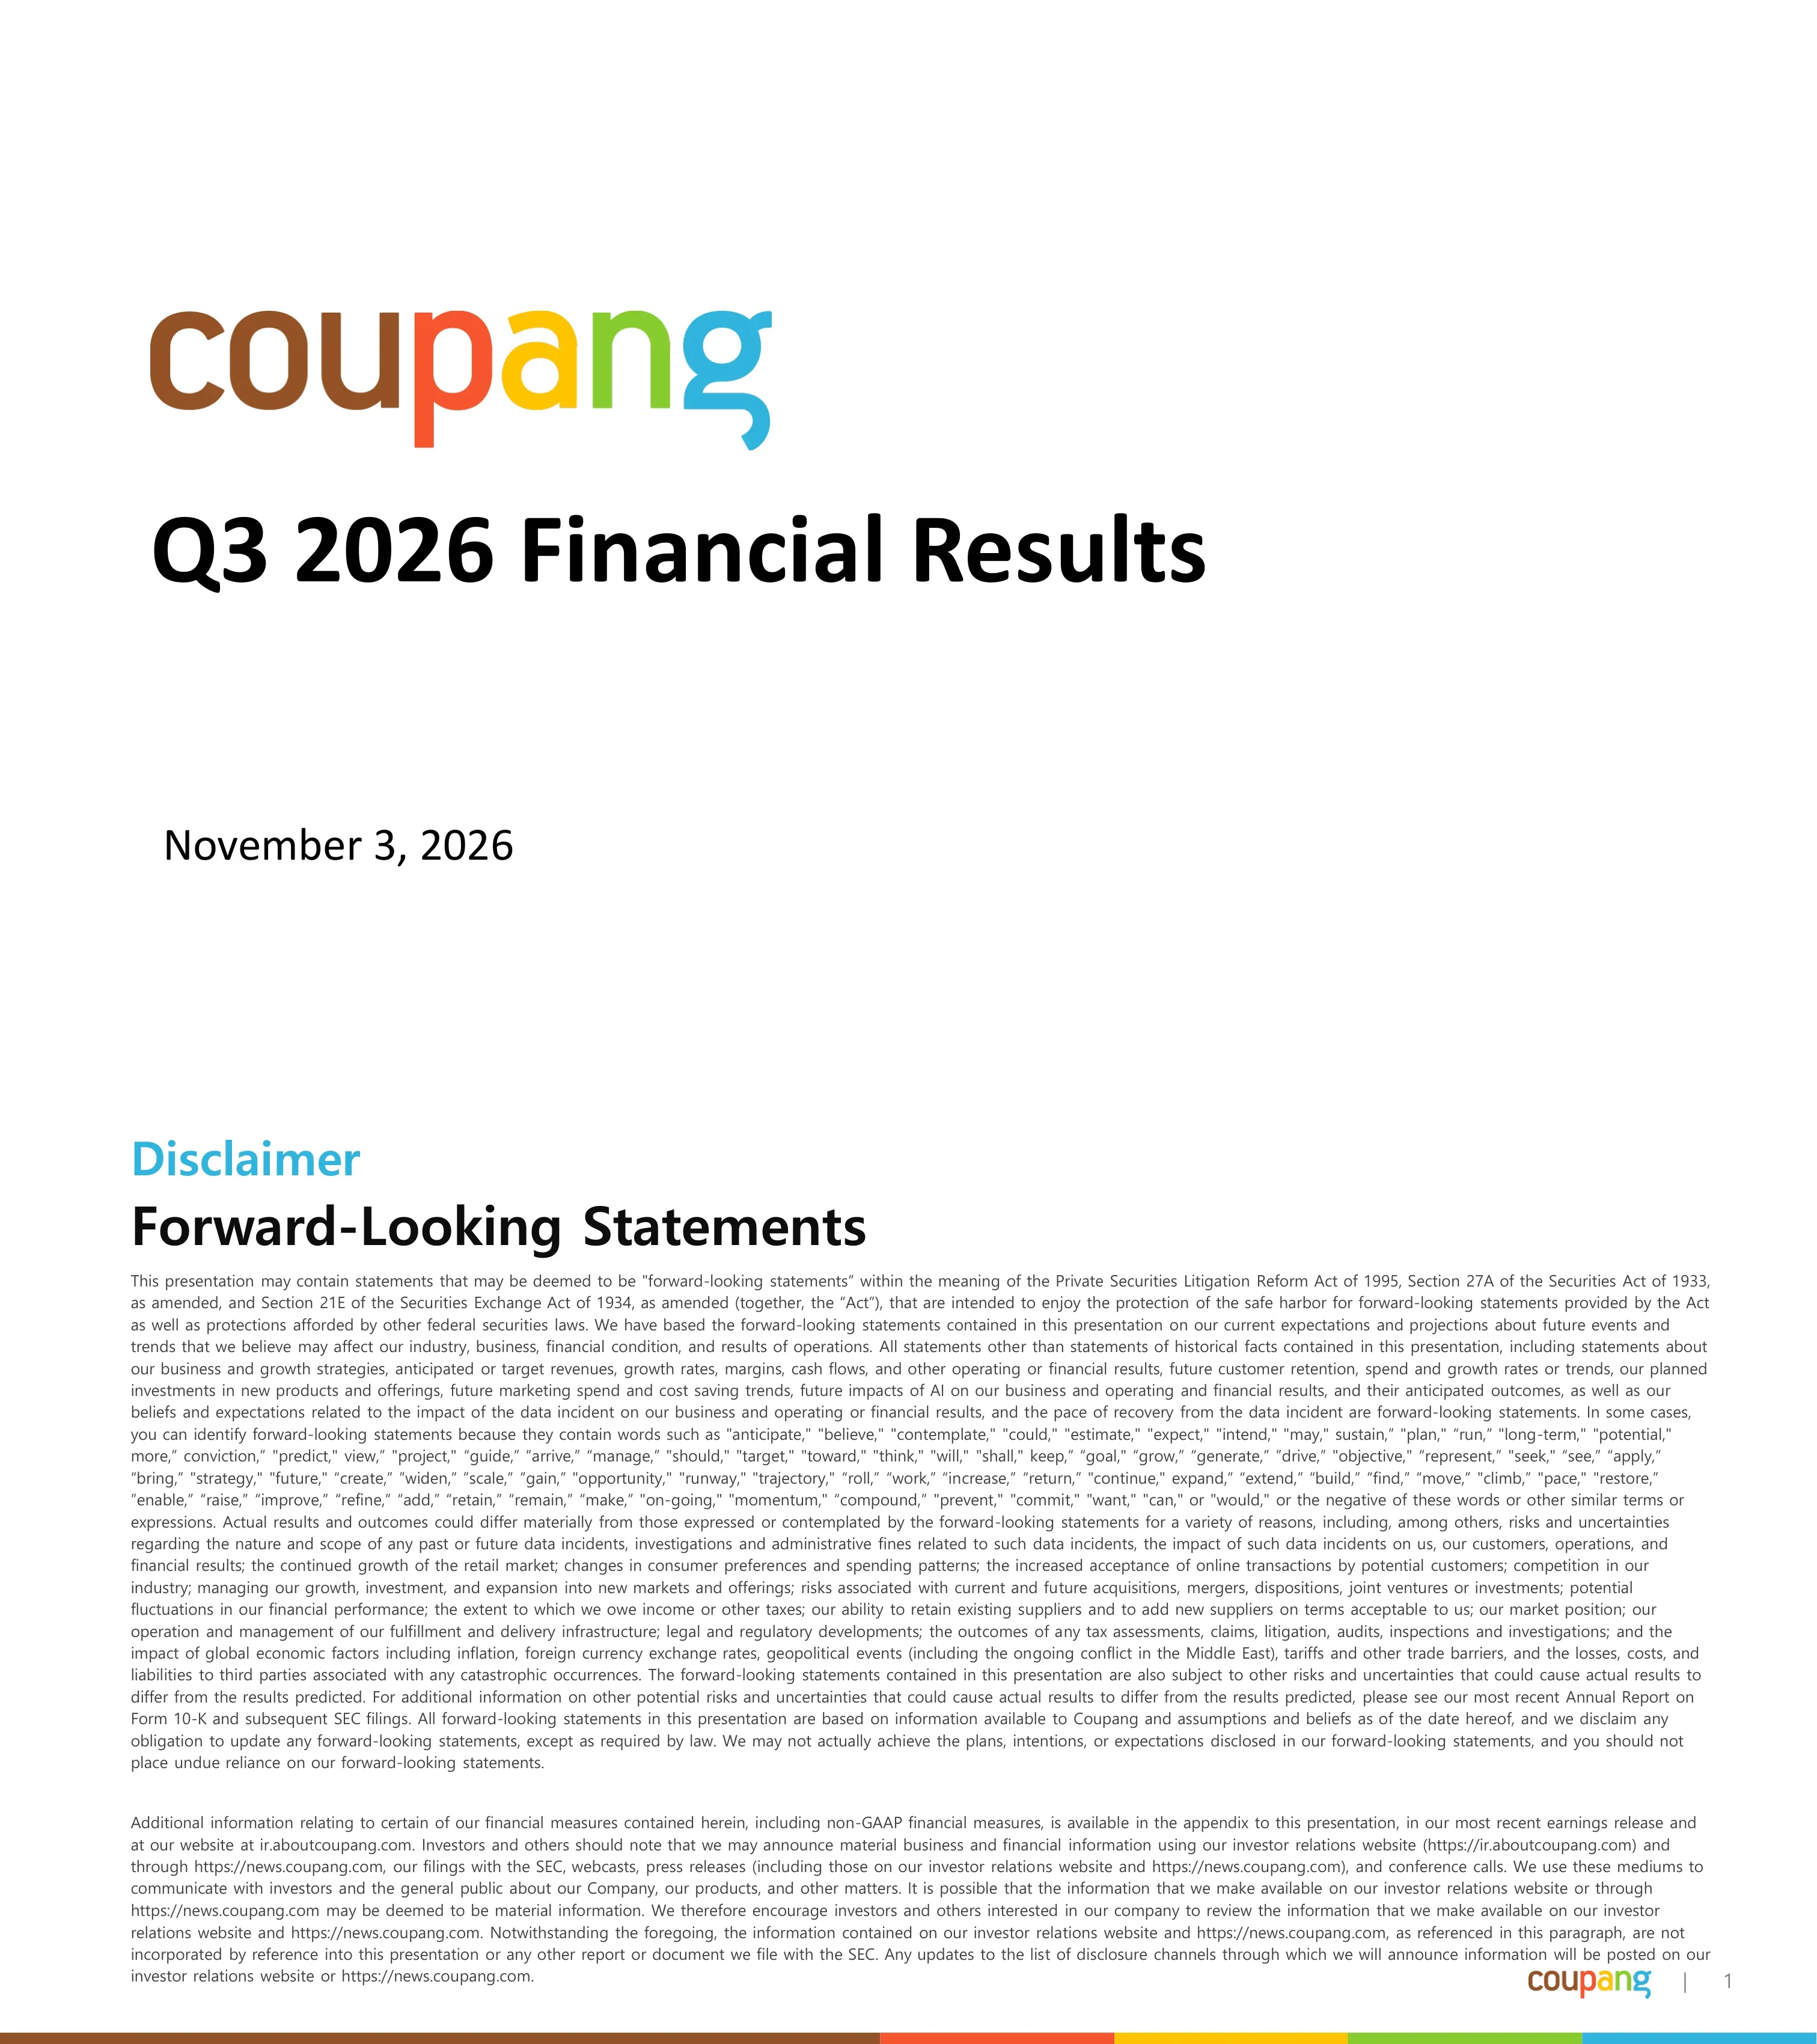
Cover slide for Coupang's third-quarter 2026 earnings presentation, dated November 3, 2026.
Minimal white title slide: multicolour Coupang wordmark top-left, large bold title beneath, date in smaller type at the bottom left.
Safe-harbor language under the Private Securities Litigation Reform Act of 1995, naming risks such as data incidents and related investigations and fines, competition, fulfillment infrastructure, tax assessments, inflation, FX, tariffs, the conflict in the Middle East and catastrophic occurrences; a second paragraph points to non-GAAP reconciliations in the appendix and lists ir.aboutcoupang.com and news.coupang.com as disclosure channels.
Text-only legal slide: blue 'Disclaimer' kicker, bold black headline, two dense justified paragraphs of small body text, footer logo and page number.
Total outstanding common stock plus equity-based awards fell from 1,899M in Q3 2025 (1,823M shares + 76M awards) to 1,868M in Q3 2026 (1,787M shares + 81M awards), which Coupang presents as (1.7)% year-over-year dilution, i.e. a net reduction.
Five-quarter stacked column chart (Q3 25 to Q3 26) with totals labelled only on the first and last bars; legend below and a definitional footnote.
Quarterly total net revenues rose from $9.3B in Q3 2025 to $10.0B in Q3 2026 (reconciled in the appendix as $9,267M to $9,962M), up 7% as reported and 11% on an FX-neutral basis.
Headline-first chart slide: blue kicker, two-line bold takeaway, then a five-quarter column chart with only the start and end values labelled; footnote explaining FX-neutral.
Trailing-twelve-month net revenues grew from $33.7B to $36.2B, up 7% reported and 11% FX-neutral.
Two-column comparison chart (Q3 25 vs Q3 26 TTM) under a bold two-line headline.
Gross profit fell from $2.7B (29.4% margin) to $2.6B (25.7% margin): down 6% reported, down 3% FX-neutral, with gross margin down 364 bps. Excluding $95M of fulfillment-center (FC) fire-related costs, gross profit would be $2.7B and margin 26.7%.
Five-quarter column chart with yellow margin dots inside the end bars and blue call-out annotations on the right giving the ex-fire figures.
Net income swung from $95M in Q3 2025 to a $(501)M loss in Q3 2026, after losses in Q4 2025, Q1 2026 and a deeper loss in Q2 2026. Excluding $180M of tax-affected loss related to the FC fire, the Q3 2026 loss would be $(321)M.
Positive/negative column chart around a zero axis with quarter labels on the axis line; blue call-out with the ex-fire figure.
Left: TTM gross profit fell 2% from $10.1B (30.0% margin) to $9.9B (27.4% margin), with GPM down 260 bps; excluding $95M FC fire-related costs it would be $10.0B and 27.6%. Right: TTM net income attributable to stockholders fell $1.8B, from $390M to $(1.4)B, a figure that includes certain administrative fines and FC fire-related costs.
Split two-panel slide, each with its own kicker, headline and two-bar chart; blue annotations beside the Q3 26 bars.
Quarterly adjusted EBITDA fell from $413M (4.5% margin) in Q3 2025 to $116M (1.2% margin) in Q3 2026, down 329 bps; the trough was Q1 2026 per the bar heights (appendix: $29M).
Five-quarter column chart with margin markers on the end bars and a long footnote defining adjusted EBITDA.
TTM adjusted EBITDA dropped from $1.6B (4.9% margin) to $575M (1.6% margin), down $1.1B and 329 bps.
Two-bar comparison chart with yellow margin dots and a bold two-line headline.
TTM operating cash flow fell $1.5B, from $2.4B to $845M; TTM free cash flow fell $1.7B, from $1.3B to $(409)M. Free cash flow is defined as operating cash flow less purchases of property and equipment plus proceeds from sales.
Two side-by-side two-bar charts, each with kicker and bold headline; FCF chart shows a negative bar below the axis; footnote definition.
Product Commerce net revenue grew from $8.0B to $8.4B in the quarter and from $29.1B to $30.4B TTM, up 5% reported and 8% FX-neutral in both views.
Section-titled slide with two panels: five-quarter column chart on the left, two-bar TTM chart on the right, each with a two-line growth headline.
Product Commerce adjusted EBITDA fell $320M to $385M in Q3 2026 (4.6% margin vs 8.8%, down 424 bps). On a TTM basis it fell $765M, from $2.5B (8.5%) to $1.7B (5.6%), down 288 bps.
Two-panel layout mirroring the revenue slide: quarterly five-bar chart and TTM two-bar chart, both with yellow margin dots.
Active customers in Product Commerce rose from 24.7M in Q3 2025 to 25.2M in Q3 2026, up 2%, after a dip in Q1 2026 visible in the bar heights. Active customers are those who ordered at least once directly from Coupang's Product Commerce apps or websites in the quarter.
Single five-quarter column chart under a short bold headline; definitional footnote.
Developing Offerings net revenue rose from $1.3B to $1.6B in the quarter (up 23%, 27% FX-neutral) and from $4.6B to $5.8B TTM (up 26%, 27% FX-neutral).
Two-panel segment slide: quarterly five-bar chart on the left and TTM two-bar chart on the right.
Developing Offerings adjusted EBITDA loss narrowed by $23M to $(269)M in Q3 2026 (margin (16.9)% vs (22.7)%), but the TTM loss widened by $304M, from $(813)M ((17.7)% margin) to $(1.1)B ((19.3)% margin).
Inverted (downward) column charts hanging from a top baseline for both quarterly and TTM views, with margin dots inside the bars.
Five operating principles: deliver new moments of wow for customers; work backwards from jaw-dropping customer experiences rather than what looks easy; use technology, process innovation and scale to drive operating leverage and cash flow; always prioritise long-term cash-flow growth; and allocate capital with discipline, starting small, testing and scaling what has the best long-term cash-flow potential.
Text slide with five numbered statements, each led by a blue ordinal word ('One,' to 'Five,') followed by grey body text.
Section divider for the appendix, carrying the mission line 'Create a world where customers wonder "How did I ever live without Coupang?"' over a photo of a woman opening her front door to Rocket Fresh and Coupang delivery packages.
Full-bleed lifestyle photograph darkened for contrast, with white mission text and a large 'Appendix' heading at lower left.
Reconciliation table: Q3 net revenues of $9,267M (2025) vs $9,962M (2026), plus a $290M exchange-rate effect for a $10,252M constant-currency figure (7% reported, 11% constant-currency growth). Product Commerce $7,980M to $8,374M (+$248M FX, $8,622M), Developing Offerings $1,287M to $1,588M (+$42M, $1,630M). TTM: $33,664M to $36,157M (+$1,143M FX, $37,300M); Product Commerce $29,067M to $30,383M; Developing Offerings $4,597M to $5,774M.
Two stacked financial tables (three months and trailing twelve months) with blue column headers for as-reported, exchange-rate effect, constant-currency and growth columns.
Q3 gross profit fell from $2,720M to $2,561M; adding a $71M FX effect gives $2,632M constant-currency, (6)% reported and (3)% constant-currency. Product Commerce $2,564M to $2,376M ((7)% / (5)%); Developing Offerings $156M to $185M (19% / 19%).
Single financial table centred on the slide with the same column structure as the revenue reconciliation.
Five-quarter bridge from net income to adjusted EBITDA. Revenues: $9,267M, $8,835M, $8,504M, $8,856M, $9,962M. Net income (loss): $95M, $(26)M, $(266)M, $(570)M, $(501)M. Add-backs include D&A ($133M to $149M), equity-based compensation ($118M to $169M), $410M of certain administrative fines in Q2 2026 and $248M of Incheon FC fire losses in Q3 2026. Adjusted EBITDA: $413M, $267M, $29M, $163M, $116M (margins 4.5%, 3.0%, 0.3%, 1.8%, 1.2%).
Wide five-column reconciliation table with indented adjustment rows, bold net income and adjusted EBITDA rows, and a footnote defining administrative fines.
TTM reconciliation: revenue $33,664M vs $36,157M; net income (loss) $371M vs $(1,363)M (1.1% vs (3.8)% margin). Prior TTM includes a $(175)M fulfillment-center fire insurance gain and $67M acquisition and restructuring losses; current TTM adds back $410M administrative fines and $248M Incheon FC fire losses. Adjusted EBITDA $1,644M (4.9%) vs $575M (1.6%).
Two-column TTM reconciliation table with the same row structure as the quarterly version plus an insurance-gain line.
Operating cash flow of $2,367M vs $845M, less purchases of land and buildings ($190M vs $328M) and equipment ($915M vs $929M), plus small sale proceeds, gives free cash flow of $1,268M vs $(409)M. Net cash used in investing was $(1,019)M vs $(1,301)M; financing was $280M vs $(1,427)M.
Two-column cash-flow reconciliation table with bold operating cash flow and free cash flow rows.
Common questions about this slide and the underlying presentation content.
It is the 23-slide deck Coupang published on its investor relations site on November 3, 2026 with its third-quarter 2026 results. It covers total and segment revenue, gross profit, net income (loss), adjusted EBITDA, cash flow, active customers and non-GAAP reconciliations.
Total net revenues were $10.0B ($9,962M), up 7% year over year and 11% FX-neutral. Gross profit was $2.6B at a 25.7% margin, the net loss attributable to stockholders was $(501)M, and adjusted EBITDA was $116M (1.2% margin). TTM revenue reached $36.2B.
The deck cites costs from a fire at its Incheon fulfillment center: $95M in gross profit, $248M of fire losses added back in the adjusted EBITDA reconciliation, and $180M of tax-affected loss in net income. Without the fire, it says the net loss would have been $(321)M. TTM results also include $410M of administrative fines booked in Q2 2026.
Product Commerce revenue grew 5% (8% FX-neutral) to $8.4B, with adjusted EBITDA of $385M at a 4.6% margin. Developing Offerings grew 23% (27% FX-neutral) to $1.6B, and its adjusted EBITDA loss narrowed to $(269)M. Product Commerce active customers rose 2% to 25.2M.
Yes. The original PDF is available to download from this page, and you can preview every slide above. It is Coupang's own presentation, so use it for reference and research, and cite Coupang as the source.
Yes. You can borrow its layout without copying its content: a short colour kicker, a bold one-line takeaway, a five-quarter bar chart with only the first and last values labelled, and a quarterly-vs-TTM split for each segment. With 2Slides you can make a deck in a similar style from your own data.
FX-neutral, or constant currency, shows growth as if exchange rates had stayed at prior-year levels. Coupang reports in US dollars but earns mostly in Korean won, so it reports both. The appendix shows a $290M exchange-rate effect on Q3 2026 revenue.
Coupang posts earnings releases, presentations, webcasts and SEC filings on its investor relations website at ir.aboutcoupang.com, and company news at news.coupang.com.
Official source for Coupang earnings releases, presentations and SEC filings.

Create Your Own Slides
Turn your ideas into professional presentations in seconds with 2slides AI.
Reference professional designs, choose your style, and generate slides with perfect text rendering. Powered by Nano Banana—start creating your presentation now.
Your AI Agent for slides. Save time, shine faster with intelligent presentation creation.


© 2026 2slides. All rights reserved.