
Part of Investor presentation examples
Coherent Corp. First Quarter Fiscal 2027 Earnings Presentation (quarter ended September 30, 2026, i.e. July–September 2026), dated November 4, 2026 and filed with the SEC as Exhibit 99.2 to Form 8-K. The 18-slide deck reports record revenue of $2.37 billion (up 56% year over year on a pro forma basis), non-GAAP gross margin of 40.6%, non-GAAP operating margin of 23.2% and non-GAAP diluted EPS of $2.09, with Datacenter and Communications revenue of about $2.0 billion (up 79% YoY, 82% of total), a flat ~$0.4 billion Industrial segment, Q2 FY27 guidance of $2.55–$2.75 billion revenue and $2.28–$2.48 non-GAAP EPS, and full GAAP to non-GAAP reconciliations for five quarters.
Uses this deck’s cover as a style reference for slides made from your own content. Or pick any page below to use its layout as the reference.
Quick Navigation
Tags
Share the slides
Coherent Corp. First Quarter Fiscal 2027 Earnings Presentation (quarter ended September 30, 2026, i.e. July–September 2026), dated November 4, 2026 and filed with the SEC as Exhibit 99.2 to Form 8-K. The 18-slide deck reports record revenue of $2.37 billion (up 56% year over year on a pro forma basis), non-GAAP gross margin of 40.6%, non-GAAP operating margin of 23.2% and non-GAAP diluted EPS of $2.09, with Datacenter and Communications revenue of about $2.0 billion (up 79% YoY, 82% of total), a flat ~$0.4 billion Industrial segment, Q2 FY27 guidance of $2.55–$2.75 billion revenue and $2.28–$2.48 non-GAAP EPS, and full GAAP to non-GAAP reconciliations for five quarters.
Detailed view of each slide page, including layout, key content and visual elements.
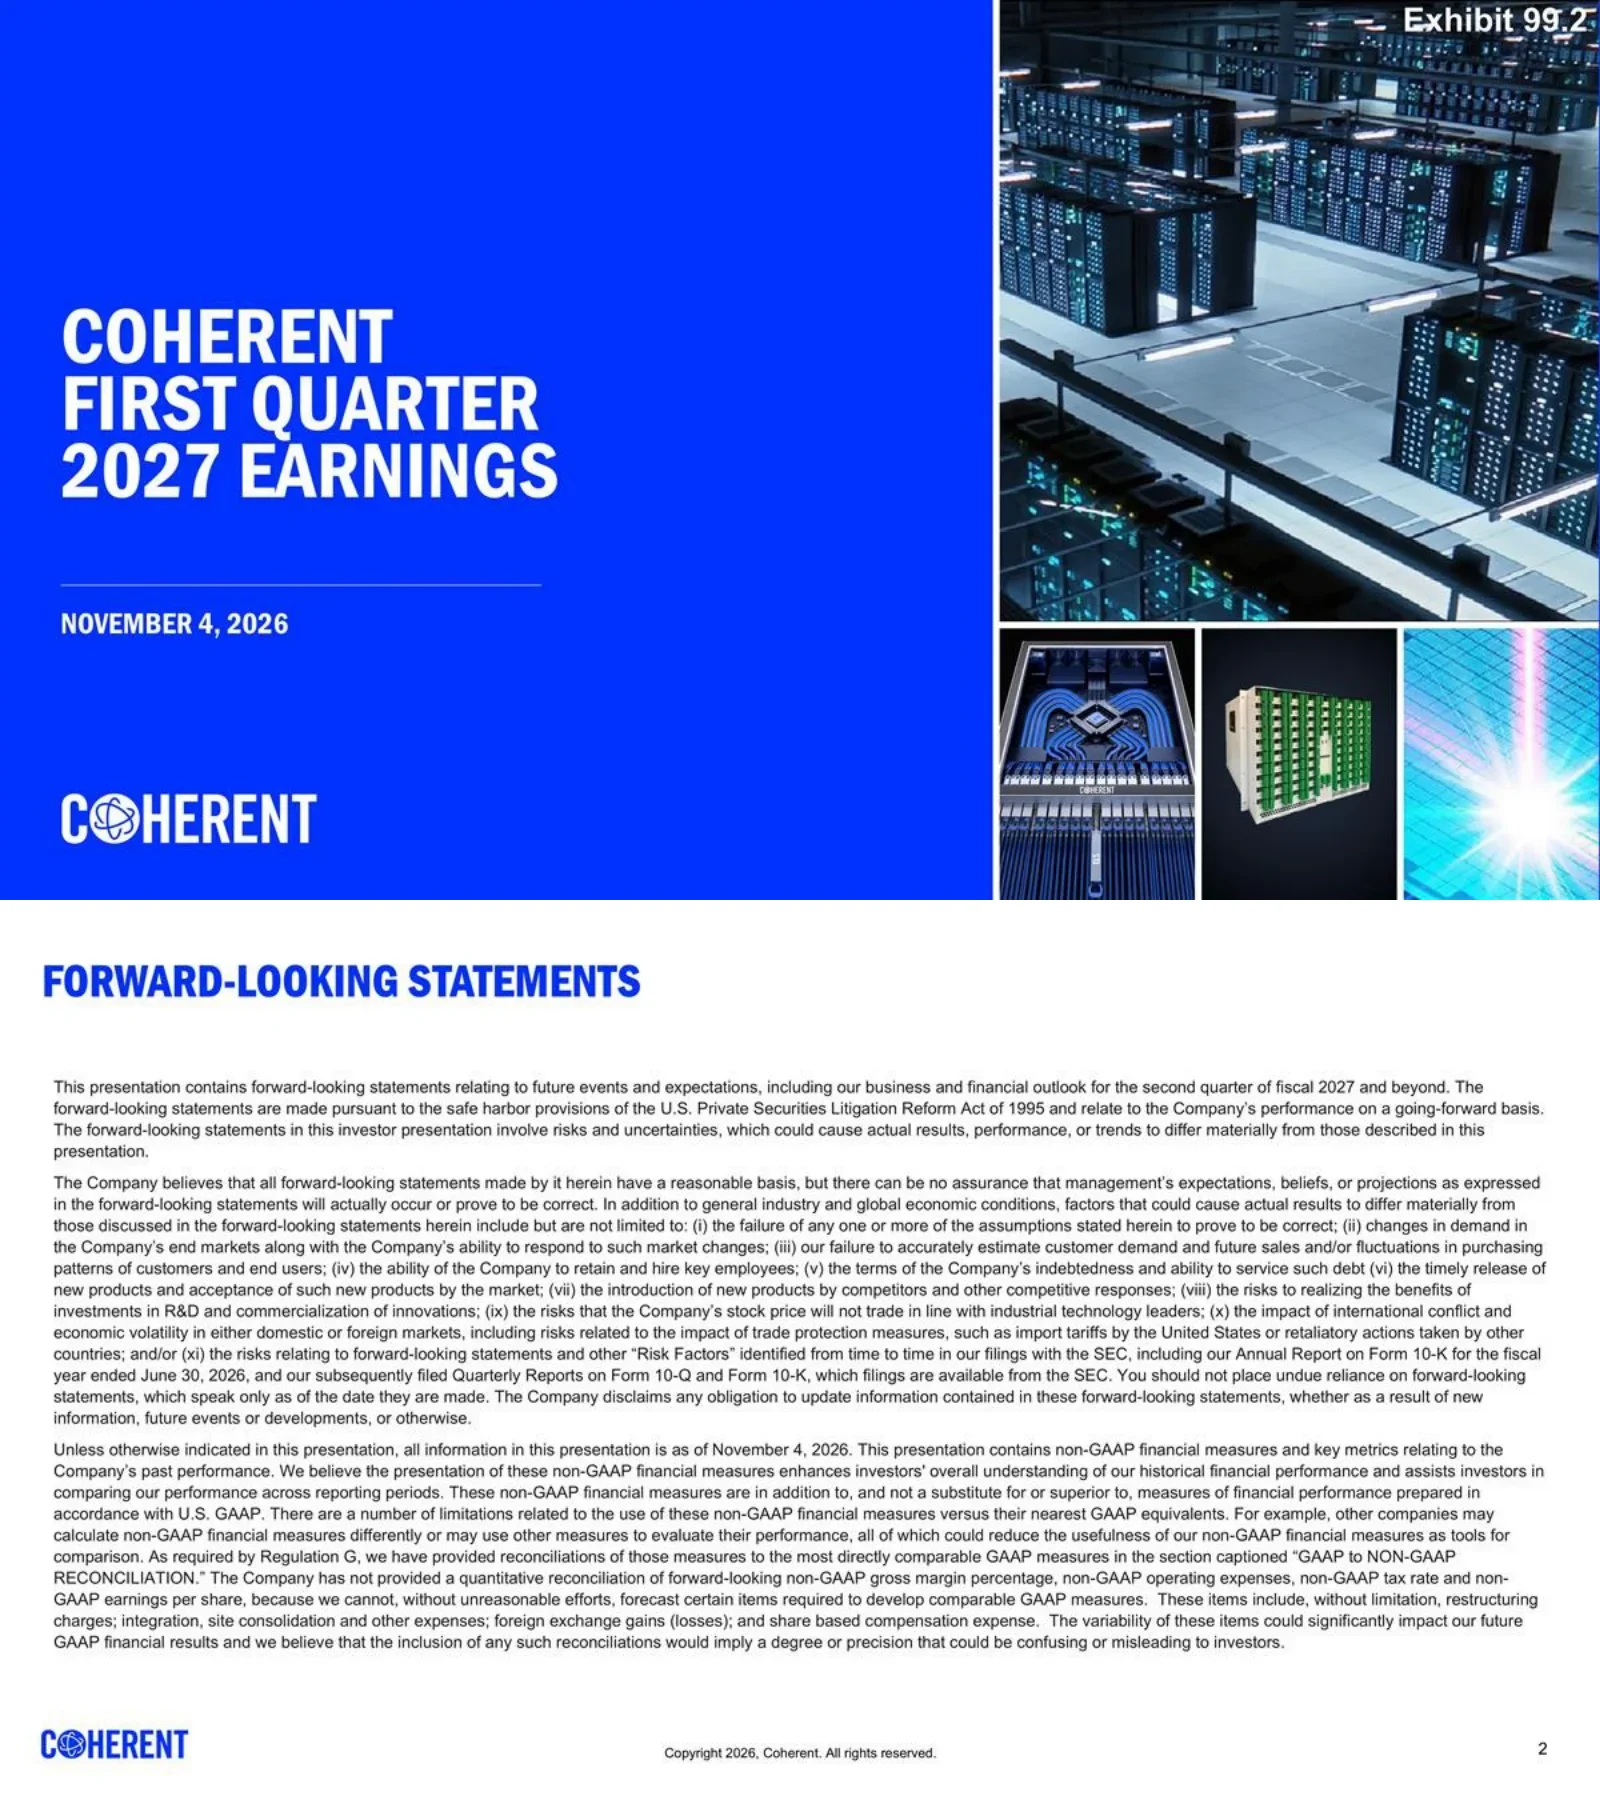
Title slide for Coherent's first quarter fiscal 2027 earnings, dated November 4, 2026, marked 'Exhibit 99.2' in the top-right corner of the SEC filing.
Split layout: left ~60% solid electric-blue panel with large white condensed uppercase title, a thin divider, the date and the white Coherent wordmark; right panel is a photo collage of a datacenter hall above three smaller tiles (a co-packaged optics board, a rack-mount optical system and a laser-lit wafer).
Safe-harbor disclaimer under the Private Securities Litigation Reform Act of 1995 covering the outlook for the second quarter of fiscal 2027 and beyond; lists risk factors including end-market demand shifts, customer forecasting, key employee retention, indebtedness, new product timing, competition, R&D commercialization, international conflict and trade protection measures such as U.S. import tariffs; references the Form 10-K for the fiscal year ended June 30, 2026; states information is as of November 4, 2026 and explains the use of non-GAAP measures and why forward-looking non-GAAP measures are not reconciled.
Blue uppercase headline top-left, three dense justified paragraphs of body text across the full width, footer with Coherent logo, copyright line and page number.
Up-front reconciliation for five quarters (Sep 30, 2026 back to Sep 30, 2025): GAAP gross margin of $928M, $787M, $680M, $623M and $579M becomes non-GAAP gross margin of $962M, $823M, $714M, $657M and $613M after share-based compensation ($6–7M) and amortization of acquired intangibles ($28M); diluted weighted average shares of 202.0M, 202.2M, 196.4M, 192.8M and 190.7M; GAAP diluted EPS of $1.90, $1.19, $0.97, $0.76 and $1.19 versus non-GAAP diluted EPS of $2.09, $1.74, $1.41, $1.29 and $1.16. The same tables reappear in the appendix on pages 13 and 17.
Blue headline across the top; two stacked financial tables with blue rule lines, row labels on the left and five quarterly columns, bold subtotal rows.
Record results and accelerating growth: record Q1 revenue of $2.37B (+56% YoY), non-GAAP gross margin of 40.6% (+184 bps YoY), non-GAAP EPS of $2.09 (+80% YoY), FY27 revenue growth expected to exceed 60%, first quarter above 45% non-GAAP gross margin expected before CY28-end. Strong demand and manufacturing execution: Datacenter and Communications revenue grew 79% YoY to 82% of total; new LTAs including a PhotonLink agreement valued at ~$20B over five years with revenue ramping from early CY2028; internal InP output capacity doubled YoY one quarter early and on track to more than double again by CY27-end. Scale-across and PhotonLink: scale-across / DCI Q1 revenue exceeded $200M (roughly 4x YoY, nearly $1B annualized run rate) and is expected to roughly double by CY2027-end; PhotonLink revenue expected to exceed $100M in the March 2027 quarter and $250M per quarter before CY27-end. Footnote: pro forma figures exclude the divested Aerospace & Defense business (closed September 2, 2025) and the Munich, Germany business (closed January 30, 2026).
Blue headline, three blue uppercase subheadings each followed by square-bullet lists, small-print footnote above the standard footer.
Q1 revenue up 16% QoQ and 56% YoY, shown as $1.5B (Q1'26), $2.0B (Q4'26) and $2.4B (Q1'27). Key highlights sidebar: FY27 revenue growth expected to exceed 60%, more than double FY26's rate; Q2 FY27 revenue expected at $2.55B–$2.75B; first $3B revenue quarter expected by FY27-end; clear line of sight to the first $4B revenue quarter in FY28.
Left black sidebar with large white Coherent wordmark and a 'Key Highlights' list; right side has a blue title, a large blue growth headline and a three-bar column chart with the latest bar in saturated blue and prior bars in pale lavender.
Four non-GAAP KPIs comparing Q1'26 to Q1'27: gross margin 38.7% to 40.6% (+184 bps YoY expansion); opex as a percentage of revenue 19.2% to 17.4% (-183 bps YoY reduction); operating margin 19.5% to 23.2% (+368 bps YoY expansion); earnings per share $1.16 to $2.09 (+80% YoY growth). Footnote points to the appendix reconciliations.
2x2 quadrant grid separated by thin gray lines; each quadrant has an uppercase label, a two-bar chart (pale prior year, blue current year) and a large blue delta callout with caption.
Segment Q1 revenue up 21% QoQ and 79% YoY: $1.1B (Q1'26), $1.6B (Q4'26), $2.0B (Q1'27). Highlights: Datacenter revenue +17% QoQ / +85% YoY; Communications revenue +34% QoQ / +84% YoY; PhotonLink revenue expected to exceed $100M in the March 2027 quarter and $250M per quarter before CY27-end; scale-across / DCI Q1 revenue above $200M, nearly $1B annualized; Multi-Rail revenue ramp expected in the March 2027 quarter; internal InP output capacity doubled YoY in Q1, one quarter ahead of plan; customer orders increasingly extend into CY28 with LTAs typically running to the end of the decade. CEO Jim Anderson quote on the breadth of the photonic portfolio and manufacturing scale.
Left sidebar with a datacenter photo on top and a blue 'Key Highlights' panel of bullets below; right side has the blue title, growth headline, three blue bars and a black quote banner along the bottom.
Industrial segment Q1 revenue flat QoQ and YoY at about $0.4B in each of Q1'26, Q4'26 and Q1'27 (pro forma). Highlights: strong semiconductor capital equipment bookings support an expected return to growth in Q2 FY27; notable bookings uptick for lasers, precision optics and engineered materials for front-end applications; CO2 lasers and zinc selenide optics enable advanced circuit-board drilling for AI servers; Thermadite xPU cooling prototypes shipping to strategic customers in Q2 FY27 with a revenue ramp expected in H2 CY27; fusion-related demand ramping; supplying lasers and materials to quantum technology developers. CEO quote on vertical integration from materials and crystal growth through optics and lasers.
Same segment template as page 7 recolored in purple: wafer/laser photo above a purple highlights sidebar, purple growth headline and three equal purple bars, black quote banner and pro forma footnote.
Three news cards: September 21, 2026 — launched PhotonLink, an integrated optics platform for CPO, NPO and emerging chip-to-chip connectivity, with anchor customers and long-term agreements secured and revenue expected to begin ramping in Q4 CY26; September 17, 2026 — expanded the Pluggable Optical Line System (POLS) portfolio with full C-band amplification in a compact QSFP form factor, built for 800G ZR/ZR+, carrying up to 25.6Tbps over a single fiber pair and shipping in high volume; August 17, 2026 — began sampling 300mm high thermal conductivity silicon carbide substrates to AI semiconductor partners, improving heat spreading by up to 25% versus current solutions.
Blue headline; a teal abstract background band holding three white cards in columns, each with a date, blue uppercase headline, body paragraph and 'Read more here' link.
Q2 FY27 guidance: revenue $2.55 billion to $2.75 billion; non-GAAP gross margin 40.0% to 42.0%; non-GAAP operating expenses $430 million to $450 million; non-GAAP tax rate 18% to 20%; non-GAAP EPS $2.28 to $2.48. Footnote explains forward-looking non-GAAP measures are not reconciled to GAAP.
Blue headline; a centered two-column guidance table with heavy blue top and bottom rules and dotted separators, metric names in bold uppercase on the left and ranges on the right; small-print footnote above the footer.
Accelerating revenue: expect the first $3 billion revenue quarter by FY27-end, FY27 pro forma revenue growth above 60% (more than double the FY26 pro forma growth rate) and the first $4 billion revenue quarter in FY28. Expanding gross margin: expect the first quarter with non-GAAP gross margin above 45% before CY28-end.
Blue headline, two blue uppercase subheads with square-bullet lists in the upper half, large white space below, small-print footnote above the footer.
Section divider introducing the appendix of GAAP to non-GAAP reconciliation tables.
Full-width electric-blue horizontal band across the middle of a white slide with a large white uppercase title; standard footer.
Five-quarter reconciliation: GAAP gross margin $928M (Sep 30, 2026), $787M (Jun 30, 2026), $680M (Mar 31, 2026), $623M (Dec 31, 2025) and $579M (Sep 30, 2025); add-backs of share-based compensation ($6M, $7M, $6M, $6M, $6M) and amortization of acquired intangibles ($28M each quarter); non-GAAP gross margin $962M, $823M, $714M, $657M and $613M. Note: amounts may not foot due to rounding.
Blue headline and a single compact table in the top third of the slide with blue rules and five quarterly columns; rounding footnote.
R&D on GAAP basis $237M, $216M, $186M, $166M, $155M becomes non-GAAP $227M, $208M, $178M, $159M, $148M after share-based compensation. SG&A on GAAP basis $305M, $266M, $268M, $259M, $252M becomes non-GAAP $185M, $169M, $170M, $162M, $156M after share-based compensation ($57M in the latest quarter), amortization of acquired intangibles (~$42M), financing fees and integration/site consolidation costs ($21M latest quarter). Restructuring ($9M latest), impairment of assets held for sale ($44M in the June 2026 quarter) and gain on sale of business ($115M in the September 2025 quarter, $9M in the March 2026 quarter) are fully excluded from non-GAAP.
Blue headline over a dense multi-block table: R&D, SG&A, restructuring, impairment and gain-on-sale blocks, each ending in a bold non-GAAP subtotal row with blue rules; parentheses for deductions.
GAAP operating income $378M, $254M, $201M, $184M and $259M (Sep 2026 back to Sep 2025) plus share-based compensation ($73M latest), amortization of acquired intangibles ($70M), restructuring ($9M), integration/site consolidation ($21M) and other items gives non-GAAP operating income of $550M, $446M, $366M, $336M and $309M; non-GAAP operating margin 23.2%, 21.8%, 20.3%, 19.9% and 19.5%. The September 2025 quarter GAAP figure includes a $115M gain on sale of business that is removed.
Blue headline and one table in the top half: GAAP row, seven adjustment rows, bold non-GAAP operating income and margin percentage rows.
Net earnings attributable to Coherent Corp. on GAAP basis $385M, $241M, $191M, $147M and $226M; adjustments for share-based compensation, amortization of acquired intangibles ($70–71M), foreign exchange (gains) losses, restructuring, impairment, gain on sale of business, integration costs, gain on sale of investment ($38M in the June 2026 quarter), financing fees, non-controlling interest impact and the tax impact of non-GAAP measures ($121M in the latest quarter) yield non-GAAP net earnings of $422M, $351M, $276M, $248M and $221M.
Blue headline and one long table occupying the top two-thirds, eleven adjustment rows between bold GAAP and non-GAAP rows; rounding footnote.
Share count and EPS bridge for five quarters: GAAP common shares of 196.2M, 195.7M, 190.2M, 167.5M and 156.2M plus common stock equivalents and, in the two 2025 quarters, Series B Redeemable Preferred Stock (19.8M and 29.9M) give diluted weighted average shares of 202.0M, 202.2M, 196.4M, 192.8M and 190.7M. GAAP basic / diluted EPS: $1.96 / $1.90, $1.23 / $1.19, $1.01 / $0.97, $0.87 / $0.76, $1.24 / $1.19. Non-GAAP basic / diluted EPS: $2.15 / $2.09, $1.79 / $1.74, $1.45 / $1.41, $1.47 / $1.29, $1.20 / $1.16.
Blue headline over a two-part table: share count build-ups for GAAP and non-GAAP, then basic and diluted EPS rows for GAAP and non-GAAP; blue rules and rounding footnote.
Closing slide with the Coherent logo and the investor relations web address coherent.com/company/investor-relations.
Centered large blue Coherent wordmark on a white background with an underlined gray URL beneath.
Common questions about this slide and the underlying presentation content.
Coherent's fiscal year ends around June 30, so fiscal Q1 2027 is the quarter ended September 30, 2026 (roughly July to September 2026). The deck is dated November 4, 2026 and also gives guidance for fiscal Q2 2027, the December 2026 quarter.
Yes. It is the presentation Coherent Corp. filed with the SEC as Exhibit 99.2 to a Form 8-K on November 4, 2026. In that filing the slides are images, so the page-by-page text here is transcribed from them. The fine-print footnotes are small, but the headline figures and reconciliation tables are legible.
Record revenue of $2.37 billion, up 56% year over year on a pro forma basis and 16% sequentially; non-GAAP gross margin of 40.6% (+184 bps YoY); non-GAAP operating margin of 23.2%; and non-GAAP diluted EPS of $2.09, up 80% from $1.16. GAAP diluted EPS was $1.90.
For Q2 FY2027 Coherent guided revenue of $2.55–$2.75 billion, non-GAAP gross margin of 40.0%–42.0%, non-GAAP operating expenses of $430–$450 million, a non-GAAP tax rate of 18%–20% and non-GAAP EPS of $2.28–$2.48. Longer term it expects a first $3 billion revenue quarter by FY27-end, a first $4 billion quarter in FY28 and non-GAAP gross margin above 45% before the end of CY28.
The segment slides (pages 7 and 8) pair a highlights sidebar with a three-bar revenue chart and a CEO quote banner. The 2x2 KPI slide (page 6) shows four non-GAAP metrics with bps deltas, and the guidance table (page 10) is a clean two-column range layout. Each one adapts easily to another company's quarterly numbers.
Yes. The original PDF is available to download from this gallery page, along with high-resolution images of every slide. You can also recreate the layout and edit it in 2Slides for your own investor or business review deck.
Datacenter and Communications revenue reached about $2.0 billion, up 79% YoY and 82% of total revenue. Scale-across / DCI revenue topped $200 million, and internal InP laser capacity doubled a quarter early. The PhotonLink co-packaged and near-packaged optics platform is expected to exceed $100 million in the March 2027 quarter and $250 million per quarter before the end of CY27. A new PhotonLink agreement is valued at about $20 billion over five years.
Coherent sold its Aerospace & Defense business (closed September 2, 2025) and its Munich, Germany business (closed January 30, 2026). The pro forma revenue and growth figures leave out the revenue from those businesses in every period, so the comparisons are like for like.
Original filed version of this presentation, dated November 4, 2026.
Company IR site listed on the deck's closing slide, with earnings releases, webcasts and SEC filings.

Create Your Own Slides
Turn your ideas into professional presentations in seconds with 2slides AI.
Reference professional designs, choose your style, and generate slides with perfect text rendering. Powered by Nano Banana—start creating your presentation now.
Your AI Agent for slides. Save time, shine faster with intelligent presentation creation.


© 2026 2slides. All rights reserved.