
Part of Investor presentation examples
Cisco Q1 FY27 Earnings Presentation — Cisco Systems' first-quarter fiscal 2027 conference call deck (quarter ended October 24, 2026; call dated November 12, 2026) covering record revenue of $18.5B, AI infrastructure momentum, the campus networking refresh, detailed GAAP and non-GAAP financials, and Q2 and full-year FY2027 guidance. All amounts are in US dollars (US$).
Uses this deck’s cover as a style reference for slides made from your own content. Or pick any page below to use its layout as the reference.
Quick Navigation
Tags
Share the slides
Cisco Q1 FY27 Earnings Presentation — Cisco Systems' first-quarter fiscal 2027 conference call deck (quarter ended October 24, 2026; call dated November 12, 2026) covering record revenue of $18.5B, AI infrastructure momentum, the campus networking refresh, detailed GAAP and non-GAAP financials, and Q2 and full-year FY2027 guidance. All amounts are in US dollars (US$).
Detailed view of each slide page, including layout, key content and visual elements.
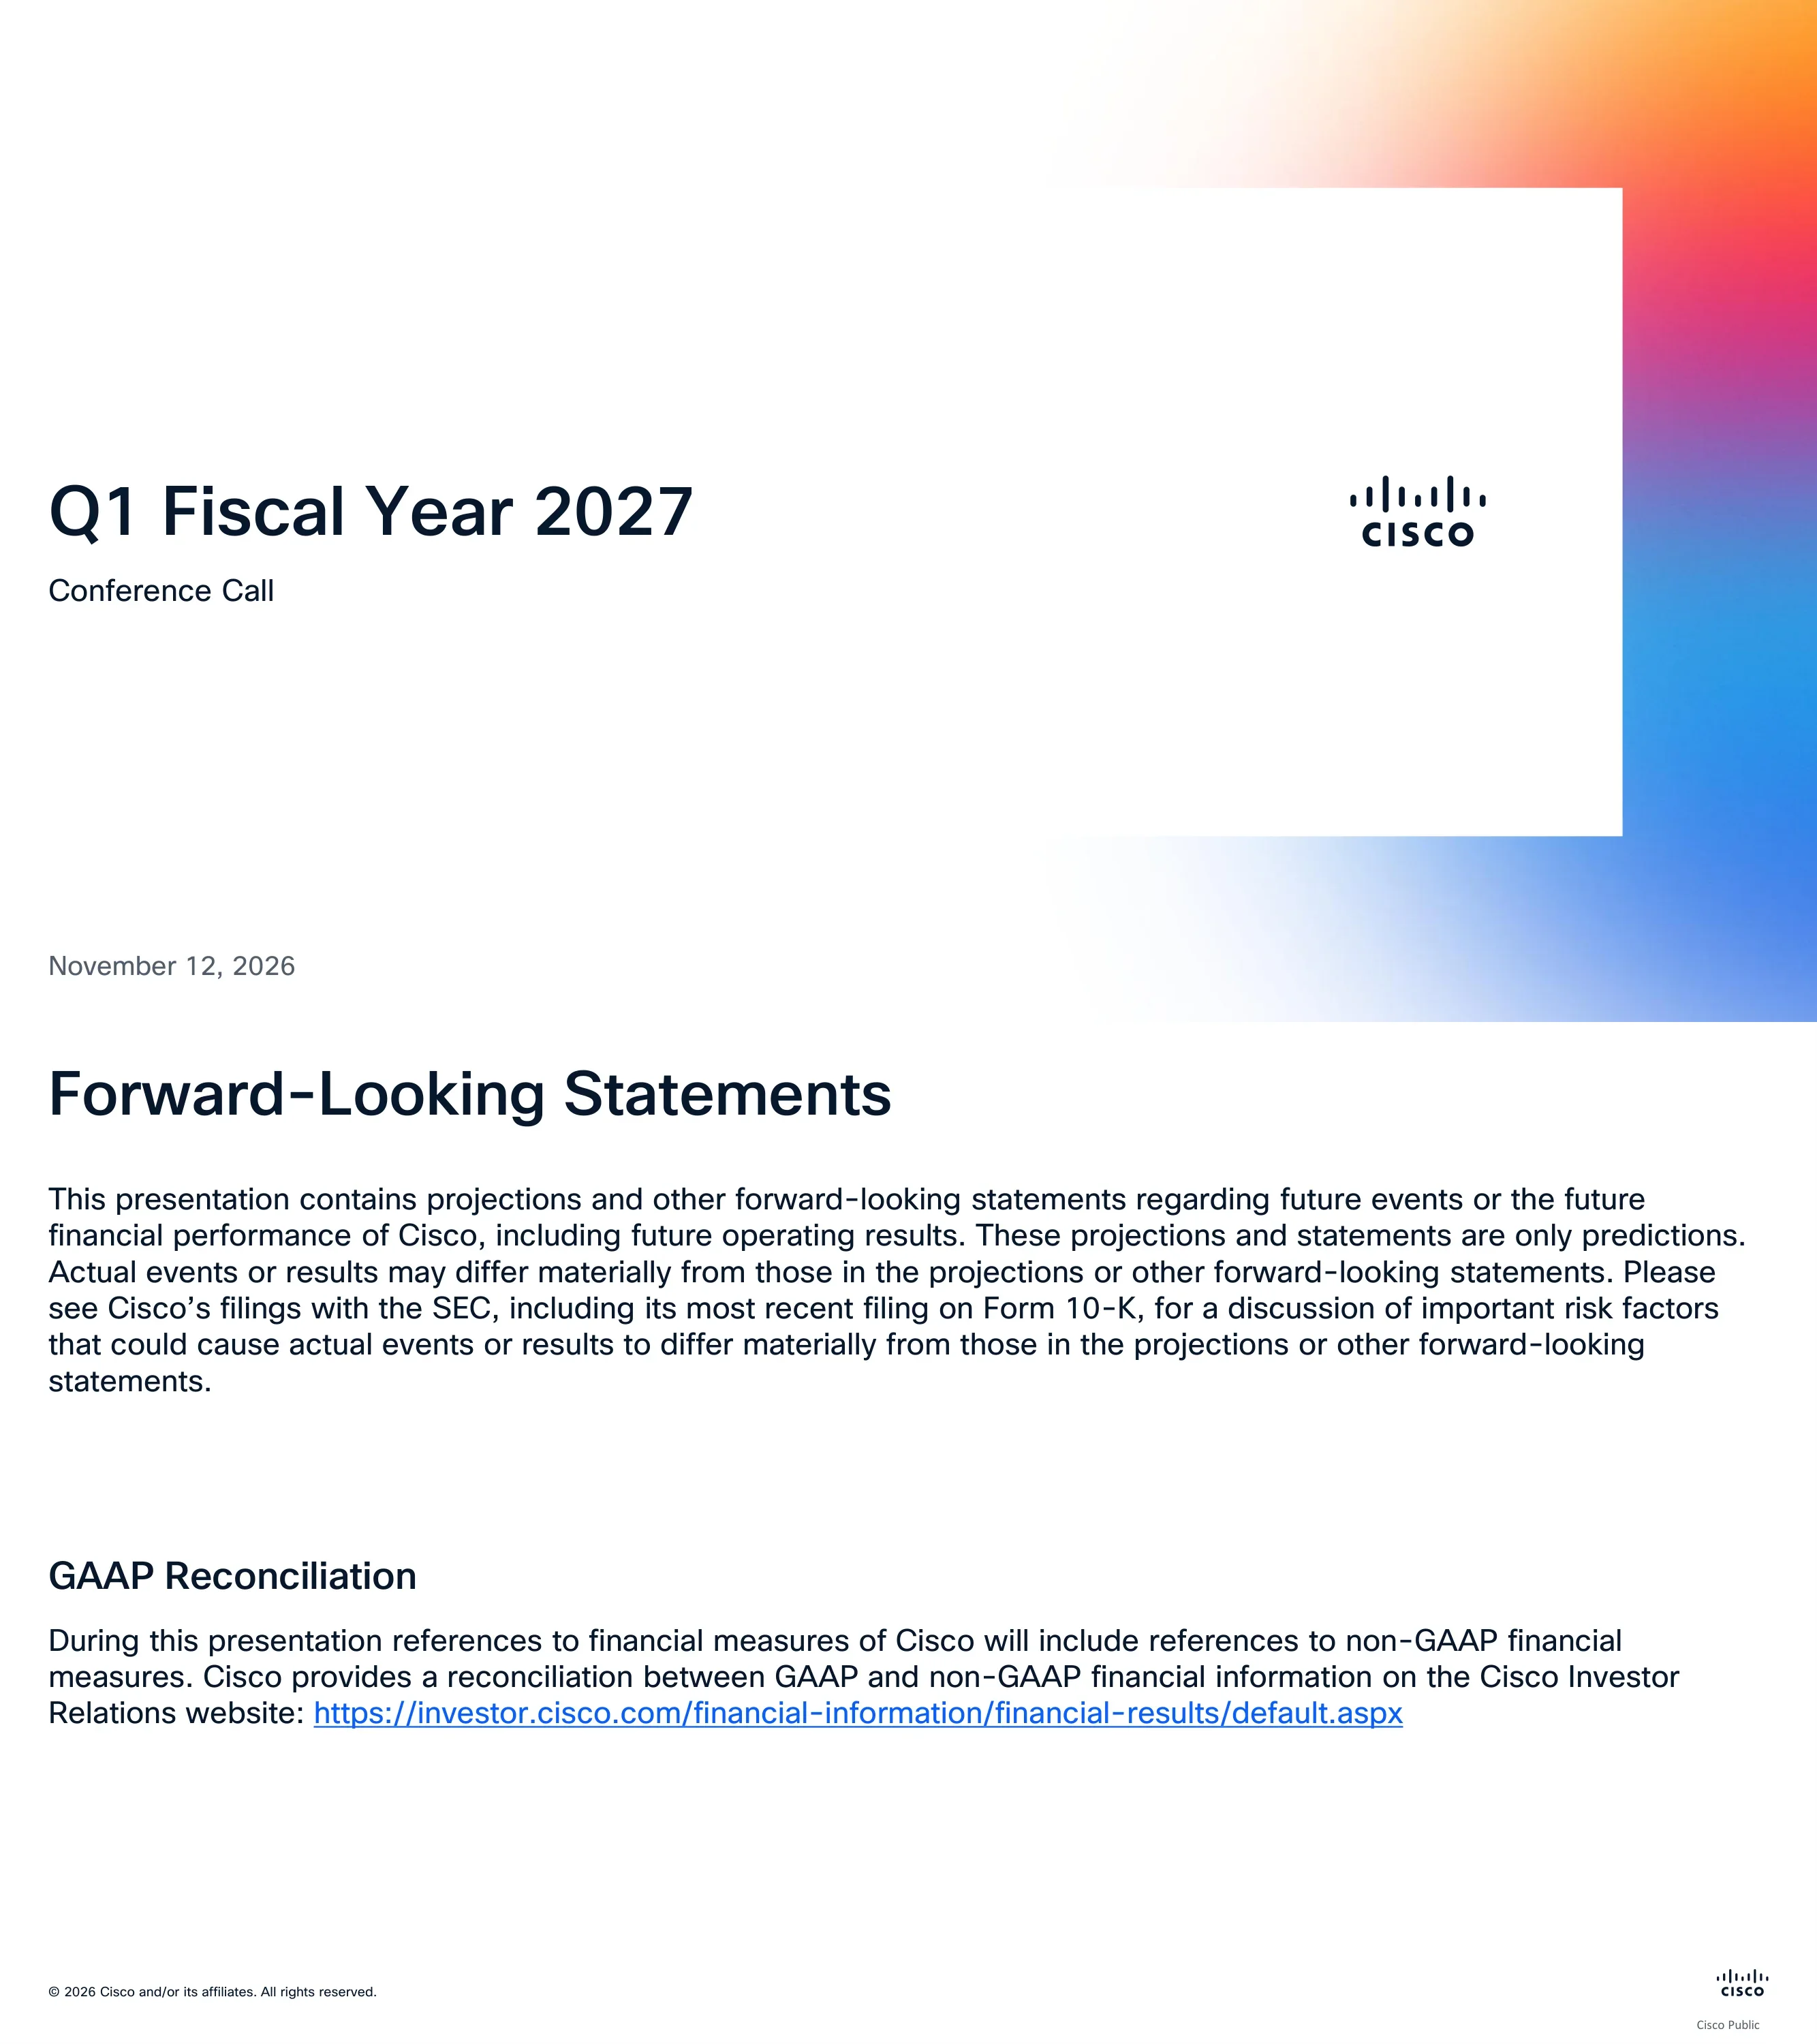
Title slide reading 'Q1 Fiscal Year 2027 – Conference Call' with the date November 12, 2026 and the Cisco logo.
Left-aligned title block with date at bottom left; white panel with Cisco logo on the right framed by an orange, pink and blue gradient.
Cautions that the presentation contains projections and forward-looking statements that may differ materially from actual results, pointing to Cisco's SEC filings including its most recent Form 10-K. A GAAP Reconciliation section says non-GAAP measures are reconciled on the Cisco Investor Relations website (investor.cisco.com financial results page).
Two stacked text blocks, each with a heading and paragraph, plus a hyperlink; copyright footer and Cisco Public marking.
Section divider introducing the business momentum and key trends part of the deck; no figures.
Large left-aligned title on white with the gradient burst at the right edge.
Three overlapping circles: Significant AI Momentum (expecting $9B of AI revenue from hyperscalers in FY27, more than double FY26; three new AI infrastructure design wins, 18 in the last 5 quarters), Strong Financial Performance (record revenue and non-GAAP EPS up 24% and 40% y/y; FY27 revenue and EPS guide raised to 19% and 27% growth at the midpoint; non-GAAP operating margin expected at 36%), and Robust Campus and DC Switching Growth (campus orders up 14% y/y; DC switching orders up double digits; a $100B+ network refresh opportunity).
Three overlapping circles with icons, headings and bolded key phrases; center circle highlighted in cyan.
Bulleted summary: $18.5B revenue up 24% y/y, non-GAAP EPS $1.40 up 40%, record non-GAAP operating income of $7.0B and margin of 37.8%; product orders up 21% y/y (14% excluding hyperscale); networking product orders up 28%; security ex-Splunk orders up mid-teens with firewall orders over 30% for a third quarter; $9B hyperscaler AI revenue expectation for FY27; campus orders up 14%; Industrial IoT orders up about 50%; $3.7B returned to shareholders, 95% of free cash flow.
Dense two-level bullet list with bold headline bullets and sub-bullets filling the slide.
Argues Cisco benefits from AI across public cloud, neocloud, enterprise private cloud and campus edge. Columns cover Hyperscalers (18 AI design wins in the last 5 quarters; $9B AI revenue in FY27), Neo/Sovereign Clouds and Enterprises (DC networking orders up double digits y/y; multi-billion dollar pipeline), and Campus/Workplace (orders up 14% y/y; new products under 10% of campus switching orders). A $100B+ network refresh opportunity is cited.
Intro paragraph, then a three-column panel under Data Center Infrastructure and Campus-Edge Infrastructure headers, with a bottom strip of six pill labels.
Describes agentic AI workloads raising network traffic by up to 450% versus humans and requiring multiple layers of security embedded in the network. A chart contrasts spiky chatbot traffic with persistently high agentic AI interactions under a +450% arrow. A note states the graphic is illustrative and not based on customer network data, citing the Cisco Report 2026: AI Impact on Wide Area Networks.
Text paragraph on top, then a two-panel illustrative area chart with a central +450% arrow and a footnote.
Four product photos (Catalyst 9000 Family, C9350 & C9610 Smart Switches, Wi-Fi 7 Access Points, Industrial IoT portfolio) above highlights: campus orders up 14% y/y; next-gen portfolio ramping faster than prior launches; new products under 10% of campus switching orders; wireless orders up over 20% with Wi-Fi 7 over 60% of access point orders; Industrial IoT orders up about 50% with ten consecutive double-digit quarters; a $100B+ refresh opportunity.
Row of four product images with dotted dividers on top; large blue-headed highlights box below.
Silicon One family from A-Series (Integrated Access) through K, E, P to G-Series (Scale within DC) along a Bandwidth arrow. Highlights: two new Silicon One P200-powered system design wins in Q1 FY27; line-of-sight to multiple design wins over the next six months across G300, G200, P200 and A100; Cisco-wide adoption of Silicon One expected by FY29. Images show the G300 102.4T chip, P200 51.2Tb chip, and 102.4T liquid and air cooled systems.
Five chip renders across the top with labels, a gradient Bandwidth arrow, a highlights box at lower left and four hardware photos at lower right.
AI scale-across connects GPU back-end fabrics across data centers, driving about 14x DCI bandwidth and 12,000-32,000 coherent ports versus 1,000-2,000 in traditional cloud. Three columns: Silicon One P200-powered systems (two design wins for a leading technology company in Q1 FY27), Optical Systems (NCS Series; OT3000 Series OLS coming soon) and Acacia coherent pluggables (highest Q1 orders on record for AI infrastructure; 800G-ZR revenues now exceed 400G-ZR).
Intro paragraph above three bordered columns with blue headers, each with text and product images; blog link in the footer.
Explains the bandwidth hierarchy: traditional DCI at 1x bandwidth needing 1,000-2,000 coherent ports; scale-across at about 14x needing 12,000-32,000 coherent ports; an order-of-magnitude port expansion. Diagram shows two data centers with CPU front ends (WAN/DCI 1x) and GPU back ends (Scale-Across 14x), plus a world map of distributed AI data centers.
Bullet list on top; lower left a bordered diagram of two data centers with arrows; lower right a map with linked data center icons.
Bar chart of AI infrastructure revenue in $ billions for FY24, FY25, FY26 and FY27E, with a '17X Growth' arrow and the FY27E bar labeled $9B. A footnote says FY27E reflects a raised expectation of about $9B from hyperscalers, up from about $7.5B estimated in Q4 FY26, and excludes neocloud, sovereign and enterprise AI revenue. Individual bar values for FY24 to FY26 are not labeled on the slide.
Full-slide four-bar column chart with a diagonal growth arrow overlay and a footnote below.
Section divider introducing the financial overview part of the deck; no figures.
Large left-aligned title with gradient burst at right.
Revenue by region for Q1 FY26, Q4 FY26 and Q1 FY27 in $M: Americas $8,989 / $10,396 / $11,506; EMEA 3,784 / 4,350 / 4,456; APJC 2,111 / 2,506 / 2,556; total $14,883 / $17,252 / $18,517. Total gross margin was 68.1% / 66.3% / 65.6% (Americas 64.1%, EMEA 68.9%, APJC 66.5% in Q1 FY27).
Rounded card with two side-by-side tables (Revenue and Total Gross Margin %) sharing region rows; current quarter column highlighted.
Revenue by category in $M with y/y growth: Networking $11,132 (43%), Security 2,120 (7%), Collaboration 1,136 (8%), Observability 279 (2%), Services 3,850 (1%), Total Cisco $18,517 (24%).
Centered rounded card with a two-column data table and a shaded total row.
In $B: remaining performance obligations $46.2 in Q1 FY27 (up 8%) versus $42.9 in Q1 FY26 and $46.7 in Q4 FY26; product RPO $23.4 (7%); services RPO $22.8 (9%). ARR was $32.7 (4%), with product ARR $18.0 (4%) and services ARR $14.7 (4%). A footnote defines ARR as a management operational metric.
Single table with dark header rows for RPO and ARR, y/y change rows beneath, and footnotes at bottom.
Total product orders were up 21% y/y. By geography: Americas 18%, EMEA 12%, APJC 57%. By customer market: Enterprise 15%, Public Sector 13%, Service Provider & Cloud 47%.
Rounded card with a headline figure and two side-by-side tables.
GAAP, Q1 FY27 versus Q1 FY26: revenue $18,517M (up 24%) vs $14,883M; product $14,667M, services $3,850M; gross margin 63.7% vs 65.5%; operating expenses $6,190M (33.4% of revenue); operating income 30.2% of revenue; net income $4,552M (up 59%); diluted EPS $1.14 (up 58%) vs $0.72.
Table with three quarter columns (Q1 FY26, Q4 FY26, Q1 FY27), bold primary rows and lighter sub-rows; current quarter highlighted.
Non-GAAP, Q1 FY27: revenue $18,517M (up 24%); gross margin 65.6% (product 63.7%, services 72.9%); operating expenses $5,140M (27.8% of revenue); operating margin 37.8%; net income $5,567M (up 39%); diluted EPS $1.40 (up 40%) versus $1.00 in Q1 FY26 and $1.22 in Q4 FY26.
Same table layout as the GAAP slide, with three comparison quarters and a highlighted current column.
In $M for Q1 FY27: cash, cash equivalents and investments $15,845; operating cash flow $4,357; inventory $6,384; inventory purchase commitments $21,883; deferred revenue $30,058 (product $14,012, services $16,046); software revenue $6,132. Q1 FY26 and Q4 FY26 comparatives are shown alongside.
Single table with alternating shaded rows and an indented deferred revenue breakdown; current quarter column highlighted.
Share repurchases $2,002M plus dividends paid $1,654M gave a total of $3,656M; dividend per share $0.42. Repurchases: 18M shares at an average price of $112.38. About $6.1B of authorization remained at the end of Q1 FY 2027.
Rounded card with two stacked tables (Total Capital Allocation and Share Repurchases) and a footnote.
Section divider introducing the guidance part of the deck; no figures.
Large left-aligned title with gradient burst at right.
Q2 FY27 guidance: revenue $18.0B to $18.2B; non-GAAP gross margin 65% to 66%; non-GAAP operating margin 36% to 37%; non-GAAP EPS $1.34 to $1.36. GAAP EPS is estimated at $1.07 to $1.09, with effective tax rates of about 14.5% GAAP and 18.5% non-GAAP.
Rounded card with a two-column guidance table, then three bullets of assumptions below.
FY27 guidance: revenue $74.8B to $75.8B and non-GAAP EPS $5.47 to $5.53. GAAP EPS is estimated at $4.38 to $4.44, with effective tax rates of about 16.0% GAAP and 18.5% non-GAAP.
Rounded card with a two-row guidance table and three explanatory bullets.
Section divider marking the question-and-answer portion of the call; no figures.
Short title on the left with the gradient burst at right.
Full safe-harbor text under the Private Securities Litigation Reform Act of 1995, listing risk factors such as tariffs, networking industry conditions, supply constraints and inventory, and referencing Cisco's Form 10-K filed on September 2, 2026. States that results for the three months ended October 24, 2026 are not necessarily indicative of future periods.
Title with a single full-width justified block of small body text.
Closing slide with only the centered Cisco logo on a white background.
Centered logo with ample white space.
Section divider introducing the supplemental materials, which hold the GAAP to non-GAAP guidance reconciliations; no figures.
Large left-aligned title with gradient burst at right.
Q2 FY27 reconciliation: GAAP gross margin 63%-64%, operating margin 27%-28%, EPS $1.07-$1.09. Adjustments: share-based compensation (1.0% gross margin, 5.0% operating margin, $0.14 EPS), acquisition-related amortization and costs (1.0%, 2.5%, $0.08), restructuring and other charges (none, 1.5%, $0.05). Non-GAAP: 65%-66%, 36%-37%, $1.34-$1.36. A footnote ties restructuring to a plan announced May 13, 2026.
Table with GAAP row, adjustment rows and non-GAAP total row across gross margin, operating margin and EPS columns; footnotes below.
FY27 reconciliation: GAAP operating margin 28%, EPS $4.38-$4.44. Adjustments: share-based compensation (5.0%, $0.63), acquisition-related amortization and costs (2.0%, $0.34), restructuring and other charges (1.0%, $0.11), (gains) and losses on investments (($0.01)), significant tax matters ($0.02). Non-GAAP: operating margin 36%, EPS $5.47-$5.53.
Table with GAAP row, five adjustment rows and a non-GAAP total row across operating margin and EPS columns; footnotes below.
Common questions about this slide and the underlying presentation content.
It covers Cisco Systems' first quarter of fiscal 2027, the three months ended October 24, 2026, and is dated for the conference call on November 12, 2026. Comparisons are shown against Q1 FY26 and Q4 FY26.
Revenue was $18,517M in US dollars (up 24% y/y), non-GAAP EPS was $1.40 (up 40%), non-GAAP operating margin was 37.8%, GAAP net income was $4,552M with diluted EPS of $1.14, and $3.7B was returned to shareholders.
Q2 FY27 guidance is revenue of $18.0B to $18.2B and non-GAAP EPS of $1.34 to $1.36. FY27 guidance is revenue of $74.8B to $75.8B and non-GAAP EPS of $5.47 to $5.53. GAAP to non-GAAP reconciliations are in the supplemental materials.
These are the earnings slides Cisco published on its investor relations site (investor.cisco.com) for the Q1 FY2027 earnings call on November 12, 2026. This page is a reference copy for study and benchmarking.
There are 30 slides: title and forward-looking statements, Business Momentum & Key Trends (takeaways, summary, AI supercycle, campus refresh, Silicon One, AI scale-across, AI revenue chart), Financial Overview (revenue, RPO and ARR, orders, GAAP and non-GAAP income statements, key measures, capital allocation), Guidance, Q&A, and Supplemental Materials with reconciliations.
Cisco now expects about $9B of AI infrastructure revenue from hyperscalers in FY27, more than double FY26 and up from about $7.5B estimated in Q4 FY26. It reports three new AI design wins in Q1, bringing the total to 18 in the last five quarters.
Yes. You can use the slides as a structural reference for your own earnings or investor presentation, such as takeaway circles, financial tables, guidance slides and reconciliation layouts. Cisco's name, logo and financial figures belong to Cisco, so replace them with your own content.

Create Your Own Slides
Turn your ideas into professional presentations in seconds with 2slides AI.
Reference professional designs, choose your style, and generate slides with perfect text rendering. Powered by Nano Banana—start creating your presentation now.
Your AI Agent for slides. Save time, shine faster with intelligent presentation creation.


© 2026 2slides. All rights reserved.