
Part of Investor presentation examples · Australian investor presentation examples
Champion Iron Investor Presentation November 2026 — a 27-slide investor deck from Champion Iron Limited (ASX/TSX: CIA, OTCQX: CIAFF), lodged with the ASX on November 15, 2026, covering its high-purity iron ore assets in Québec's Labrador Trough (Bloom Lake) and Norway (Rana Gruber), the ramp-up of the Bloom Lake Direct Reduction Pellet Feed (DRPF) project, iron ore market and freight dynamics, Q2/FY27 segmented and consolidated results, balance sheet and liquidity as at September 30, 2026, and growth options at the Kami Project and Cluster II properties.
Uses this deck’s cover as a style reference for slides made from your own content. Or pick any page below to use its layout as the reference.
Quick Navigation
Tags
Share the slides
Champion Iron Investor Presentation November 2026 — a 27-slide investor deck from Champion Iron Limited (ASX/TSX: CIA, OTCQX: CIAFF), lodged with the ASX on November 15, 2026, covering its high-purity iron ore assets in Québec's Labrador Trough (Bloom Lake) and Norway (Rana Gruber), the ramp-up of the Bloom Lake Direct Reduction Pellet Feed (DRPF) project, iron ore market and freight dynamics, Q2/FY27 segmented and consolidated results, balance sheet and liquidity as at September 30, 2026, and growth options at the Kami Project and Cluster II properties.
Detailed view of each slide page, including layout, key content and visual elements.
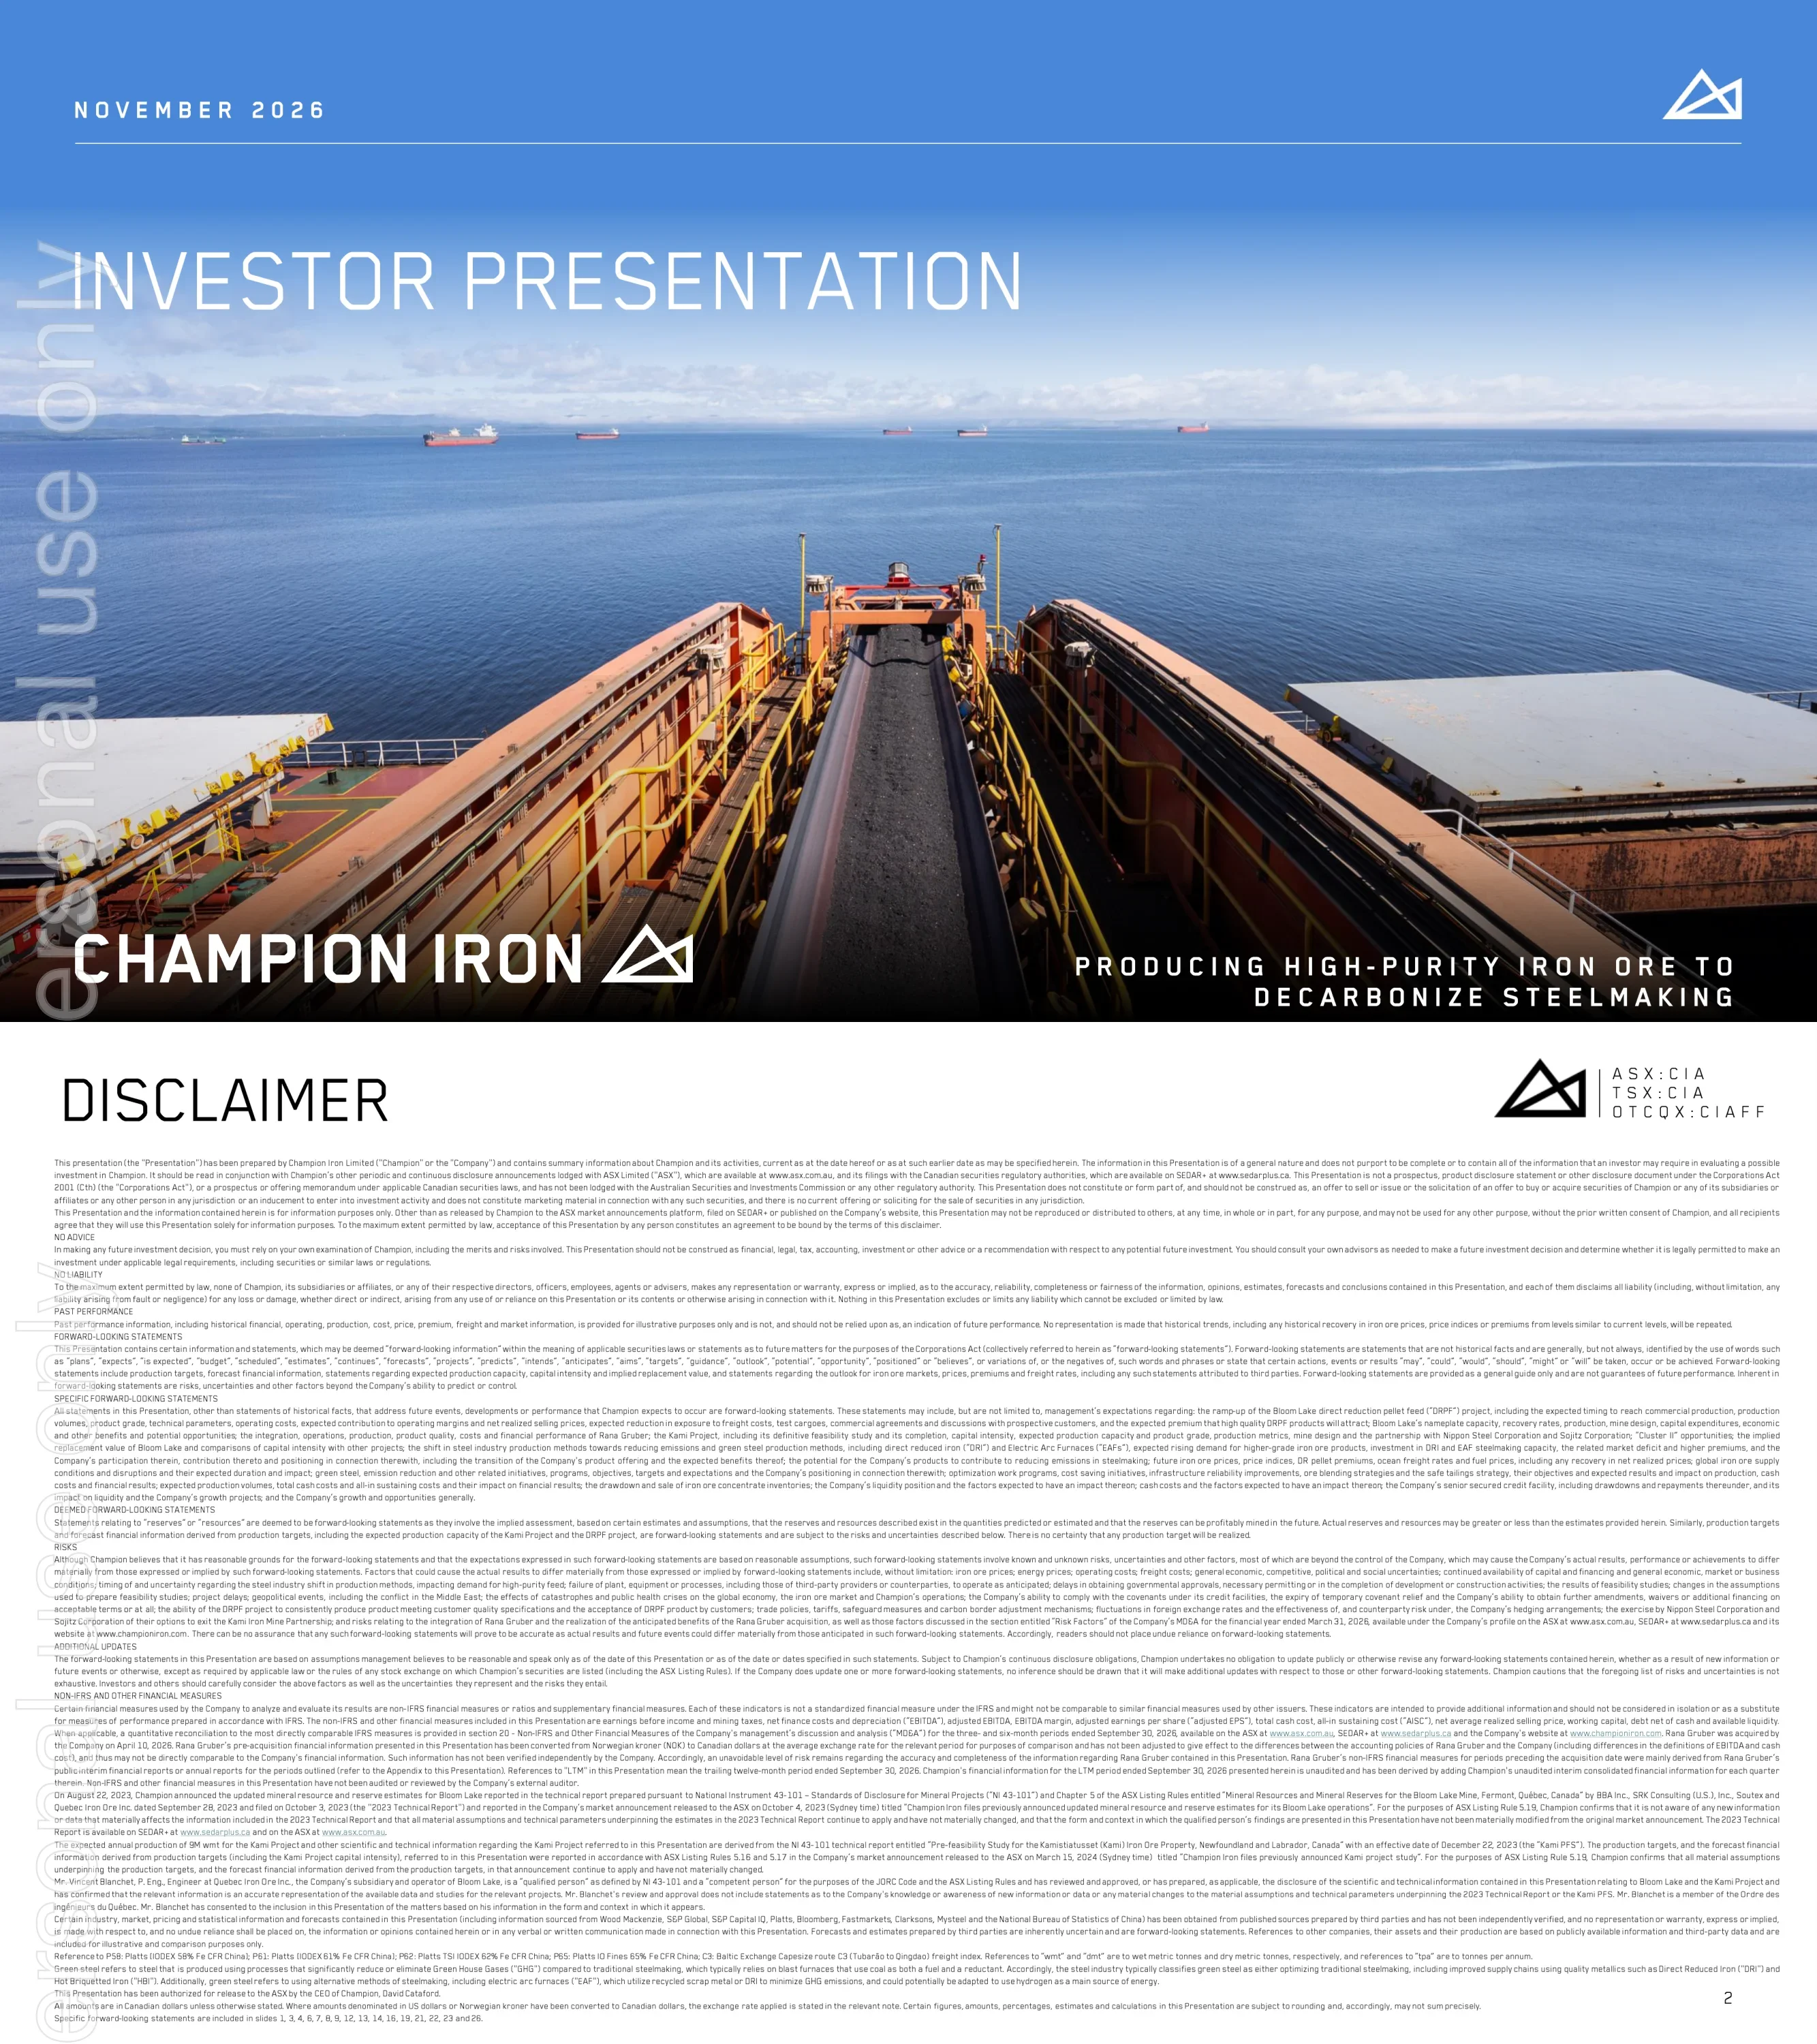
Cover slide for Champion Iron's November 2026 investor presentation. The tagline reads 'Producing high-purity iron ore to decarbonize steelmaking'.
Full-bleed photo cover with title text over a blue sky band and company wordmark bottom-left
Standard legal disclaimer covering no advice/liability, forward-looking statements, non-IFRS measures, NI 43-101/JORC qualified person (Vincent Blanchet, P.Eng.), and third-party data sources. It states all amounts are in Canadian dollars unless otherwise stated, LTM means the trailing twelve months ended September 30, 2026, and Rana Gruber was acquired on April 10, 2026.
Dense full-page text in small print
Champion reports consolidated average EBITDA of C$588M over the last 5 financial years (excluding Rana Gruber), with Bloom Lake Phase II completed in 2022. Amounts are in Canadian dollars (C$). The DRPF project is complete (excluding ramp-up costs) and ramping up. Strategic shareholders are La Caisse (8.5%), the Government of Québec (7.8%) and management (7.3%). Enterprise value is ~C$2.3B against ~C$6.6B of cumulative investments at Bloom Lake, and the company has >1,800 employees, including >1,400 in Québec.
Bulleted key points on top with three photos in a row below and footnotes
Four asset tiles: Bloom Lake Mine (~15M tpa, 66.2% Fe hematite; DRPF project up to 69% Fe in ramp-up), the Kami Project (9M tpa project over 67.5% Fe, feasibility study ongoing with Nippon Steel and Sojitz), Rana Gruber Mine (~1.8M tpa hematite and magnetite, confirmed ability to produce 65% Fe hematite) and the Cluster II properties (sizeable opportunities for high-purity iron ore development).
2x2 grid of asset tiles, each pairing a photo with a coloured information panel
A map of the Labrador Trough shows Champion's Bloom Lake alongside IOC (Carol Lake), ArcelorMittal Canada (Mount-Wright and Fire Lake), Tacora (Scully Mine) and Tata Steel Metals Canada. The region has a mining workforce and operating ecosystem dating back to the 1950s. Integrated rail, port, road and hydroelectric infrastructure connects the mines year-round to seaborne markets via Sept-Îles/Pointe-Noire and Port-Cartier.
Large satellite map on the left with railway legend; bullets and operator colour legend on the right
A timeline runs from the 2017–2018 Phase I optimization, through the 2019 buyback of the Government of Québec's stake in Bloom Lake, 2021 redemption of La Caisse preferred equity, 2022–2024 Phase II completion, and 2024–2026 DRPF construction, to the 2026 Rana Gruber acquisition. A waterfall of cash sources and uses since FY2017 (C$M) shows cumulative operating cash flows exceeding C$3.2B, approximately C$2.3B invested in growth projects, C$211M for the 2019 Québec stake buyback, and cash of C$214M at Q2/FY27. Individual bar values for equity/debt issuances, dividends, other and Rana Gruber acquisition are not labelled.
Timeline bullets on the left, waterfall chart on the right, black takeaway banner at the bottom
Europe and MENA continue to invest in DRI/EAF steelmaking capacity. European governments provided over €15B to support 18 DRI/EAF projects. In MENA, DRI capacity is set to double in the GCC near-term, and the GCC is expected to account for nearly half of global DRI trade by 2050. MENA DRI projects shown: Saudi Arabia 28.4 MTPY, Oman 12.5 MTPY, Libya 10.1 MTPY, Algeria 4.3 MTPY, UAE 2.5 MTPY and Mauritania 1.7 MTPY.
Two side-by-side panels (Europe and MENA), each with bullets and a map
A bubble chart plots global producing iron ore assets (2026 data) by Fe content against gangue content. It places current Bloom Lake (66.2% Fe), Bloom Lake DRPF (69% Fe) and Rana Gruber (65.2% average) in the high-purity zone, ahead of mostly Australian lower-grade supply. Average price basis over the last 5 full calendar years, in US$: P58 index US$106/t, P62 US$122/t, P65 US$139/t, and DR pellet index (P65 + premium) US$194/t.
Full-width bubble chart with quality bands on the right and a price-basis row below
Side-by-side 2015 vs 2026 bubble charts for Australia's Big 3 producers show weighted average acid gangue rising from 6.5% to 7.5%, a 16% increase over eleven years. Bloom Lake (66.2% Fe), DRPF (69% Fe) and Rana Gruber are shown at far lower contaminant levels. High-purity ore is increasingly important for DRI/EAF and for blending in BF/BOF steelmaking.
Two comparative bubble charts with a black takeaway banner
A 2009–2026 chart of the P65 index and C3 freight (US$/t), with C3 as a % of P65 against its long-run average, shows freight rates and iron ore prices historically maintain a strong relationship. The key message is that the C3 freight index relative to P65 recently reached abnormally elevated levels. Exact point values are not labelled on the chart.
Full-width dual-axis time-series chart with a black banner
Net realised price indices are at or near historical lows (inflation-adjusted, US$/t). For Canada, P65 minus C3×1.25 is US$61/t in November 2026 versus a historical low of US$48/t in December 2015. For Norway, P61 minus C3 is US$55/t in November 2026, below the previous historical low of US$64/t in July 2022.
Two stacked line charts, each with a country flag on the right
Five supply disruptions are profiled. The Middle East conflict and Hormuz Strait disruption removed seaborne high-purity supply and hit pellet markets. A Canadian high-purity producer entered CCAA restructuring, delaying an expansion of up to 18M tpa. A Ukrainian pellet producer faces funding and war impacts. At least 6 Brazilian producers suspended or reduced high-purity production, and China's run-of-mine output fell 10.3% YoY in Jan–Sept 2026.
Grid of five cards, each with a flag icon, a black status bar and bullets
From October 2025 to September 2026, the DR pellet premium (US$/dmt, P65 basis, right axis) stepped up several times while P65 softened (left axis). Management views this as reflecting a continued supply shortage of DR-quality material. Step values are not labelled; only axis gridlines are shown.
Dual-axis chart with a shaded P65 area and step line, plus a black banner
A chart of Champion's enterprise value from 2022 to 2026 (C$M) compares C$4.2B (January 2023, Phase I only at 7.4Mt) with C$2.3B (October 30, 2026), now with two plants (15 Mt), up to 69% Fe capability and Rana Gruber (1.8 Mt). Cumulative Bloom Lake investment is ~C$6.6B. Average annual consolidated EBITDA was C$588M over the last 5 full financial years.
Line chart with dashed callout boxes, a grey side box and a black bottom banner
Section divider introducing the segment and consolidated financial results.
Full-bleed photo with large outlined title text
LTM concentrate production was 14.0M wmt, 93.1% of the 15M wmt nameplate capacity. Q2/FY27 production was impacted by DRPF commissioning inefficiencies. Q2/FY27 total cash cost was C$82.5/dmt, driven by fuel prices, DRPF transition processing costs and lower volumes; the LTM cash cost bar shows $80.4. Expected cost tailwinds are DRPF ramp-up completion, inventory drawdown, reliability improvements, cost savings and diesel stabilization. FY19–FY26 bar values are not labelled.
Bullets top-left, production bar chart bottom-left, cash cost bar chart top-right, bullets bottom-right
Rana Gruber produces about 1.8M tpa, with 5-year average net profit of C$60M/year and EBITDA of C$95M/year. Q2/FY27 production was 0.5M wmt (+40% QoQ), with total cash cost C$85.3/dmt sold, AISC C$97.1/dmt, net average realized price C$92.5/dmt and revenues of C$54.3M. Charts show 2020–2025 production (1.6–1.9 Mt), cash cost rising from 61 to 80 C$/t, and EBITDA margins from 58% (2020) to 37% (2025).
Bulleted highlights on top with two combo charts below
Q2/FY27 revenues were C$403.9M, with adjusted EBITDA C$23.3M, EBITDA C$3.7M, adjusted EPS C$(0.06) and EPS C$(0.09). Results were hit by lower indexes, higher ocean freight, elevated fuel, derivative fair value changes (C$7.9M), Rana Gruber inventory adjustments (C$4.8M) and DRPF start-up costs (C$6.9M). Total cash cost was C$82.9/dmt and AISC C$97.9/t. Charts show LTM EBITDA of C$303.2M and LTM net income of C$(1.7)M; FY22–FY26 bar values are not labelled.
Bullets on the left, two stacked bar charts on the right
The balance sheet shows C$214.4M cash, C$53.3M cash in the Kami Iron Mine Partnership, C$122.2M working capital and C$1,303.1M short- and long-term debt. Debt net of cash is C$913.2M and available loans are C$404.1M (including a US$315M revolving facility), for total liquidity of C$794.0M. The company expects support from selling 1.3M wmt of concentrate inventories and has amended covenants under its senior secured credit facility.
Two icon-led panels on top, a four-column text band, and a stacked horizontal bar
Section divider introducing DRPF and growth project updates.
Full-bleed photo with large outlined title text
The DRPF project was completed within its C$500M budget (excluding ramp-up costs) and is ramping up as planned toward commercial production by the end of FY2027. Q2/FY27 volumes were comparable to Q1/FY27 despite planned maintenance, and product grade continued to approach target specifications. Additional test cargoes and commercial agreements were secured for Q3/FY27 shipments.
Bullets on the left; one large and two small labelled photos on the right
A claims map shows Bloom Lake, the Kami Project, Moiré Lake and Cluster II near Fermont and Wabush. Kami is near Bloom Lake infrastructure and partnered with Nippon Steel and Sojitz. Cluster II, within 60 km south of Bloom Lake, is described as one of the largest undeveloped hubs of high-purity iron ore resources globally.
Large claims map on the left; two black-headed text panels on the right
Kami's capital intensity of US$331/wmt is competitive with the US$328/wmt average of recently completed high-grade greenfield concentrate projects. Those projects' capital intensity implies a Bloom Lake replacement value of US$4.9B, based on 15M wmt per annum. A capex intensity curve (2014–2022, US$/wmt vs capacity Mt) highlights Kami, which would produce DR-quality pellet feed.
Two bullets on top with a stepped capex-intensity cost curve below
A culture slide titled 'Upholding our values for a sustainable future', featuring four employees. It presents the company values Transparency, Respect, Ingenuity and Pride.
Dark starry background with four overlapping circular portraits and value labels
Closing slide with contact details: info@championiron.com, +1 514-316-4858, 1155 René-Lévesque West, Suite 3300, Montréal, QC, and www.championiron.com.
Full-bleed dusk aerial photo with large title and contact block
BF-BOF steelmaking emits ~2.2t CO2e/t, while DRI-EAF emits 0.3–1.0t CO2e/t. Bloom Lake's 66.2% Fe concentrate enables ~10% emissions reduction in BF-BOF. DRPF at 69% Fe enables the DRI-EAF route, and EAFs can cut emissions up to 7x versus BF-BOF.
Process-flow table with Method, Inputs, Process and Champion's Impact columns across two shaded rows
Tables reconcile Rana Gruber's EBITDA and cash cost for 2020–2025 in NOK thousands, converted to CAD. EBITDA in CAD thousands runs from 127,103 (2020) to 77,182 (2025), with margins of 58% to 37% and a 5-year average EBITDA of C$95,461 thousand (2021–2025). Cash cost per tonne produced rises from 427 to 596 NOK, or 61 to 80 CAD.
Two financial tables on the left with definition text on the right
Common questions about this slide and the underlying presentation content.
It is a 27-slide investor deck from Champion Iron Limited (ASX/TSX: CIA), lodged with the ASX on November 15, 2026. It covers its Bloom Lake and Rana Gruber operations, the DRPF project ramp-up, iron ore market conditions, Q2/FY27 results, liquidity and growth projects such as Kami and Cluster II.
Champion's fiscal year ends March 31, so FY27 is the year ending March 31, 2027, and Q2/FY27 is the quarter ended September 30, 2026. LTM figures cover the twelve months ended September 30, 2026.
All amounts are in Canadian dollars (C$) unless otherwise stated. Index prices, freight and Kami capital intensity are shown in US$, and Rana Gruber's pre-acquisition data is in NOK converted to CAD.
Revenues were C$403.9M, adjusted EBITDA C$23.3M, EBITDA C$3.7M, adjusted EPS C$(0.06) and EPS C$(0.09). Total cash cost was C$82.9/dmt and all-in sustaining cost C$97.9/t.
The Direct Reduction Pellet Feed project upgrades half of Bloom Lake's capacity to up to 69% Fe for DRI/EAF steelmaking. It was completed within its C$500M budget (excluding ramp-up costs) and is expected to reach commercial production toward the end of FY2027.
As at September 30, 2026, Champion had C$214.4M cash, C$53.3M cash in the Kami Iron Mine Partnership, C$122.2M working capital and C$404.1M available loans, for total liquidity of C$794.0M. Debt net of cash was C$913.2M.
The deck highlights the Kami Project, a 9M tpa project over 67.5% Fe in partnership with Nippon Steel and Sojitz, with capital intensity of US$331/wmt. It also highlights Cluster II, within 60 km south of Bloom Lake, described as one of the largest undeveloped high-purity iron ore hubs globally.
DRI-EAF steelmaking emits 0.3–1.0t CO2e/t versus ~2.2t for BF-BOF and needs DR-quality feed. Few producers can supply it, and the deck shows contaminants at Australia's major producers rose 16% over eleven years while the DR pellet premium has risen.

Create Your Own Slides
Turn your ideas into professional presentations in seconds with 2slides AI.
Reference professional designs, choose your style, and generate slides with perfect text rendering. Powered by Nano Banana—start creating your presentation now.
Your AI Agent for slides. Save time, shine faster with intelligent presentation creation.


© 2026 2slides. All rights reserved.