
Part of Investor presentation examples
CapitaLand Investment Q3 2026 Business Update Presentation: the 12-page '3Q 2026 Business Updates' deck that CapitaLand Investment Limited (SGX: 9CI), the Singapore-listed real estate investment manager, lodged with SGX on 4 November 2026. It reports YTD September 2026 fee-related revenue up 15% YoY to S$1,035M (S$ = Singapore dollars), c.S$4.3B of equity raised, c.S$9.6B deployed and c.S$5.7B divested, plus segment detail on listed funds, private funds, commercial management, lodging management, the balance sheet and the FeeCo / China AssetCo split.
Uses this deck’s cover as a style reference for slides made from your own content. Or pick any page below to use its layout as the reference.
Quick Navigation
Tags
Share the slides
CapitaLand Investment Q3 2026 Business Update Presentation: the 12-page '3Q 2026 Business Updates' deck that CapitaLand Investment Limited (SGX: 9CI), the Singapore-listed real estate investment manager, lodged with SGX on 4 November 2026. It reports YTD September 2026 fee-related revenue up 15% YoY to S$1,035M (S$ = Singapore dollars), c.S$4.3B of equity raised, c.S$9.6B deployed and c.S$5.7B divested, plus segment detail on listed funds, private funds, commercial management, lodging management, the balance sheet and the FeeCo / China AssetCo split.
Detailed view of each slide page, including layout, key content and visual elements.
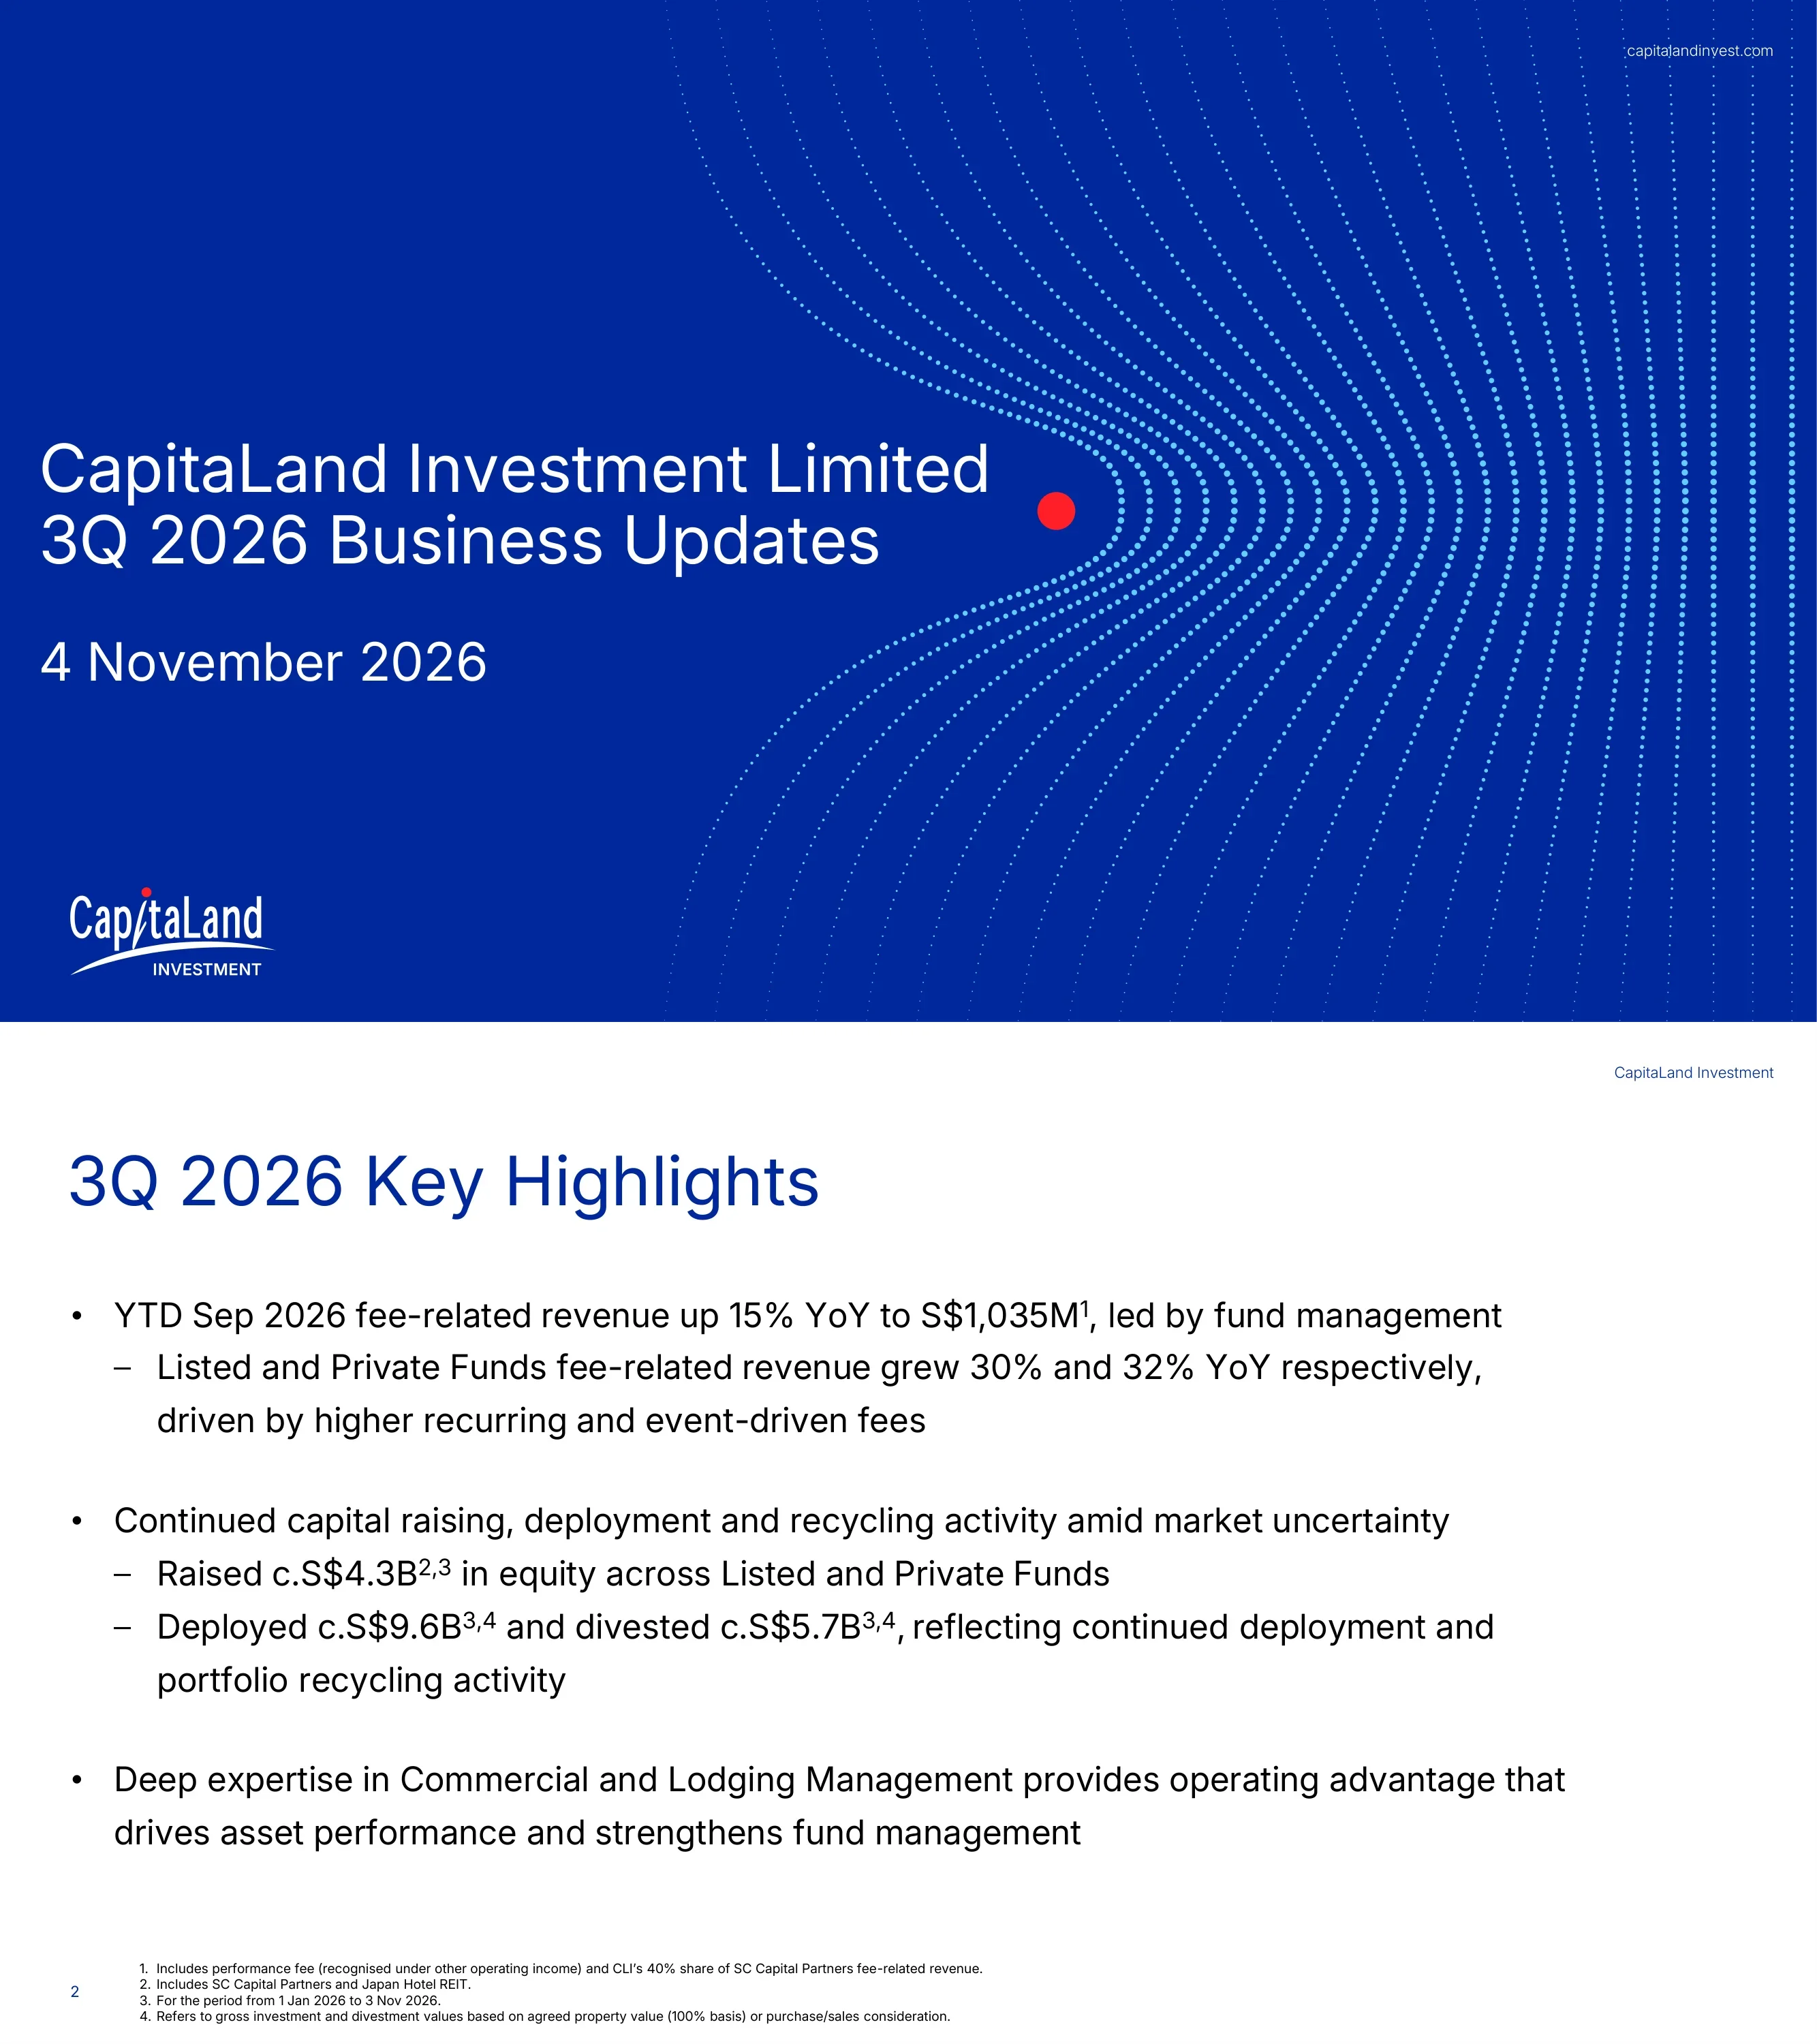
Cover slide titled 'CapitaLand Investment Limited 3Q 2026 Business Updates', dated 4 November 2026, with the CapitaLand Investment logo and capitalandinvest.com web address.
Full-bleed royal blue background; left-aligned white title and date at mid-height; right half filled with a curved dotted wave pattern converging on a red dot; logo bottom left, URL top right.
Three headline messages: YTD Sep 2026 fee-related revenue up 15% YoY to S$1,035M, led by fund management, with Listed and Private Funds fee-related revenue up 30% and 32% YoY on higher recurring and event-driven fees; c.S$4.3B of equity raised across Listed and Private Funds, c.S$9.6B deployed and c.S$5.7B divested amid market uncertainty; and deep Commercial and Lodging Management expertise as an operating advantage. Footnotes state the fee figure includes performance fees and CLI's 40% share of SC Capital Partners, the capital figures include SC Capital Partners and Japan Hotel REIT, cover 1 Jan to 3 Nov 2026, and transaction values are gross (100% basis).
White text slide with large blue title, three bullet points each with dash sub-bullets, and a four-line footnote block at the bottom.
Three-panel overview. Left: fee-related revenue rose from S$900M to S$1,035M (Listed Funds Management 258 to 336, Private Funds Management 101 to 133, Commercial Management 282 to 304, Lodging Management 259 to 262, S$M). Centre: total revenue of S$1.5B, down 3% YoY, split 63% fee business and 37% investment business (excluding Corporate & Others of -S$62M). Right: real estate investment business (REIB) revenue fell 23% YoY from S$753M to S$580M (Non-Fund Investments 622 to 431, Listed Funds 104 to 118, Private Funds 27 to 31) owing to the absence of contributions after divestments and deconsolidation.
Three columns under a single title: stacked bar chart on the left, donut chart in the centre, stacked bar chart on the right; colour legends below each chart and two-column footnotes.
Fee-related revenue by segment, YTD Sep 2025 vs 2026 (S$M): Listed Funds Management +30% (258 to 336; recurring 227 to 251, event-driven 31 to 85) on stronger recurring and event-driven fees; Private Funds Management +32% (101 to 133; recurring 96 to 105, event-driven 5 to 28) on the credit business, SC Capital Partners and higher performance fees; Commercial Management +8% (282 to 304) on leasing momentum and margin improvement; Lodging Management +1% (259 to 262; recurring 249 to 257, event-driven 10 to 5). Side panel: total fee-related revenue S$1,035M (+15%; YTD Sep 2025: S$900M), all-in FRR/FUM 89 bps (FY 2025: 85 bps) and fund management FRR/FUM 56 bps (FY 2025: 52 bps), both on an LTM basis.
Four paired bar charts in a row, each headed by segment name, YoY change and a one-line driver; light blue summary panel on the right with three stacked KPIs; footnotes at the bottom.
Left panel, value of effective stakes by holding structure (S$B, FY 2025 to YTD Sep 2026): Listed Funds carrying value stable at 8.2; Private Funds carrying value stable at 5.2 to 5.3; Non-Fund Investments open market value down from 3.9 to 3.5 after divesting CapitaMall LuOne and Arlington Park. Right panel repeats REIB revenue by segment (S$753M to S$580M, -23% YoY), explained by the absence of contributions from Synergy and Dalian IT Park, partly offset by the One iPark development-for-sale assets.
Two boxed panels: left light-blue panel with three rows of 'from to' values joined by arrows and change figures; right outlined panel with explanatory text above a stacked bar chart.
Three numbered themes for the listed REIT and business-trust platform: 01 Deploy, S$7.2B invested across commercial, business parks and logistics, living and digital infrastructure; 02 Value Creation, S$3.5B of divestments of mature and non-core assets plus asset enhancement initiatives (AEIs); 03 Fund, broadening domestic capital access with the planned listing of CapitaLand Commercial C-REIT II by end-2026, subject to market conditions. Chart: listed-fund transaction activity of S$10.7B YTD 2026 (7.2 investments, 3.5 divestments) vs S$4.8B YTD 2025 (3.6 and 1.2), described as a more than 2x YoY increase. Excludes Japan Hotel REIT; YTD 2025 is 1 Jan to 5 Nov 2025, YTD 2026 is 1 Jan to 3 Nov 2026.
Left column of three numbered sections separated by thin rules; right light-blue panel with a two-bar stacked chart and a bold takeaway line beneath.
01 Raise: c.S$2B raised across commercial, living and credit strategies from insurers, financial institutions and sovereign wealth funds, and ACP III launched to extend the Asia Pacific real estate credit franchise. 02 Deploy: a Hong Kong student accommodation platform seeded with a Sheung Wan conversion of c.1,200 beds, and China Rental Housing Fund I (RMB1.2B), the third sub-fund of the CLI RMB Master Fund. 03 Realise: divestments of International Tech Park Chennai, Radial Road, and a partial stake in Icon Samseong in Seoul. Chart of capital raised by strategy (S$B): 2.1 YTD 2025 vs 2.0 YTD 2026, with commercial 0.9, living and hospitality 0.6 and credit 0.5 in both periods and other (SC Capital Partners funds) 0.1 vs 0.01.
Left column of three numbered sections with dash bullets; right light-blue panel with a two-period stacked bar chart and four-colour legend.
Asset enhancement initiatives by market. Singapore: AEIs and redevelopment completed at Tampines Mall, Aperia Mall and 27 IBP, with phased works under way at Capital Tower, Kallang Wave Mall and Plaza Singapura & The Atrium@Orchard. China: targeted AEIs at CapitaMall SKY+, Raffles City Shenzhen and Raffles City Changning, and the third-party management franchise expanded with the opening of Bi Xiang Chu Xiang (碧湘楚巷), a riverside lifestyle precinct in Changsha. India: AEIs at International Tech Park Bangalore, Chennai Taramani and Hyderabad to strengthen Grade A positioning for global capability centre (GCC) occupiers.
Text-heavy left two-thirds grouped by country headings; right column of three stacked captioned photos.
01 Signings: c.11,700 rooms signed across over 50 properties, taking the total pipeline to c.68,300 rooms YTD Sep 2026, with conversions c.32% of rooms signed. 02 Openings: c.5,600 rooms opened across over 30 properties, growing the operational portfolio to c.114,700 rooms, conversions c.48% of rooms opened. 03 RevPAR: YTD Sep 2026 RevPAR up 1% YoY on higher occupancy (+2pp), partly offset by average daily rates down 1%. Side panel: 12 signings YTD (to 31 Oct 2026) lift the Vietnam portfolio to c.12,300 rooms across 45 properties in 15 cities, including Vietnam debuts of Oakwood Premier and The Crest Collection; Oakwood Premier YAESU CORE Tokyo, opening 2029, will make six Ascott-managed properties near Tokyo Station.
Left column of three numbered sections with footnotes; right light-blue panel with two bold sub-headings, bullet text and two captioned renderings.
Available debt headroom chart: at net debt/equity of 0.46x today, headroom rises to S$3.3B at 0.7x and S$6.0B at 0.9x (assuming equity as at 30 Sep 2026). KPI tiles: net debt/equity 0.46x (FY 2025: 0.43x); interest coverage ratio 4.1x on an LTM basis (FY 2025: 4.2x); implied borrowing cost 3.5% p.a. (FY 2025: 3.9%); fixed-rate debt 71% (FY 2025: 72%); average debt tenure 2.8 years (FY 2025: 3.1 years); operating cashflow S$721M including dividends from associates and JVs (YTD Sep 2025: S$646M).
Left half: scenario bar chart with dashed baseline at the current leverage; right half: 2x3 grid of KPI tiles separated by blue rules; footnotes bottom left.
Strategic priorities for the two parts of the group. FeeCo: scale the dual growth engine of Listed and Private Funds to grow recurring earnings, and keep using Commercial and Lodging Management expertise to drive fees and asset performance. China AssetCo: advance monetisation through capital recycling platforms including C-REITs, P-REITs and RMB Master Funds as well as third-party sales, and pursue longer-term strategic pathways for China AssetCo.
Two horizontal rows, each with a coloured chevron icon badge on the left (navy for FeeCo, teal for China AssetCo) and a bold heading with dash bullets on the right.
Closing slide pairing the disclaimer with a 'Thank You' message. The disclaimer covers forward-looking statements and their risks (economic conditions, interest rates, cost of capital, occupancy, rental income, operating expenses, policy changes and financing), states that no representation or warranty is made, that past performance of CapitaLand Investment and the CLI Listed Funds is not indicative of future performance, that a listing on SGX-ST does not guarantee a liquid market, and that the presentation is not an offer of shares or units.
Split screen: left half bright blue with dense white disclaimer text; right half navy with a dotted globe pattern, large 'Thank You' with red dot, logo and QR code in the bottom right.
Common questions about this slide and the underlying presentation content.
It is the 12-page '3Q 2026 Business Updates' deck that CapitaLand Investment Limited (SGX: 9CI) lodged with SGX on 4 November 2026. It covers year-to-date September 2026 fee-related revenue, fundraising, deployment and divestments, segment updates for listed funds, private funds, commercial and lodging management, the balance sheet, and strategic priorities.
Singapore-listed companies report full financial statements half-yearly. For the first and third quarters, issuers such as CapitaLand Investment publish a business update with selected operating and financial metrics instead of a full income statement and balance sheet. That is why this Q3 deck focuses on fee-related revenue, capital flows and key ratios.
YTD September 2026 fee-related revenue rose 15% YoY to S$1,035M (Singapore dollars), with Listed Funds up 30% and Private Funds up 32%. Total revenue was S$1.5B (down 3%), and real estate investment business revenue fell 23% to S$580M. From 1 January to 3 November 2026 the group raised c.S$4.3B of equity, deployed c.S$9.6B and divested c.S$5.7B.
No. CapitaLand Investment is a real estate investment manager listed on SGX. It sponsors and manages listed REITs and business trusts, runs private funds, and earns fees from commercial and lodging management (including Ascott). The deck reports its own fee and investment businesses, not a single REIT portfolio.
Page 10 shows net debt to equity of 0.46x, interest coverage of 4.1x, an implied borrowing cost of 3.5% a year, 71% fixed-rate debt, a 2.8-year average debt tenure and S$721M of operating cashflow. It also estimates debt headroom of S$3.3B at 0.7x and S$6.0B at 0.9x net debt to equity.
The presentation was lodged with SGX through its company announcements service and is also available in the investor relations section of capitalandinvest.com. This page offers the same PDF with an English page-by-page summary.
Yes, the PDF is free to download for reference. Its short structure (title, highlights, revenue overview, segment slides, balance-sheet KPIs, strategy, disclaimer) works well as a model for a 10-15 slide quarterly business update. The content and branding belong to CapitaLand Investment, so replace them with your own.
It uses a royal blue and white corporate palette with teal and red accents, large left-aligned headlines that state the takeaway, stacked bar charts, a donut chart, light-blue side panels for KPIs and numbered 01/02/03 sections on the segment slides. The cover and closing slides use dotted wave and globe graphics.
Search CapitaLand Investment (9CI) for the 4 November 2026 3Q 2026 Business Updates lodgement.

Create Your Own Slides
Turn your ideas into professional presentations in seconds with 2slides AI.
Reference professional designs, choose your style, and generate slides with perfect text rendering. Powered by Nano Banana—start creating your presentation now.
Your AI Agent for slides. Save time, shine faster with intelligent presentation creation.


© 2026 2slides. All rights reserved.