
Part of Consulting presentation examples
Capgemini World Wealth Report 2026 (30th edition), titled "Wealth.AI: Unlocking personalization through augmented intelligence", published by the Capgemini Research Institute for Financial Services in 2026. It sizes global high-net-worth individual (HNWI) wealth for 2025 (USD 98.3 trillion, up 8.7%) and argues that wealth managers must redesign their operating model around augmented intelligence to deliver personalization at scale.
Uses this deck’s cover as a style reference for slides made from your own content. Or pick any page below to use its layout as the reference.
Quick Navigation
Tags
Share the slides
Capgemini World Wealth Report 2026 (30th edition), titled "Wealth.AI: Unlocking personalization through augmented intelligence", published by the Capgemini Research Institute for Financial Services in 2026. It sizes global high-net-worth individual (HNWI) wealth for 2025 (USD 98.3 trillion, up 8.7%) and argues that wealth managers must redesign their operating model around augmented intelligence to deliver personalization at scale.
Detailed view of each slide page, including layout, key content and visual elements.
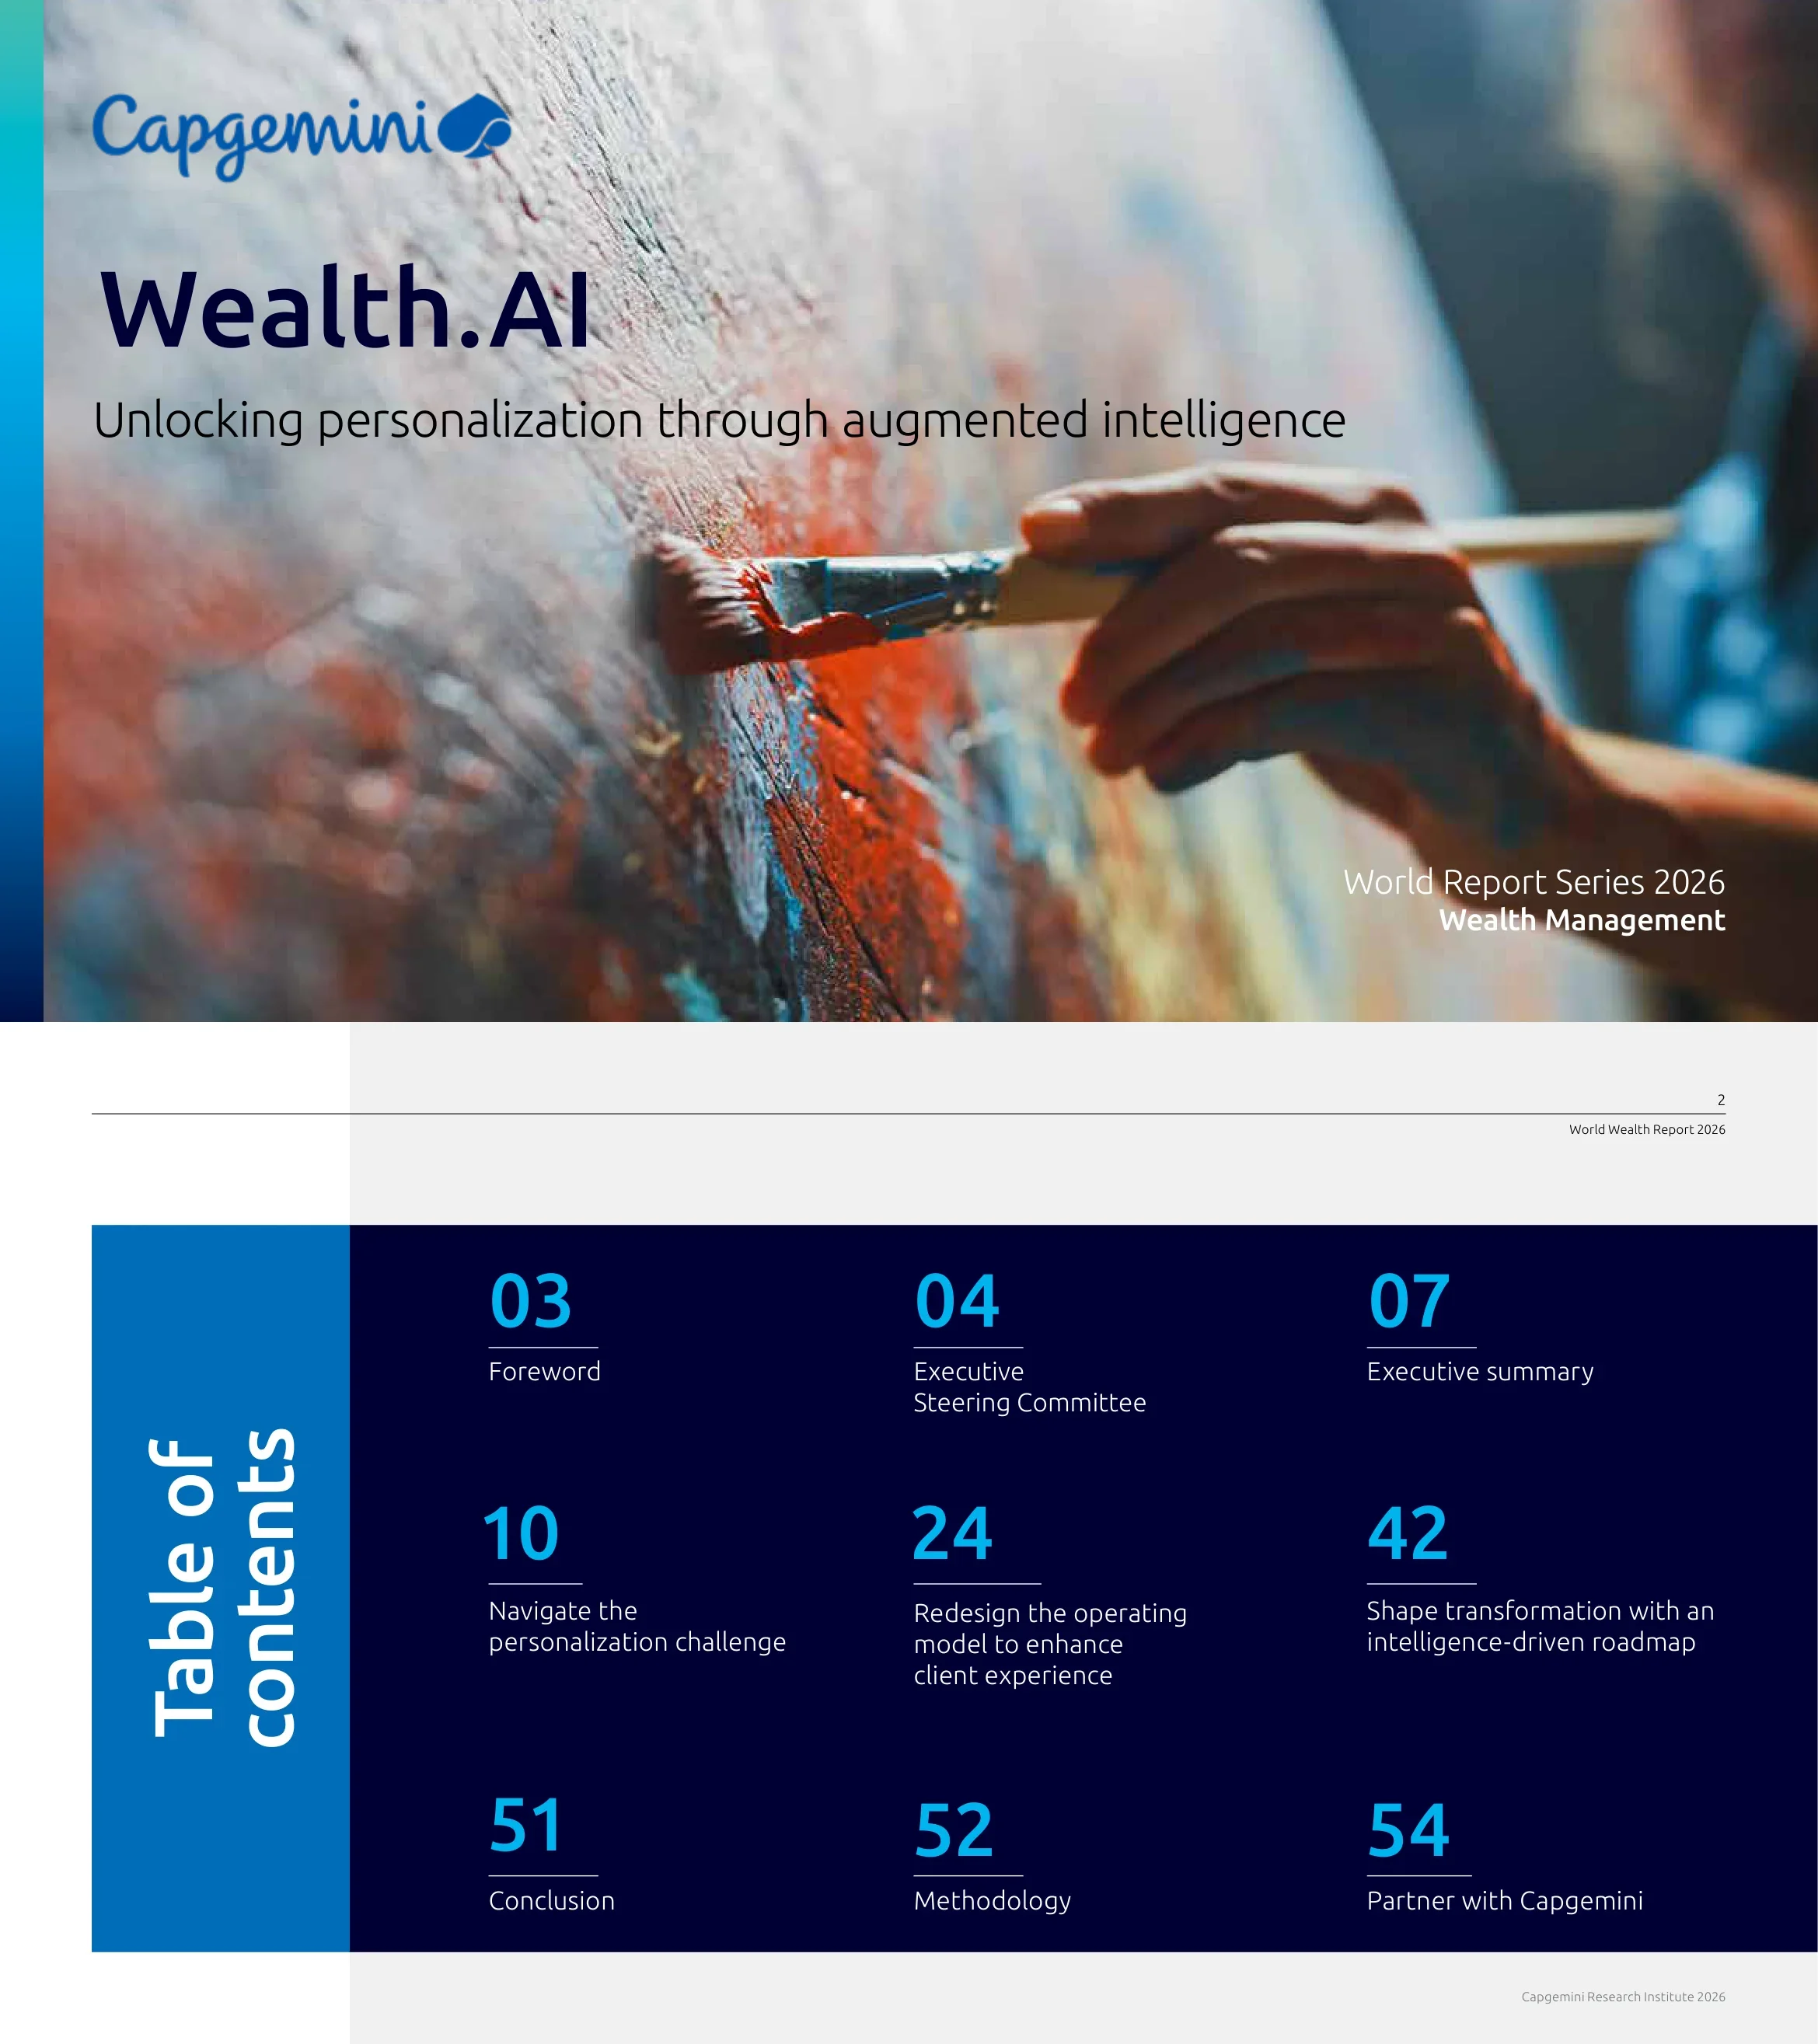
Cover of the Capgemini World Report Series 2026 Wealth Management edition, titled Wealth.AI with the subtitle Unlocking personalization through augmented intelligence.
Full-bleed photo of a hand painting a canvas with Capgemini logo top-left, large title and subtitle on the left, series label bottom-right
Nine-entry contents grid: Foreword (3), Executive Steering Committee (4), Executive summary (7), Navigate the personalization challenge (10), Redesign the operating model (24), Shape transformation with an intelligence-driven roadmap (42), Conclusion (51), Methodology (52), Partner with Capgemini (54).
Vertical rotated heading on a blue band at left, 3x3 grid of large page numbers with labels on a navy panel
Kartik Ramakrishnan, CEO Financial Services at Capgemini, notes HNWI wealth reached USD 98.3 trillion at end-2025 and frames personalization at scale, enabled by augmented intelligence, as the industry's defining challenge in this 30th edition.
Rotated section label at left, two text columns, headshot with name and title in the right column
Introduces the steering committee and profiles nine executives from Bank of America Private Bank, Barclays, BlackRock, BNP Paribas, Bradesco, BW-Bank, Citi, HSBC and ING.
Rotated section label, intro sentence, navy banner, 3x3 grid of headshots with name, title, firm and country flag
Profiles four more committee members from Morgan Stanley, Pictet, Standard Chartered and Vanguard.
Same grid layout as page 4 with four profile cards
Profiles technology members from Adobe, AWS, InvestCloud and Shaping Wealth.
Same profile grid under a blue 'WealthTechs and hyperscalers' banner
Global HNWI wealth grew 8.7% to USD 98.3 trillion in 2025 (North America +9.9%, APAC +10.5%, Europe +8.0%, ultra-HNWI band +9.7%); equities rose to 25% and fixed income to 20% of portfolios; only 17% of HNWIs find advice seamless and personalized, 97% of firms segment by wealth band and 78% use traditional risk profiles.
Rotated 'Executive summary' label, two text columns, big-number callout at right
A conservative USD 1.5 trillion in new assets under advice went to competitors in 2022-2025; three pillars are proposed, starting with broader product access (88% of HNWIs use multiple firms for better alternatives) and supercharged RMs, who spend 41% of time on operational tasks.
Rotated label, two text columns with numbered pillars, 53% big-number callout
Third pillar is an enabling intelligence layer; firms should assess data quality, workflow fragmentation and use of intelligence, then follow Now, Soon and Later horizons while tracking operational and client-facing metrics.
Rotated label, two text columns with numbered pillar and horizon bullets
Chapter divider for section 1, Navigate the personalization challenge.
Full-bleed photo of a painter at a large abstract canvas, giant numeral 1 with gradient bar and white chapter title
Global HNWI wealth reached USD 98.3 trillion (+8.7% vs 4.2% in 2024) and HNWI population rose 7.9% to 25.3 million; the Magnificent Seven drove over 40% of S&P 500 returns, KOSPI rose 75.6%, TAIEX 25.7% and Nikkei 225 nearly 26%.
Large blue pull-paragraph on the left, body text column in the middle, pottery photo on the right third
Stacked bar chart of HNWI financial wealth from USD 68.1 trillion (2018) to 98.3 trillion (2025), CAGR 5.4%; 2025 change by region: North America 9.9% (32.9 tn), APAC 10.5% (29.7 tn), Europe 8.0% (20.5 tn), Middle East -1.5% (3.5 tn), Latin America 5.1% (9.6 tn), Africa 7.0% (2.1 tn).
Text column at left, large stacked bar chart with regional % change legend at right
Stacked bars show HNWI population rising from 18.0 million (2018) to 25.3 million (2025), CAGR 5.0% and +7.9% in 2025; regional change: North America 9.1%, APAC 9.4%, Europe 6.5%, Middle East -1.4%, Latin America 0.3%, Africa 4.1%; APAC text notes South Korea wealth +16.7%.
Stacked bar chart at left with regional legend, text column with APAC subheading at right
Country detail: Hong Kong wealth +13.6%, Japan +12.3%, India +4.6%, Australia +6.8%; Europe wealth +8.0% and population +6.5% (vs +0.7% and -2.1% in 2024), Germany wealth +12.7%, France +4%, UK +4.1%; Middle East wealth -1.5% and Africa +7.0%.
Three dense text columns with two bold subheadings and a gradient accent bar
Wealth-band pyramid: ultra-HNWIs (USD 30M+) are 0.25M people (1%) holding 34.8% of wealth, +9.4% population and +9.7% wealth; mid-tier millionaires 2.35M, 22.7%, +8.6% and +8.7%; millionaires next door 22.65M, 42.5%, +7.7% and +7.8%; Latin America wealth +5.1%.
Text column at left, pyramid diagram joined to a three-column data table at right
100% stacked bars of HNWI asset allocation from Jan 2002 to Jan 2026, based on a survey of 6,510 HNWIs: in Jan 2026 equities 25%, cash 24%, fixed income 20%, real estate 19%, alternatives 12%.
Text column with blue heading at left, 100% stacked column chart with legend and definitions at right
Cash held at 24% of portfolios and alternatives fell three points to 12% as private equity buyout funds returned just 7% and crypto market capitalization fell about 15%; quote from Salvator Giglio of Morgan Stanley on digital assets going mainstream.
Gallery photo on left third, body text in middle, executive quote panel with headshot on right
97% of firms segment primarily by wealth band, 78% use static risk profiles, only 9% profile by digital engagement and 6% by investment motivation; only 17% of HNWIs say advice feels seamless and 42% restate goals multiple times; quote from Anneka Treon of ING.
Quote panel at left, two text columns with large blue heading
60% of executives say their firm lacks a unified client view and 41% of RM time goes to operational tasks, while family offices, WealthTechs and RIAs benefit from lighter regulation; big callout: 42% of HNWIs restate goals multiple times; quote from Massy Williams of Vanguard.
Quote panel at left, text column with big-number callout in middle, gallery photo at right
Global HNWI AUM is projected to grow about 6.2% a year from 2024 to 2030, while projected AUM CAGRs are 9.7% for single family offices, 6.8% for independent advisors and 44.1% for the robo-advisory market; quote from Keith Glenfield of Citi.
Quote panel at left, text column with bulleted CAGRs, pottery photo at right
Share of HNWIs using one firm fell from 39% (2019) to 19% (2025), a 50% decline, while those using four to six firms rose from 12% to 25%, a 100% increase.
Text column with heading and bullets at left, clustered bar chart with annotated arrows at right
Traditional firms missed at least 1.6 percentage points of global HNWI investable wealth in 2022-2025, a conservative USD 1.5 trillion in uncaptured assets under advice; quotes from Beat Bachmann (BNP Paribas) and Anita Saggurti (Bank of America Private Bank).
Two quote panels flanking a central text column
Full-page photograph of a hand painting with a brush in red, purple and yellow, used as a visual break; no text content beyond header and footer.
Full-bleed photograph with gradient accent bar at bottom right
Chapter divider for section 2, Redesign the operating model to enhance client experience.
Full-bleed photo of a sculptor shaping a clay head, giant numeral 2 with gradient bar and white title
House-shaped framework with two pillars, broaden products and services access and supercharge the RM, resting on augmented intelligence; HNWI priorities: 49% want exclusive or higher-quality alternatives and 47% want proactive, personalized RM communication.
Text column at left, house/pillar framework diagram at right with priorities, delivery opportunities and upside rows
88% of HNWIs use multiple firms for better access to alternatives and 47% would consolidate with firms offering exclusive alternatives; 68% want more private equity and about 59% seek specialized avenues such as hedge funds and SMAs; quote from Christine Mar Ciriani of InvestCloud.
Quote panel at left, two text columns, 88% big-number callout
50% of HNWIs see digital asset access as important; examples include HSBC's evergreen Horizon Private Equity fund, Morgan Stanley's Zerohash crypto partnership and BlackRock's tokenized liquidity fund; 69% of executives prioritize longevity and health-linked wealth solutions, 47% tokenization, 40% tax, estate and retirement planning.
Three text columns with bold-lead bullets and a gradient accent bar
Nearly 40% of executives say RMs still perform operational tasks manually and 32% of HNWIs coordinate specialists themselves; 76% of RMs want AI-enabled systems and 61% want an integrated specialist ecosystem; cites Standard Chartered-Bupa-WHOOP and Raymond James-OakWood; quote from Charles Boulton of HSBC.
Quote panel at left, two text columns with blue heading
Standard Chartered's in-house MyWealth advisor tool gives RMs a consolidated view of holdings and risk, supports Express and Custom advisory journeys and generative AI drafting, improving advice quality and cutting preparation time.
Full teal background, three text columns structured as business challenge, solution and results
When RMs coordinate specialists effectively, 53% of HNWIs recommend their firm and 47% will consolidate more wealth with firms offering integrated specialist access; quote from Wayne Hawkes of Barclays.
Quote panel at left, text column with 47% callout, text column with heading at right
Full-page photograph of hands shaping a clay pot, used as a visual break; no body text.
Full-bleed photograph with header and footer only
Diagram of an HNWI reaching a team of RMs, product specialists and value-added specialists via a digital interface or lead advisor; top-ranked non-financial services are concierge, legal and networking, and top financial ones are investment management, inheritance and tax planning.
Text column with bold-lead bullets at left, nested box diagram with ranked specialist tiles at right
Intelligent routing matches the right specialist to each need, RMs become accountable orchestrators rewarded for shared outcomes, and a workspace coordinates delivery and retains knowledge; quote from Ashley Longabaugh of Celent.
Quote panel at left, two text columns with black subheadings
The workspace institutionalizes client knowledge across RM transitions and enables segment-based service prioritization, and automation frees RM capacity; quote from Noah Kraehenmann of Temenos on AI-ready data architecture.
Pottery photo at left, text column in middle, quote panel at right
RM time split: onboarding and compliance 28%, portfolio monitoring and execution 26%, client meetings and advisory 23%, client profile review and planning 22%, each mapped to a foundational capability and an AI differentiator (pKYC agent, event predictor, on-call intelligence agent, client signal detector); these can cut RM operational workload by about 50%.
Text column at left, capability matrix with percentage tiles and two capability columns at right
A large US wealth and asset manager worked with Capgemini, using its A3 accelerator, on an AI-powered advisor desktop with an Adaptive Experience AI Engine, Unified Client Semantics Profile and Personal Wealth Coach, moving from episodic to continuous, context-aware engagement.
Full teal background, three text columns for challenge, solution and results
Augmented intelligence is described as the connective tissue of the operating model, and the page distinguishes automation, which removes tasks, from augmentation, which strengthens human judgment.
Text column with blue heading at left, large painting photo filling right two-thirds
The human layer requires defined roles and incentives, redirected focus and turning data into conversations; the intelligence layer requires intelligence-ready data, proactive insights and controlled AI models; quote from Jose Thomas of Adobe.
Quote panel at left, two text columns of bold-lead bullets
Every client interaction enriches the intelligence layer, so institutional intelligence makes every RM smarter while preserving judgment; quote from Andressa Auge of Bradesco on the need for multi-year data investment.
Quote panel at left, short text column in middle, painting photo at right
Firms must sequence the transition pragmatically given different starting points and legacy constraints; quote from Brian Portnoy of Shaping Wealth on the AI-augmented empathetic RM.
Quote panel at left, short text column with gradient bar, pottery photo at right
Full-page photograph of hands on a spinning pottery wheel, used as a visual break; no body text.
Full-bleed photograph with small teal accent bar
Chapter divider for section 3, Shape transformation with an intelligence-driven roadmap.
Full-bleed painter photo, giant numeral 3 with gradient bar and white title
Personalization at scale will become embedded in the firm; private markets will move beyond exclusive access, tokenization will lower barriers and engagement will become relevance-driven, with the intelligence layer as the differentiator; quote from Andy Plaisted of Morgan Stanley.
Two text columns at left, quote panel at right
Business case: revenue growth from wallet share, cost efficiency and stronger brand; before starting, firms should assess client data quality, workflow fragmentation and how far intelligence informs decisions; quote from Laurent Gaillard of Pictet.
Quote panel at left, two text columns with blue heading
Full quote page from Jared Murphy of BlackRock: technology will support analysis and portfolio construction, but the human advisor remains essential.
Quote panel at left, framed-art gallery photo at right
Roadmap starting with a readiness assessment, then Now (unified client data, proactive insight-led advice, trusted human-AI collaboration), Soon (AI-augmented orchestration, RMs as experience orchestrators, alternatives as core) and Later (autonomous tailored portfolios, life-event planning, institutionalized client intelligence).
Text column with horizon subheadings at left, three-column horizon diagram with navy assessment block at right
Soon horizon builds institutional memory and embeds alternatives through tokenization; in the Later horizon autonomous portfolios and AI-enabled estate and tax planning mature, with human judgment leading; introduces how firms know they are making progress; quote from Rosalind Ng of Standard Chartered.
Quote panel at left, two text columns with subheadings
Full quote page from Brian Cassin of Amazon Web Services: firms that build intelligence into platform foundations will scale personalization consistently.
Quote panel at left, close-up painting photo at right
Metrics matrix across client, RM and intelligence for Pilot (e.g. AI adoption, insight override rate), Rollout (wallet share growth, cost-to-serve) and Maturity (client lifetime value, AI insight accuracy), with relationship satisfaction as a constant.
Three-stage metrics matrix with row labels at left, explanatory text column at right
At rollout share-of-wallet growth is the main proof point, at maturity client lifetime value and generation retention matter, and relationship satisfaction is the continuous reference; quote from Oliver Neckel of BW-Bank.
Quote panel at left, two text columns with subheadings
Wealth management is at an inflection point: USD 1.5 trillion in assets under advice went outside traditional firms in 2022-2025, and leaders will deploy augmented intelligence to empower RMs and institutionalize personalization at scale.
White text on dark pottery photograph, single text column at left
HNWIs are defined as having at least USD 1 million investable assets; the market model covers 71 markets (over 98% of global GNI) using a Lorenz curve method, and the 2026 Global HNWI Survey covered 6,510 HNWIs (wealth bands 24% / 35% / 41%; 70% male, 30% female).
Large heading with three text columns and blue subheadings
Executive survey: 144 responses across 10 markets in January 2026 with Phronesis Partners; RM survey: 1,317 responses across 16 markets (Americas 25%, Europe 48%, APAC 19%, Middle East 8%).
Two text columns with blue headings, paint-brush photo on the right third
Capgemini offerings: RM experience transformation with its Advisory Agent (A3), AI-enabled operations redesign with an Autonomous Operations Platform, and Business-Ready Data for AI with a One Data Layer.
White text on dark textured background, large heading, three text columns
Full-page photograph of a brush painting a blue landscape, used as a visual break; no body text.
Full-bleed photograph
Profiles of six Capgemini experts: Gareth Wilson, Sandeep Kurne, Catherine Chedru-Refeuil, Tej Vakta, Loic Paquotte and James Aylen, with roles and emails.
Large heading, 3x2 grid of headshots with bios
Profiles of Jeannette Martin, Luca Russignan (Global Head, Capgemini Research Institute for FS) and Vivek Singh.
Three headshot-and-bio cards across the top
Contact directory for Global, Americas, Asia (Hong Kong, Singapore), Australia, Austria and Germany, Belgium and the Netherlands, France, Italy and Japan.
Large heading, three-column directory of names and emails grouped by region
Contacts for Latin America, Middle East, Nordics, Spain, Switzerland and the United Kingdom.
Two-column directory with pottery photo on the right third
Thanks to named participating firms (ABN Amro to Warren Investments), technology firms AWS, Temenos and Celent, survey partners, contributors, and the Capgemini Research Institute for Financial Services team.
Large heading, three text columns with team headshots at right
Capgemini has over 420,000 team members in 50+ countries and 2025 revenues of EUR 22.5 billion; the Capgemini Research Institute for Financial Services publishes the annual Financial Services World Reports; includes a disclaimer.
Large heading, three columns: Capgemini, Research Institute, Disclaimer
Endnotes 1-23 citing sources such as Fidelity, The Korea Times, Bloomberg, Morningstar and The Guardian for 2025 market performance figures.
Large heading with numbered single-column list
Endnotes 24-42; note 37 explains the wallet-share estimate: WM firms' share of HNWI investable wealth fell from 70.5% (2022) to 66.6% (2025), implying USD 1.5 to 5.6 trillion uncaptured on USD 90.47 trillion investable wealth.
Numbered single-column list
Back cover with QR codes linking to the World Wealth Report web page and interactive version, plus banking@capgemini.com and press contact Fahd Pasha.
Left white panel with QR boxes and contacts, right solid blue gradient panel, Capgemini 'Make it real' logo
Common questions about this slide and the underlying presentation content.
It is the 30th edition of Capgemini's annual report on high-net-worth individuals. It sizes HNWI wealth and population for 2025 by region and wealth band, tracks HNWI asset allocation, and argues that wealth managers need an augmented-intelligence-driven operating model to deliver personalization at scale. The edition is titled Wealth.AI: Unlocking personalization through augmented intelligence.
Global HNWI wealth rose 8.7% to USD 98.3 trillion in 2025 and the HNWI population grew 7.9% to 25.3 million. Only 17% of HNWIs say their advice feels seamless and personalized, and the share working with a single firm fell from 39% in 2019 to 19% in 2025. Capgemini estimates that a conservative USD 1.5 trillion in new assets under advice went to competitors such as family offices and WealthTechs between 2022 and 2025.
Asia-Pacific led with HNWI wealth up 10.5% and population up 9.4%, followed by North America (wealth +9.9%, population +9.1%) and Europe (wealth +8.0%). The Middle East was the only region to contract, with HNWI wealth down 1.5%.
It is published once a year by the Capgemini Research Institute for Financial Services, Capgemini's in-house financial services think tank, as part of its Financial Services World Report Series. The 2026 edition draws on a survey of 6,510 HNWIs, 144 wealth management executives and 1,317 relationship managers.
It shows a long research report laid out as landscape slides: a contents grid, three-page executive summary, numbered chapter dividers, figures whose titles state the takeaway (for example 'UHNWIs continue to post the strongest wealth and population growth'), big-number callouts, executive quote panels, teal case-study pages and a staged roadmap. It is a good model for chart-heavy, insight-led consulting decks.
Three interconnected pillars: broaden products and services access (alternatives, digital assets, value-added services), supercharge relationship managers to orchestrate specialists, and an enabling augmented-intelligence layer. Firms implement it through Now, Soon and Later horizons and track pilot, rollout and maturity metrics.
Start from your report, document or outline and use 2Slides to turn it into slides. Keep one message per slide, write action titles that state the finding, and pair each key number with a simple chart or callout as this Capgemini deck does.
The original PDF is published by Capgemini at https://www.capgemini.com/wp-content/uploads/2026/10/WWR_2026.pdf, and Capgemini's World Wealth Report page hosts an interactive version.
Original full report PDF published by Capgemini.

Create Your Own Slides
Turn your ideas into professional presentations in seconds with 2slides AI.
Reference professional designs, choose your style, and generate slides with perfect text rendering. Powered by Nano Banana—start creating your presentation now.
Your AI Agent for slides. Save time, shine faster with intelligent presentation creation.


© 2026 2slides. All rights reserved.