
Part of Investor presentation examples
Broadridge Financial Solutions Fiscal Q1 2027 Earnings Presentation (quarter ended September 30, 2026): the 29-page earnings conference call deck dated November 3, 2026 and filed with the SEC as an exhibit (EX-99.2) to Form 8-K. It covers 11% Recurring revenue growth in constant currency to $1,083 million, total revenues of $1,669 million (+5%), Adjusted EPS of $1.56 (+3%) against diluted EPS of $0.83, Closed sales of $36 million (+10%), segment results for Investor Communication Solutions (ICS) and Global Technology and Operations (GTO), position and trade growth, capital returns, reaffirmed fiscal 2027 guidance, and full GAAP to Non-GAAP reconciliations.
Uses this deck’s cover as a style reference for slides made from your own content. Or pick any page below to use its layout as the reference.
Quick Navigation
Tags
Share the slides
Broadridge Financial Solutions Fiscal Q1 2027 Earnings Presentation (quarter ended September 30, 2026): the 29-page earnings conference call deck dated November 3, 2026 and filed with the SEC as an exhibit (EX-99.2) to Form 8-K. It covers 11% Recurring revenue growth in constant currency to $1,083 million, total revenues of $1,669 million (+5%), Adjusted EPS of $1.56 (+3%) against diluted EPS of $0.83, Closed sales of $36 million (+10%), segment results for Investor Communication Solutions (ICS) and Global Technology and Operations (GTO), position and trade growth, capital returns, reaffirmed fiscal 2027 guidance, and full GAAP to Non-GAAP reconciliations.
Detailed view of each slide page, including layout, key content and visual elements.
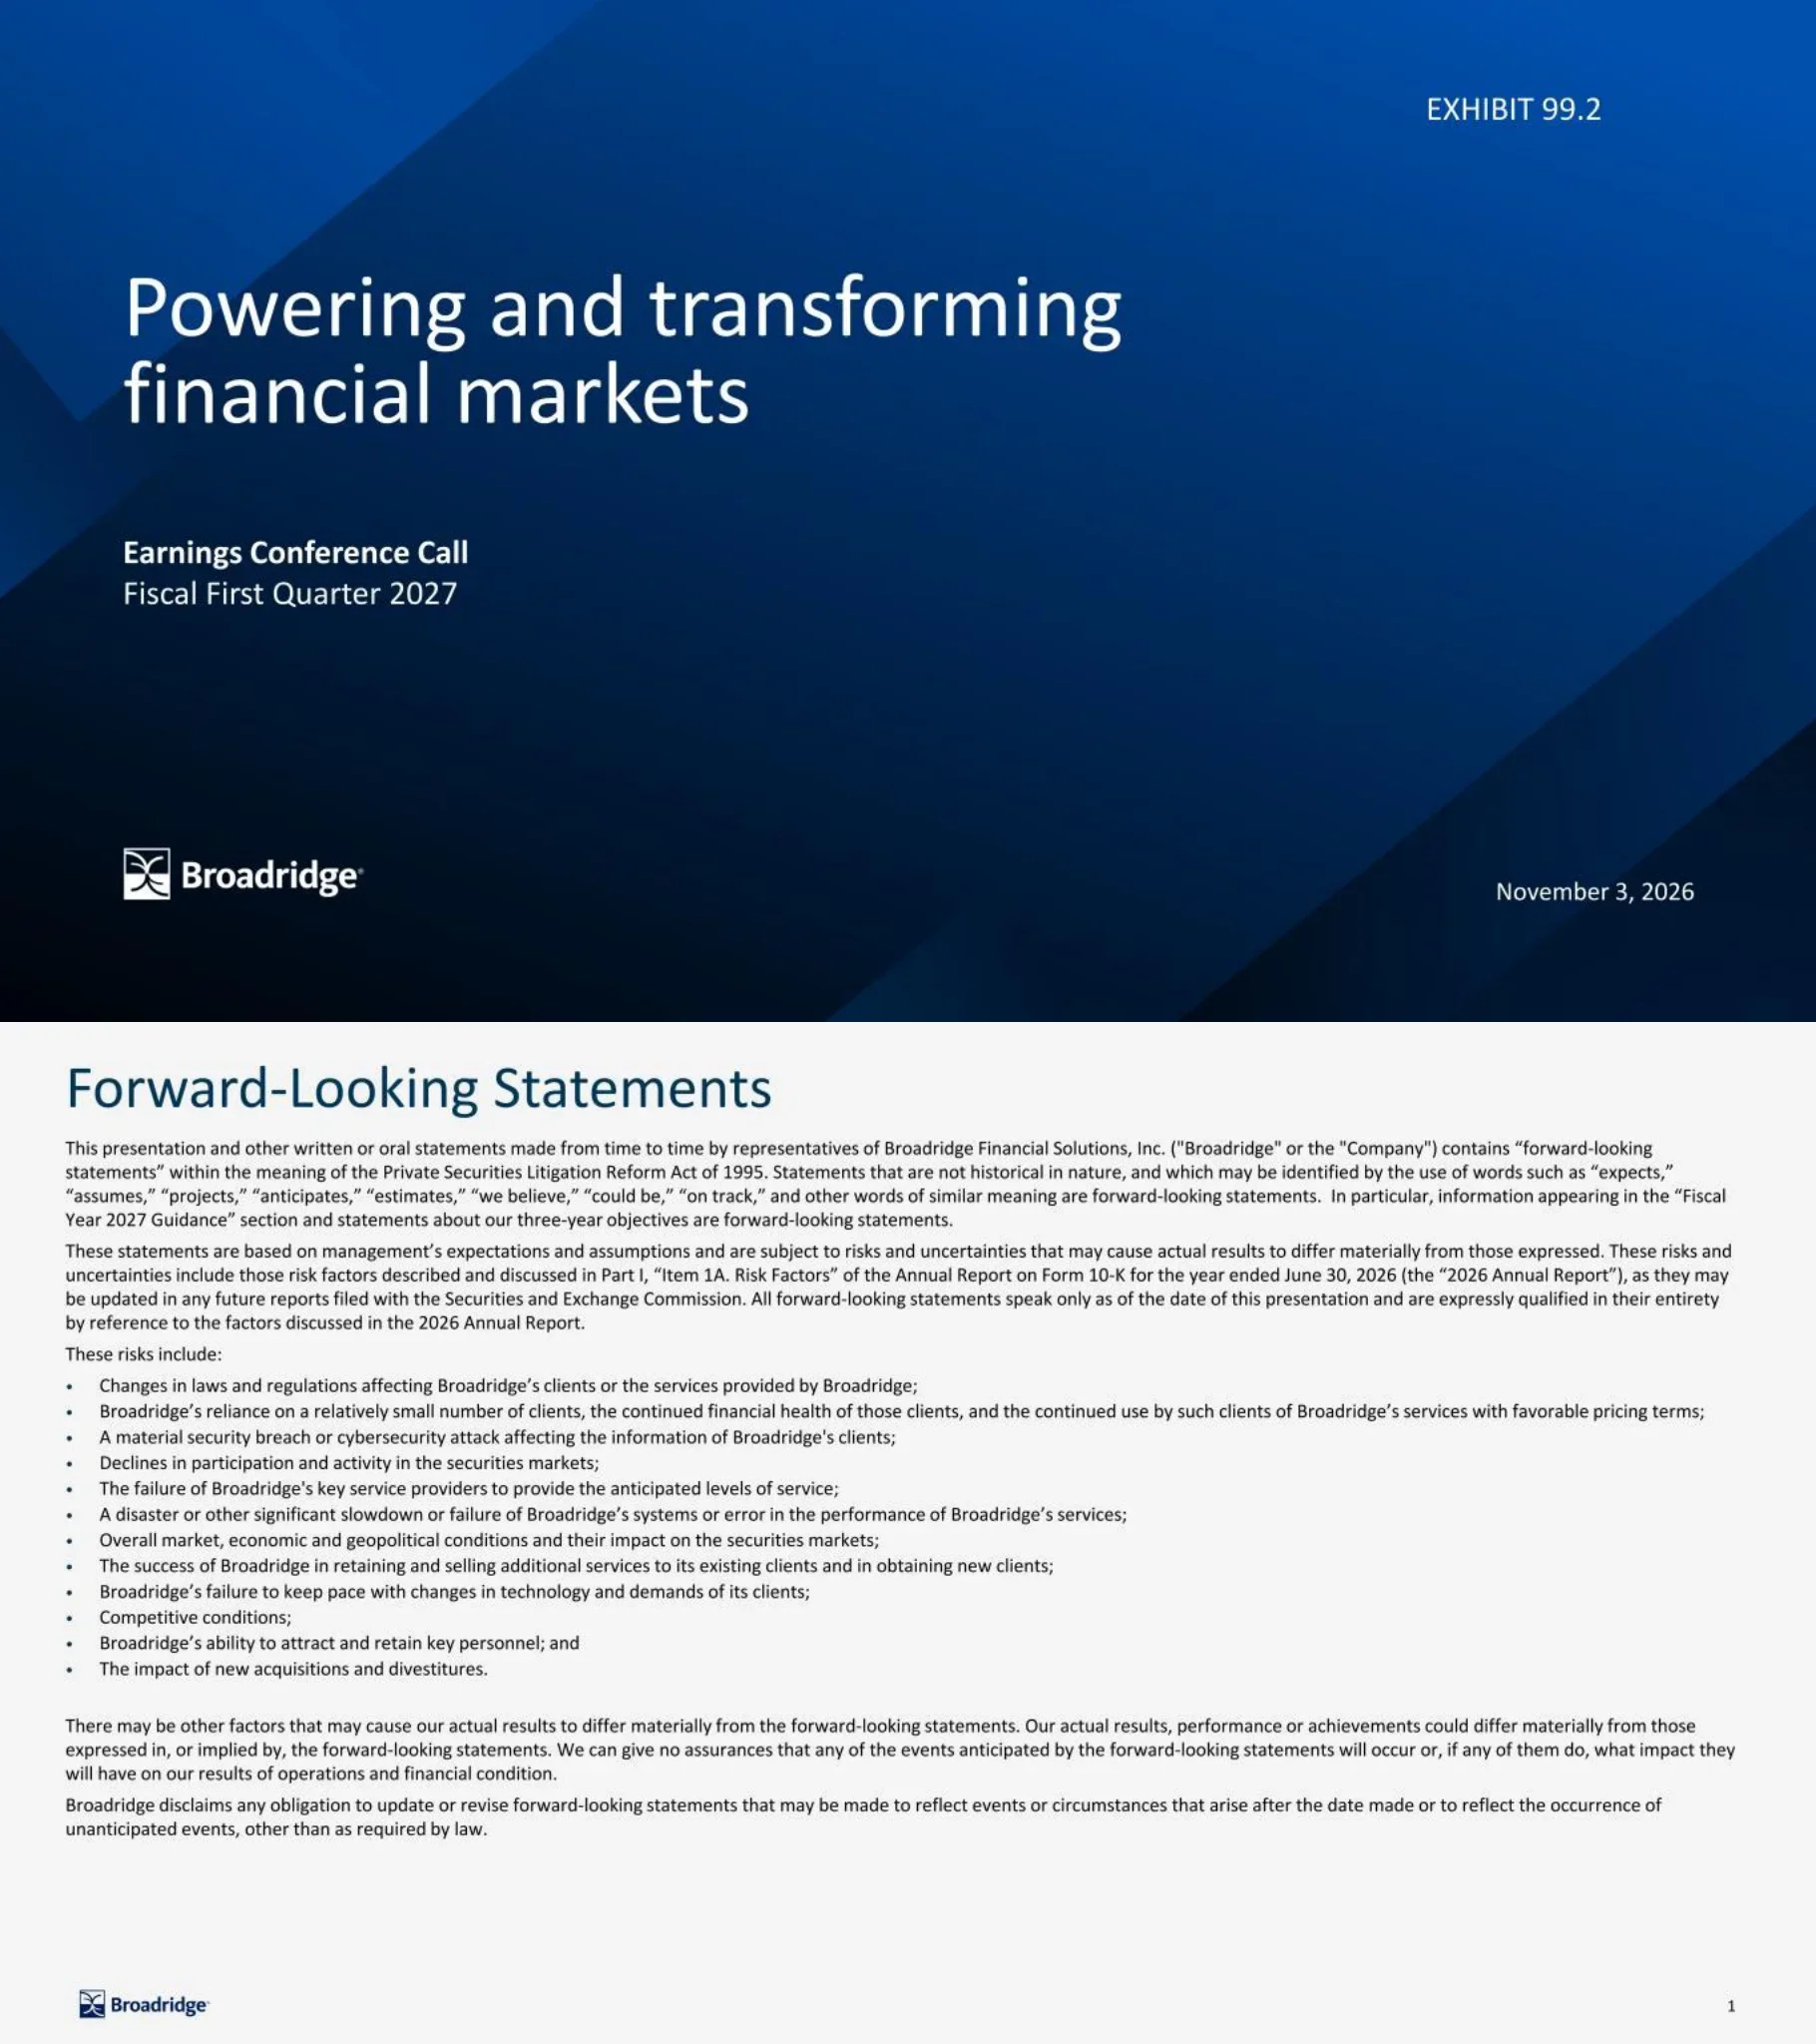
Title slide for the Earnings Conference Call, Fiscal First Quarter 2027, dated November 3, 2026, marked EXHIBIT 99.2 in the top right, with the Broadridge logo bottom left.
Full-bleed deep blue gradient background with diagonal light facets; large white two-line headline at left center, small bold subtitle and period line beneath, exhibit label top right, date bottom right.
Safe-harbor language under the Private Securities Litigation Reform Act of 1995, referencing the Fiscal Year 2027 Guidance section, three-year objectives and the risk factors in the Form 10-K for the year ended June 30, 2026. It lists twelve risks, including regulatory change, reliance on a relatively small number of clients, cybersecurity breaches, declines in securities market activity, service provider failures, system failures, market and geopolitical conditions, client retention, keeping pace with technology, competition, key personnel, and acquisitions and divestitures.
Text-only slide on a light grey background: dark blue title, two dense paragraphs, a twelve-item bullet list, and two closing paragraphs; small logo and page number in the footer.
Defines the Non-GAAP measures used (Adjusted Operating income and margin, Adjusted Net earnings, Adjusted EPS, Free cash flow and conversion, Recurring revenue growth constant currency) and the KPIs management tracks (Revenues, Recurring revenue, Closed sales, Position Growth and Internal Trade Growth). Notes that equity revenue position growth has been presented since Q4 fiscal 2025 and excludes small or fractional non-revenue positions, that segment reporting uses actual FX rates since Q1 fiscal 2023, and that FY'25 and FY'26 recurring revenue dollars are GAAP while growth percentages are constant currency.
Text-only slide with a two-line title and five bold sub-headed sections (Non-GAAP measures, KPIs, Foreign Exchange Rates, Notes on Presentation, Use of Material) each followed by a short paragraph.
Five numbered takeaways: strong Q1'27 results with 11% Recurring revenue growth constant currency and 10% Closed sales growth; executing on democratizing and digitizing governance, simplifying and innovating capital markets, and modernizing wealth management; building future growth through digital engagement, tokenization and agentic AI; repurchasing $200 million of shares and returning an additional $111 million via the dividend; and reaffirming fiscal 2027 guidance of 6-8% Recurring revenue growth constant currency, 8-12% Adjusted EPS growth and 100%+ Free cash flow conversion.
Vertical list of five rows, each with a large navy numbered circle at left and a two-line statement at right; generous spacing.
Recurring revenue by franchise: Governance $568M (+10% YoY), Capital Markets $327M (+17% YoY), Wealth & Investment Management $188M (+6% YoY), growth in constant currency. Q1'27 highlights: continued strong equity position growth and accelerating fund position growth; an MOU with Korean Securities Deposit showing global demand for proxy services; on track to enable 23x5 trading across front- and back-office applications; the CQG acquisition progressing well and generating cross-sales; the Wealth business benefiting from strong demand in Canada; and Closed sales up 10% to $36 million.
Two-column layout: left column has three colored header bars (cyan, navy, grey) each with a donut chart and large revenue and growth figures; right column holds a 'Q1'27 Highlights' bullet list. Footnote points to Non-GAAP reconciliations on slides 21-27.
Three strategic pillars. Driving Digital Engagement: Goldman Sachs and Tesla among newest clients for Standing Voting Instructions; SEC paving the way to extend Standing Voting Instructions to fund elections; engaging clients on the SEC's proposed E-Delivery rule. Leading Tokenization: bringing governance and digital transfer agency capabilities to the NYSE's alternative trading system for digital assets; extending shareholder rights and proxy voting to Kraken/Payward; DLR now supports cross-border atomic settlement for G7 securities; launched DLX, a multi-asset end-to-end tokenization platform live supporting the DTCC Tokenization Service. Scaling AI: extending the Client Policy Engine to new asset managers; an agreement with a major consulting firm to replace its in-house platform with the AI-powered Global Demand Model; on track for $25 million of fiscal 2027 AI savings.
Three equal columns, each topped by a colored header bar (cyan, navy, grey) with three or four bullets beneath.
First quarter fiscal 2027 vs 2026 ($ millions except per share): Recurring revenues $1,083 vs $977 (+11%, +11% constant currency); Total revenues $1,669 vs $1,589 (+5%); Operating income $174 vs $189 (-8%); Adjusted Operating income $230 vs $251 (-9%); Adjusted Operating income margin 13.8% vs 15.8% (-200 bps); Diluted EPS $0.83 vs $1.40 (-41%); Adjusted EPS $1.56 vs $1.51 (+3%); Closed sales $36 vs $33 (+10%).
Financial table with row labels at left and three columns (2027, 2026 under a cyan 'First Quarter' header, and a navy 'Inc./(Dec.)' column); current-year figures in bold, Non-GAAP sub-rows in italics.
ICS Recurring revenues grew 10% to $568M: Regulatory $230M (+17%), Data-Driven Fund Solutions $122M (+10%), Issuer $34M (+4%), Customer Communications $182M (+3%). GTO Recurring revenues grew 13% to $516M: Capital Markets $327M (+17%) and Wealth & Investment Management $188M (+6%). Growth in constant currency.
Two side-by-side stacked bar charts comparing Q1'26 and Q1'27, each under a navy header bar with a cyan circular growth badge and arrow; product-line labels on the left of each chart and growth rates on the right.
Equity position growth, equity revenue position growth, and mutual fund/ETF position growth by quarter from Q1'25 to Q1'27, plus internal trade growth. In Q1'27 equity position growth was 16%, MF/ETF 16% and equity revenue positions 11%, while internal trade growth was 7%. Annual table: equity 6%/16%/16% for FY'24/FY'25/FY'26 (13% ten-year average), equity revenue 12% in FY'25 and FY'26, MF/ETF 3%/7%/6% (7% average), internal trade growth 13%/13%/15% (9% average). Quarterly internal trade growth ran 10%, 13%, 14%, 14%, 17%, 11%, 16%, 15% and 7%. Footnotes explain the seasonal weighting of fiscal 2026 equity positions, that equity revenue positions exclude fractional non-revenue positions, and how internal trade growth is measured.
Navy header bar over a multi-line chart (dashed grey equity, navy equity revenue, cyan MF/ETF) with data labels; an annual summary table at upper left; a row of internal trade growth figures under the x-axis; four numbered footnotes at the bottom.
Waterfall from Q1'26 Recurring revenues of $977M to Q1'27 of $1,083M: Closed sales +4 pts, client losses -2 pts and internal growth +7 pts (organic growth 9 pts), acquisitions +2 pts, giving 11% constant currency growth, with FX 0 pts. By segment, ICS went from $518M to $568M (4, -2, 6 and 1 pt; 10%), and GTO from $459M to $516M (4, -3, 8 and 3 pts; 13%), with organic growth of 8 pts and 10 pts respectively.
Navy header bar stating growth was 11%; waterfall chart with navy start and constant-currency bars, cyan floating increments, an outlined decrement, and a grey final bar; a two-row segment table (ICS, GTO) beneath the axis.
Total revenue bridge from $1,589M in Q1'26 to $1,669M in Q1'27 (+5%): Recurring +7 pts, Event-Driven -3 pts, Distribution +1 pt, FX 0 pts. A second chart shows quarterly event-driven revenues of $63M, $125M, $53M, $79M, $114M, $91M, $73M, $71M and $67M from Q1'25 to Q1'27, against a FY'20-FY'26 quarterly average of $66M.
Two stacked panels, each under a navy header bar: a horizontal waterfall bridge on top and a nine-quarter column chart below with a dashed average line and a highlighted cyan latest-quarter bar.
Q1 operating income margin fell from 11.9% to 10.4%, and Adjusted Operating income margin from 15.8% to 13.8%. Fiscal-year history: operating income margin 13.3% (FY'22), 15.4%, 15.6%, 17.3%, 17.4% (FY'26); Adjusted Operating income margin 18.7% (+60 bps), 19.8% (+110 bps), 20.0% (+20 bps), 20.5% (+50 bps), 20.5% (+0 bps).
Two-panel layout: left panel compares Q1'26 and Q1'27 with two bars; right panel shows five fiscal-year bars with basis-point changes inside; GAAP margins listed as a row above each panel.
Q1 diluted EPS was $0.83 vs $1.40 a year earlier, while Adjusted EPS rose from $1.51 to $1.56. Fiscal-year diluted EPS: $4.55, $5.30, $5.86, $7.10 and $9.60 (FY'22-FY'26). Adjusted EPS: $6.46 (+14%), $7.01 (+9%), $7.73 (+10%), $8.55 (+11%), $9.60 (+12%), with FY'27 guidance of 8-12% growth.
Two-panel bar chart layout matching the margin slide: quarter comparison at left, five-year trend plus a grey guidance bar with a light range cap at right; GAAP EPS shown as a header row.
Closed sales rose from $33M in Q1'26 to $36M in Q1'27. Fiscal-year Closed sales were $280M (FY'22), $246M, $342M, $288M and $305M (FY'26), with FY'27 guidance of $290-$330M.
Navy header bar over a two-part bar chart: two quarterly bars at left (latest in cyan) and six fiscal-year bars at right, the last a grey guidance bar with a bracketed range.
Q1 free cash flow rose to $76M from $13M a year earlier. Fiscal-year free cash flow conversion was 48% (FY'22), 90%, 102%, 104% and 110% (FY'26), with FY'27 guidance of 100%+. Conversion is defined as annual free cash flow divided by Adjusted Net earnings.
Two navy header bars over a quarterly two-bar chart (left) and a six-bar conversion chart with a guidance bar (right); two numbered footnotes at the bottom.
Select Q1'27 capital items: CapEx and software $17M, client platform investments $20M, M&A/strategic investments $3M. Value of digital assets $226M: $185M of Canton coins and $41M of CNTN DAT. Total capital returns (dividends plus net share repurchases): $253M (FY'22), $312M, $781M, $475M, $1,025M (FY'26), and fiscal 2027 year to date $111M of dividends plus $198M of net repurchases. Dividends per share: $2.56, $2.90, $3.20, $3.52, $3.90 and $4.36 for FY'27 (E), growing 11%, 13%, 10%, 10%, 11% and 12%. Footnote 3 says Broadridge holds Canton coins as of September 30, 2026 and recognized a $40 million loss on them in Q1, excluded from Adjusted EPS; it gives the per-coin value as "$0.12 cents per coin" (wording as in the source).
Left column: horizontal mini-bars for three capital items and a grey panel with a stacked bar for digital assets; right column: stacked column chart of total capital returns with a light FY'27 estimate bar, and a dividends-per-share row with growth rates underneath; four footnotes.
FY'27 guidance, all marked No Change: Recurring revenue growth constant currency 6-8%; Adjusted Operating income margin about 21%; Adjusted EPS growth 8-12%; free cash flow conversion 100%+; Closed sales $290-$330M.
Clean guidance table with five metric rows separated by thin rules and two navy column headers ('FY'27 Guidance' and 'Updates').
Announces that Broadridge will host its Investor Day on December 8, 2026 in New York City.
Full-bleed blue gradient slide with centered white headline and a three-line centered announcement; logo bottom left.
Section divider introducing the appendix of supplemental reporting and Non-GAAP reconciliations.
Full-bleed blue gradient with a single white 'Appendix' heading at left and the logo bottom left.
Unaudited product-line revenue table ($ millions) for FY2025, each quarter of FY2026, FY2026 and Q1 FY2027 with YoY growth. Q1'27 ICS: Regulatory $230 (+17%), Data-driven fund solutions 122 (+10%), Issuer 34 (+4%), Customer communications 182 (+3%), total ICS recurring 568 (+10%); event-driven equity and other 34 (+41%), mutual funds 34 (-63%), total event-driven 67 (-41%); distribution 518 (+4%); total ICS revenues $1,153 (+2%). GTO: Capital markets $327 (+17%), Wealth and investment management 188 (+5%), total GTO recurring $516 (+12%). Total revenues $1,669 (+5%). FY2026 totals: Recurring $4,878, event-driven 348, distribution 2,251, total revenues $7,477 (FY2025 total $6,889). Revenue by type for Q1'27: Recurring $1,083 (+11%), event-driven 67, distribution 518.
Dense financial table with navy and blue year/quarter headers, grey section bands for ICS, GTO and Revenues by type, bold subtotal rows, and light blue shading on full-year columns.
Section divider introducing the Non-GAAP explanations and reconciliation tables.
Full-bleed blue gradient with a three-line white heading at left and the logo bottom left.
Explains why management uses Non-GAAP measures, including in compensation decisions, and lists the excluded items: amortization of acquired intangibles and purchased IP; acquisition and integration costs; restructuring and related costs (including fiscal 2027 severance tied partly to AI and productivity initiatives and the fiscal 2026 production facility closure); gains or losses on digital assets, including the Canton Digital Asset Treasury transaction; litigation settlement charges from fiscal 2024; Russia-related exit costs; real estate realignment and Covid-19 expenses; and investment gains.
Text-heavy slide with two bold subheadings followed by paragraphs and a numbered (i)-(viii) list of adjustment categories.
Explains why these items are excluded from adjusted measures, and why amortization is excluded even though the acquired intangibles contribute to revenue. Defines free cash flow as operating cash flow plus proceeds from asset sales, less capital expenditures and software purchases and capitalized internal use software, and free cash flow conversion as free cash flow divided by Adjusted Net earnings. Explains recurring revenue growth in constant currency, which translates current-period results at the prior-year comparable average exchange rates.
Text-only slide with three paragraph blocks under bold subheadings (Free cash flow and Free cash flow conversion; Recurring revenue growth constant currency); lower half left blank.
For the three months ended September 30, 2026: ICS recurring revenue growth GAAP 17% Regulatory, 10% Data-Driven Fund Solutions, 4% Issuer, 3% Customer Comms, 10% total, with 0% FX impact in each. GTO: Capital Markets 17% (0% FX, 17% constant currency), Wealth and Investment Management 5% GAAP plus 1% FX equals 6% constant currency, total 12% GAAP and 13% constant currency. Consolidated: 11% GAAP, 0% FX, 11% constant currency.
Three stacked reconciliation tables (ICS, GTO, Consolidated) with navy column headers and cyan-highlighted Total columns; lower portion empty.
GAAP operating income of $173.5M (Q1 FY27) vs $188.8M (Q1 FY26), plus amortization of acquired intangibles $38.9M vs $50.8M, acquisition and integration costs $1.9M vs $7.2M and restructuring $15.2M vs $4.4M, gives Adjusted Operating income of $229.6M vs $251.2M. Margins 10.4% vs 11.9% (GAAP) and 13.8% vs 15.8% (adjusted). Fiscal years 2026 to 2022: GAAP operating income $1,300.6M, $1,188.6M, $1,017.1M, $936.4M, $759.9M; Adjusted $1,534.8M, $1,410.9M, $1,302.8M, $1,199.1M, $1,066.4M; adjusted margins 20.5%, 20.5%, 20.0%, 19.8%, 18.7%. Footnotes describe the restructuring, Russia exit, and real estate and Covid-19 cost components.
Wide reconciliation table with a 'Three Months Ended September 30' block and a 'Fiscal Year Ended June 30' block of five years, grey adjustment band, bold adjusted subtotal row, and three lettered footnotes.
Q1 FY27 operating cash flow $93.2M less $16.9M of capex and software gives free cash flow of $76.3M (Q1 FY26: $42.3M less $29.6M = $12.7M). Fiscal-year free cash flow: $1,233.0M (FY26), $1,056.4M, $943.2M, $748.2M, $370.4M (FY22). GAAP net earnings of $94.8M vs $165.4M, plus adjustments including a $40.2M digital asset loss (vs a $45.8M gain a year earlier), give Adjusted Net earnings of $177.9M vs $178.1M. FY26 Adjusted Net earnings were $1,124.2M, after a $227.0M digital asset gain offset other adjustments. LTM free cash flow conversion: 110%, 104%, 102%, 90%, 48%.
Two stacked reconciliation tables (free cash flow; net earnings to Adjusted Net earnings) sharing quarterly and five-year column blocks, a bold conversion row, and five lettered footnotes in small type.
Q1 FY27 diluted EPS of $0.83 plus $0.34 amortization, $0.02 acquisition costs, $0.13 restructuring and $0.35 digital asset losses (subtotal $0.84) less a $0.12 tax impact gives Adjusted EPS of $1.56 (Q1 FY26: $1.40 + $0.14 - $0.03 = $1.51). Fiscal years 2026 to 2022: diluted EPS $9.60, $7.10, $5.86, $5.30, $4.55; Adjusted EPS $9.60, $8.55, $7.73, $7.01, $6.46. In FY26 a $1.94 digital asset gain and $0.06 of investment gains offset the other adjustments, so the net subtotal is zero.
Per-share reconciliation table with quarterly and five fiscal-year columns, grey adjustments band, bold Adjusted EPS row, and three lettered footnotes.
FY27 recurring revenue growth: FX impact about 0%, constant currency 6-8%. Operating income margin about 19% GAAP and about 21% adjusted. Diluted EPS growth (4%) to 0% GAAP versus Adjusted EPS growth of 8-12%. Free cash flow conversion 100%+, both as operating cash flow relative to net earnings (GAAP) and as the Non-GAAP rate. Footnotes: FX based on forward rates as of October 2026; adjusted margin excludes about $191 million of amortization, acquisition and restructuring costs; Adjusted EPS excludes about $1.60 per share of those items; FCF guidance excludes about $123 million of capex and software; digital asset gains and losses are excluded because they cannot be forecast.
Two-line title, a single 'Fiscal Year 2027' navy column, four bold metric groups each with GAAP and Non-GAAP sub-rows, and five lettered footnotes.
Closing slide with the investor relations contact (W. Edings Thibault, broadridgeir@broadridge.com), live call details for November 3, 2026 at 8:30 A.M. ET with toll-free and international dial-ins, the webcast at broadridge-ir.com, and replay options: online at broadridge-ir.com and by telephone through November 10, 2026.
Blue gradient closing slide with a large two-line white title, a left column for contacts and live call information, a right column for replay options with underlined section labels and links, and the logo bottom left.
Common questions about this slide and the underlying presentation content.
Broadridge's fiscal year ends June 30, so fiscal 2027 runs from July 1, 2026 to June 30, 2027. Fiscal Q1 2027 is July to September 2026, the three months ended September 30, 2026. The results were presented on the earnings call on November 3, 2026.
This is Broadridge Financial Solutions' (NYSE: BR) earnings conference call deck, filed with the SEC as Exhibit 99.2 to a Form 8-K. The slides in the filing are images, so this PDF reproduces them as filed. It is also available on broadridge-ir.com.
Recurring revenues grew 11% (11% in constant currency) to $1,083 million, and total revenues grew 5% to $1,669 million. Adjusted EPS rose 3% to $1.56 and Closed sales rose 10% to $36 million. GAAP diluted EPS fell 41% to $0.83, and Adjusted Operating income margin fell 200 bps to 13.8%.
The reconciliation on page 27 shows $0.84 per share of adjustments in the quarter. These include a $0.35 loss on digital assets (Broadridge's Canton coin holdings), $0.34 of amortization of acquired intangibles and $0.13 of restructuring, less a $0.12 tax impact. A year earlier, digital assets produced a $0.39 gain, which lifted GAAP EPS in that quarter.
No. All guidance was reaffirmed: 6-8% Recurring revenue growth in constant currency, about 21% Adjusted Operating income margin, 8-12% Adjusted EPS growth, 100%+ free cash flow conversion and $290-$330 million of Closed sales. On a GAAP basis, page 28 shows about 19% operating margin and diluted EPS growth of (4%) to 0%.
Investor Communication Solutions (ICS) covers regulatory communications, data-driven fund solutions, issuer services and customer communications. Its Q1 recurring revenue was $568 million, up 10%. Global Technology and Operations (GTO) covers capital markets and wealth and investment management technology. Its Q1 recurring revenue was $516 million, up 13% in constant currency.
Yes. The deck was filed as raster images, but at this resolution the footnotes and the reconciliation tables in the appendix (pages 20-28) are legible, and the page-by-page summaries above transcribe their key figures. One footnote on page 16 values Canton coins at "$0.12 cents per coin", which is how the source puts it.
Yes, the original PDF is free to download for research and reference. The financial content belongs to Broadridge. To make a similar earnings deck, with a key messages page, segment highlights, revenue bridges and guidance tables, you can use the layout as inspiration and build your own with 2Slides.
Form 8-K filings, including the earnings presentation exhibit
Earnings releases, webcast replays and presentations

Create Your Own Slides
Turn your ideas into professional presentations in seconds with 2slides AI.
Reference professional designs, choose your style, and generate slides with perfect text rendering. Powered by Nano Banana—start creating your presentation now.
Your AI Agent for slides. Save time, shine faster with intelligent presentation creation.


© 2026 2slides. All rights reserved.