
BCG AI Radar 2026 - As AI Investments Surge, CEOs Take the Lead
Quick Navigation
Tags
Share the slides
BCG AI Radar 2026 - As AI Investments Surge, CEOs Take the Lead
Detailed view of each slide page, including layout, key content and visual elements.
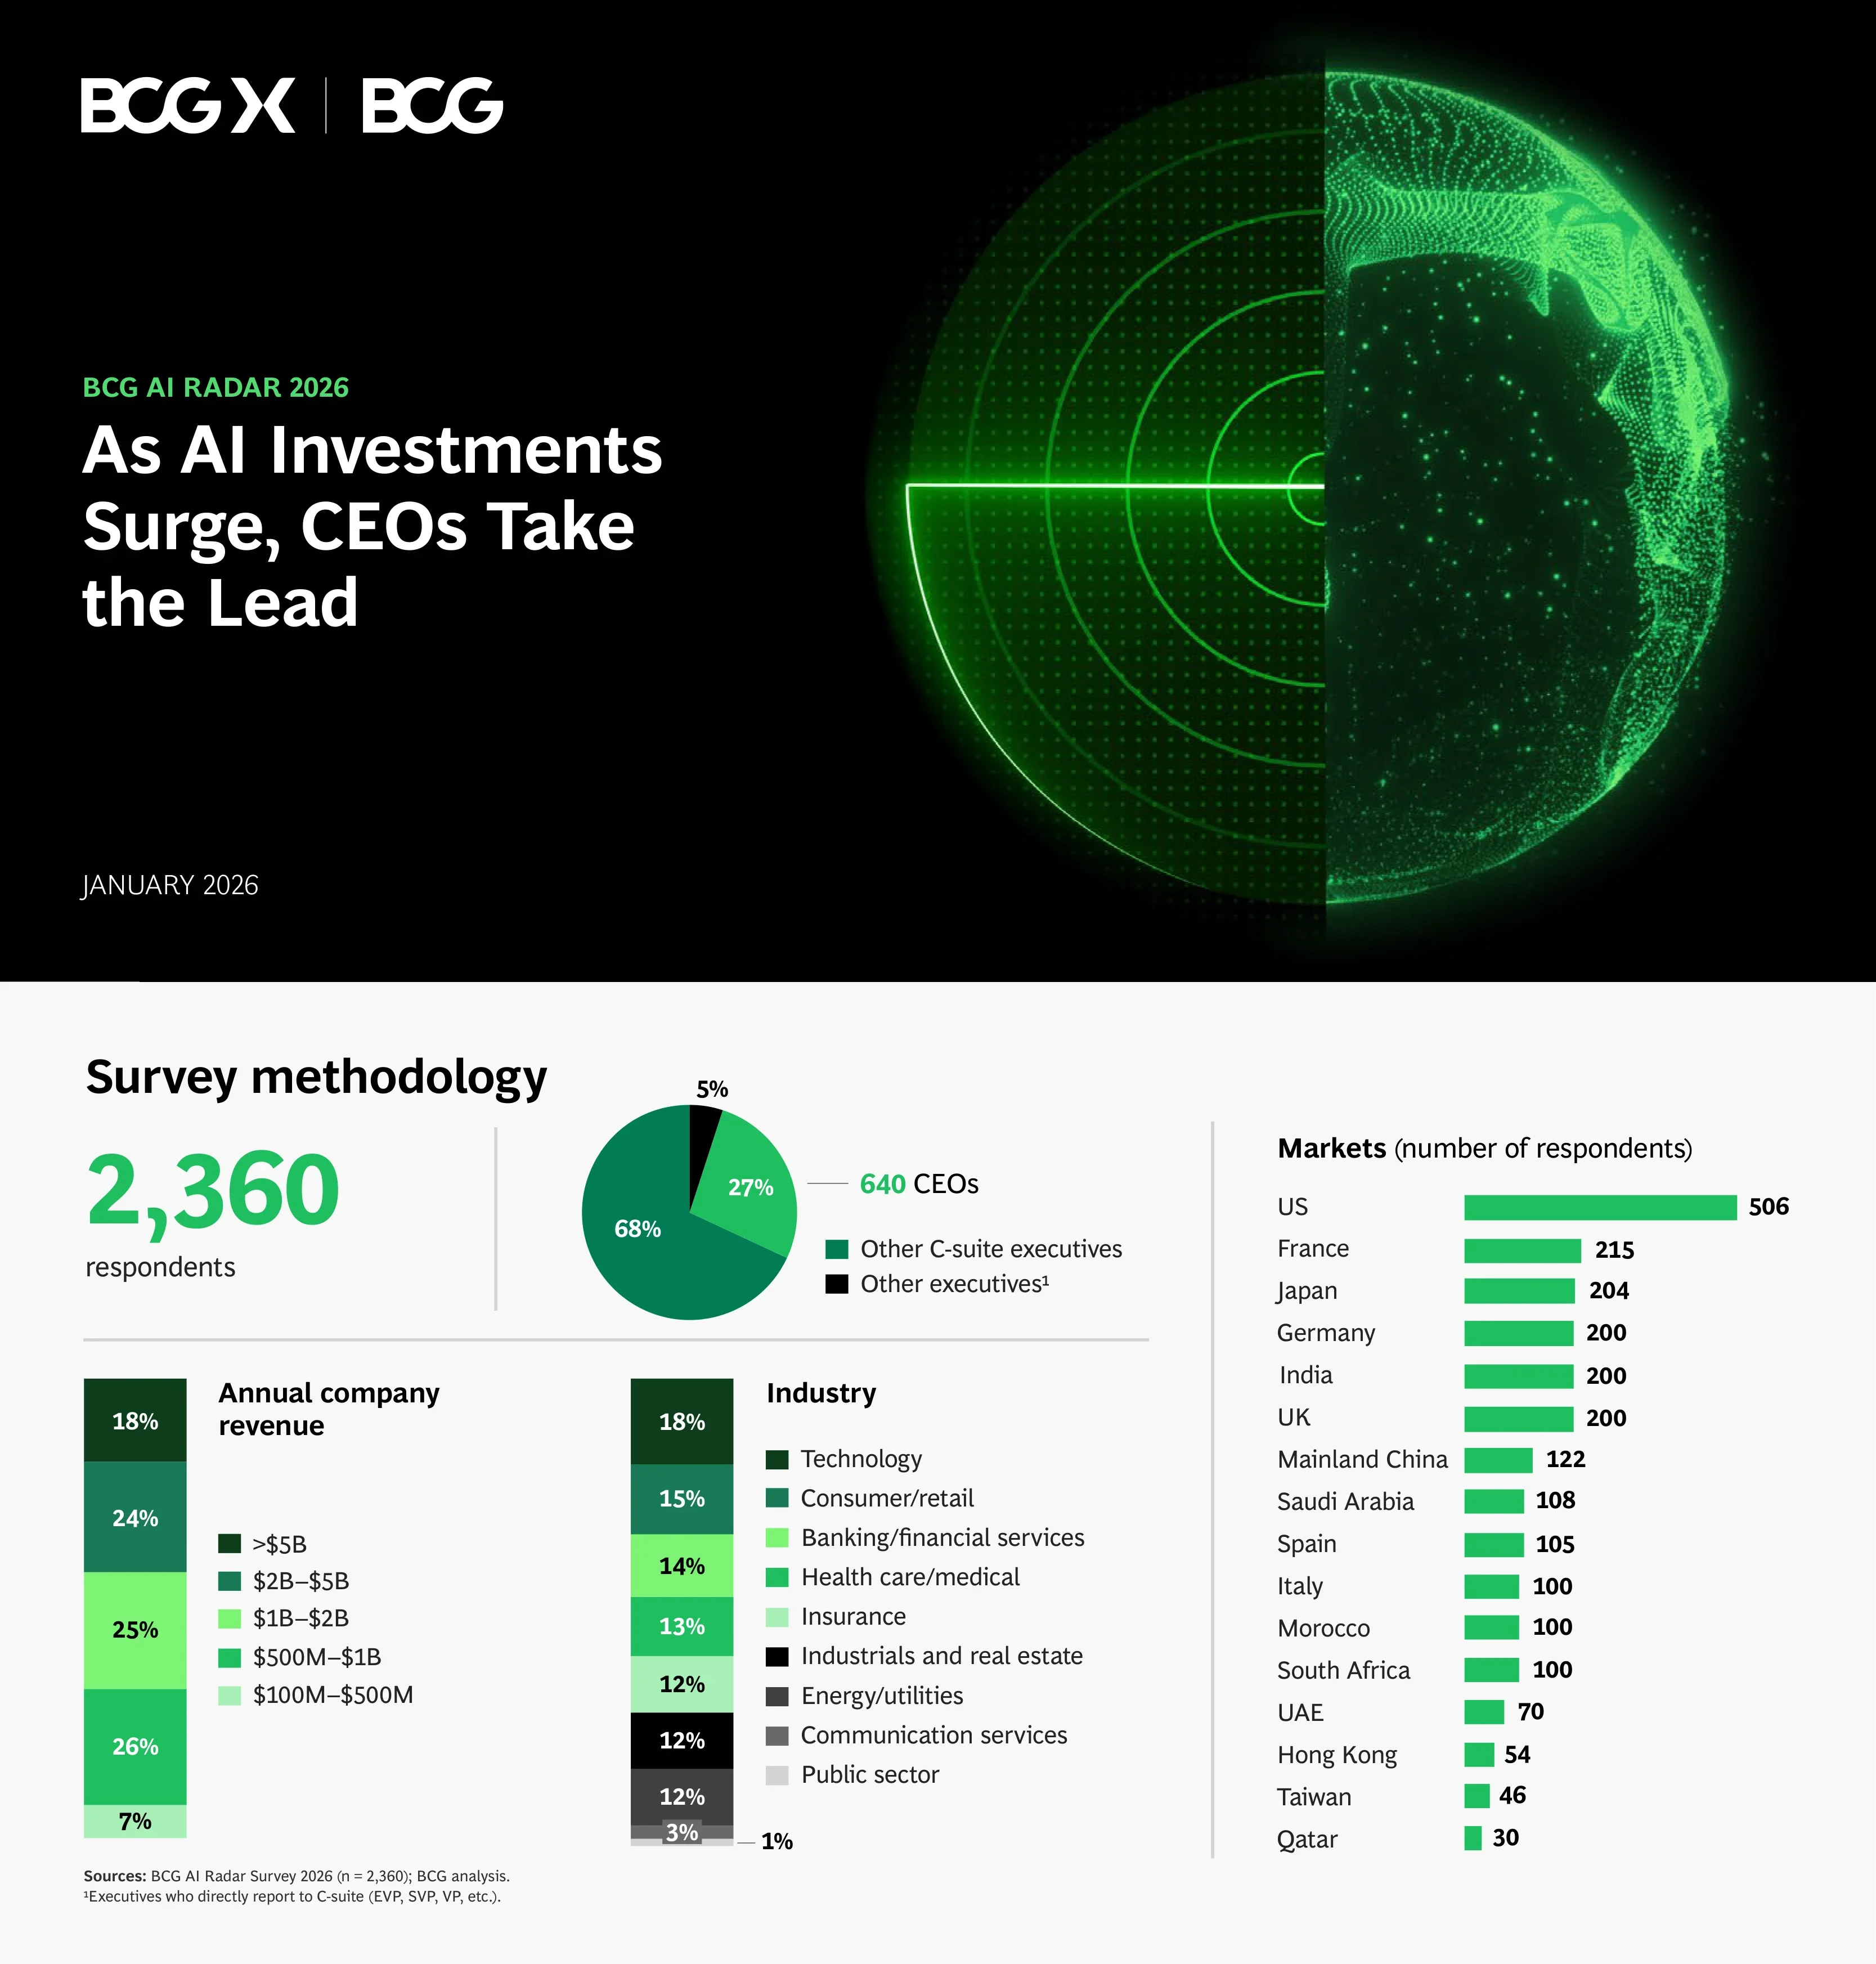
Title slide for BCG AI Radar 2026 report, January 2026.
Full-bleed black background with green radar globe visual on right, BCG X | BCG logo top left
2,360 respondents: 640 CEOs (27%), other C-suite (68%), other executives (5%). Across 16 markets led by US (506), France (215), Japan (204), Germany (200). Revenue breakdown from $100M-$500M to >$5B. Nine industry sectors from Technology (18%) to Public sector (1%).
Multi-chart dashboard with pie chart, stacked bar charts, and horizontal bar chart for markets
(1) AI investments doubled since last year, 94% will continue investing even without payoff in 2026. (2) AI transformation moving from CIO-led to CEO-led, 72% of CEOs are main decision makers. (3) Three CEO archetypes emerge, Trailblazers spend 60% of AI budget on agentic AI.
Three color-coded columns (green gradient to black) with large statistics
Section divider for Takeaway 1.
Black background with green gradient card on right
Only 6% plan to pull back. 70% will stay the course or make strategic changes. 24% will ramp up resourcing and invest in outside experts.
Split layout: 94% stat on black left, stacked bar chart on right showing three response categories
AI investment as % of revenue: ~0.6% (2024), ~0.8% (2025), ~1.7% (2026) - a 2x increase. Based on BCG AI Radar surveys across three years.
Split layout: key insight on black left, three bar charts showing year progression with 2x badge
2025 vs 2026 investment by industry: Technology leads (1.2%→2.1%), Financial institutions (0.9%→2.0%), Insurance (0.6%→1.9%), Energy (0.6%→1.9%). All industries average: 0.8%→1.7%.
Grouped bar chart with 2025 (black) and 2026 (green) bars for nine industries
Top 3 declining concerns: Data privacy (53%, -12pp), Lack of control (41%, -7pp), Regulatory compliance (39%, -5pp). Rising concerns: Technological failure (38%, +6pp), Environmental impact (17%, +10pp), Geopolitical instability (13%, +8pp).
Split layout: key insight on black left, two groups of horizontal bars on right (declining and rising concerns)
9% view cybersecurity as biggest threat from agentic AI, 32% as biggest opportunity, 59% as both. Threat dimensions: automation, scale, system access, new targets, learning. Opportunity: continuous monitoring, log analysis, security compliance, account checking, defense learning.
Three-column layout: threat (green), center (59% circle), opportunity (black) with five matching dimensions
Section divider for Takeaway 2.
Black background with green gradient card
72% of CEOs say they are the main AI decision maker (2x last year). 82% are more optimistic about AI ROI potential than last year.
Split layout: 72% on black left with 2x badge, 82% on white right
50% of CEOs believe their job stability depends on getting AI investments and strategy right by 2026.
Split layout: key insight text on black left, 50% donut chart on green right
Three metrics compared across five roles: Ready to lead AI transformation (CEO 39%, down to Nontech 25%), Confident AI will pay off (CEO 62%, down to Nontech 48%), Expect major role disruption by 2030 (CEO 60%, down to Nontech 27%).
Three-column horizontal bar chart comparing five executive levels
Global East confidence: India 76%, Greater China 73%, Japan 70%, Middle East/Africa 63%. Global West: Europe 61%, US 52%, UK 44%.
Split layout: key insight on black left, two horizontal bar chart groups (East/West) on right
Dual-line chart: % confident AI will pay off (green) vs % pressured to act (gray). West is more pressure-led (UK 26%, US 23%), East is more value-led (India 76% confident but only 3% pressured, Greater China 73% vs 8%).
Dual-line scatter chart with West-to-East progression, annotation for value vs pressure led
~90% of CEOs believe AI agents will enable measurable ROI in 2026. >30% of AI investment committed to agentic AI.
Split layout: ~90% stat on black left, >30% stat on white right
AI agent roles currently vs in 3 years: Assistant (26%→61%), Colleague (11%→35%), Rival (8%→26%), Boss (5%→18%), Mentor (12%→36%), Coach (13%→42%). From BCG-MIT Sloan Management Review 2025 report.
Paired horizontal bar chart with six AI agent roles, current (black) vs 3 years (green)
AI systems gaining autonomy: work independently (14%→39%, +179%), have decision-making authority (10%→35%, +250%), work with ambiguous inputs (37%→57%, +54%). From BCG-MIT Sloan Management Review 2025.
Split layout: 58% stat on black left, three grouped bar charts on right with growth percentages
Three stages: Deploy AI in everyday tasks (staying competitive), Reshape critical workflows and functions (building advantage), Invent new business models and revenue streams (building advantage).
Three cards on spectrum from staying competitive to building advantage, with icons
Section divider for Takeaway 3 - Trailblazer CEOs leading end-to-end AI transformation.
Black background with green gradient card
K-means clustering reveals three types: Followers (AI investment 24%, workforce upskilled 35%, 5h/week on AI, anxious), Pragmatists (27%, 41%, 7h, excited), Trailblazers (73%, 69%, 8+h, very confident).
Three-column comparison table with icons, five metrics per archetype
Distribution: ~15% Followers (cautious investments), ~70% Pragmatists (invest when they see value), ~15% Trailblazers (decisive investment, rapid upskilling). Spectrum of increasing confidence, investment, and excitement.
Three-tier progression with dashed trajectory arc, percentage badges, and descriptions
Five-step flywheel: (1) Make AI priority (2x: 12%→24%→24%), (2) Deepen AI literacy (3.4x: 19%→39%→65%), (3) Invest capital at scale (2.8x: 31%→44%→87%), (4) Upskill organization (2.7x: 34%→48%→92%), (5) Track ROI (3.6x: 18%→41%→64%).
Circular flywheel diagram with five numbered steps, each with three-bar comparison chart
Share of CEOs agreeing end-to-end AI transformation is greatest opportunity: Followers 30%, Pragmatists 40%, Trailblazers 58% (~2x vs Followers).
Split layout: key insight on black left, three ascending bars with archetype icons on right
Trailblazers spend ~60% of AI budget on agentic AI vs 25% for both Pragmatists and Followers.
Split layout: key insight on black left, donut charts (large Trailblazers 60%, smaller Pragmatists 25%, Followers 25%) on right
~60% of AI budget allocated to upskilling (vs 27% Pragmatists, 24% Followers). ~70% of workforce upskilled/reskilled (vs 41% Pragmatists, 35% Followers).
Two side-by-side donut chart comparisons, each with large Trailblazer and two smaller comparisons
Foxconn: $400M+ targeted savings from scalable AI platform across 200+ factories. Reckitt: Quality output doubled through end-to-end AI workflow reinvention, cutting routine activities by 90%.
Two green gradient case study cards side by side with product icons
Five-step flywheel: (1) Make AI your key priority - be the disruptor, (2) Deepen AI literacy - expand AI fluency, (3) Commit investments at scale - invest across end-to-end functions, (4) Upskill the organization - optimize productivity/creativity/judgment, (5) Track measurable ROI from AI.
Circular flywheel diagram with five numbered steps and descriptions, black background
Corporate AI investment is here to stay: 94% will invest, 1.7% of revenue, 2x increase. CIO-to-CEO shift: 72% are main decision makers (2x last year), 50% believe job depends on AI, 90% believe agents deliver ROI.
Six key statistics in two rows on green gradient background
Common questions about this slide and the underlying presentation content.
It is BCG's third annual global survey on corporate AI adoption, published January 2026. It surveyed 2,360 executives including 640 CEOs across 16 markets and nine industries, examining AI investment trends, CEO sentiment, and the emerging role of agentic AI.
AI investment as a share of revenue has doubled to approximately 1.7% in 2026, up from ~0.8% in 2025 and ~0.6% in 2024. 94% of organizations say they will continue investing even if AI does not produce the desired financial impact in 2026.
BCG identified three types via K-means clustering: Followers (~15%, cautious, 24% AI investment share), Pragmatists (~70%, invest when they see value, 27% share), and Trailblazers (~15%, decisive investment with 73% share, very confident, 69% workforce upskilled).
Trailblazers invest 73% of their transformation budget in AI (vs 24-27%), upskill 69% of their workforce (vs 35-41%), spend 8+ hours per week on AI literacy, are very confident AI will pay off, and allocate ~60% of their AI budget specifically to agentic AI compared to just 25% for others.
72% of CEOs now say they are the main decision maker on AI in their organization, double from last year. AI transformation is shifting from a CIO-led to a CEO-led initiative. 50% of CEOs believe their job stability depends on getting AI strategy right by 2026.
CEOs in the Global East show higher confidence: India 76%, Greater China 73%, Japan 70%. In the Global West, confidence is lower: Europe 61%, US 52%, UK 44%. Eastern CEOs are more value-led while Western CEOs tend to feel more pressure-led.
~90% of CEOs believe AI agents will enable measurable ROI in 2026. Trailblazer CEOs allocate approximately 60% of their AI budget to agentic AI, compared to 25% for Pragmatists and Followers. Overall, more than 30% of AI investment is now committed to agentic AI.
BCG recommends a five-step flywheel: (1) Make AI and agentic AI a top priority, (2) Deepen personal and organizational AI literacy, (3) Commit investments at scale across end-to-end business functions, (4) Upskill the workforce for productivity, creativity, and judgment, (5) Track measurable ROI from AI to drive sustainable returns.

Create Your Own Slides
Turn your ideas into professional presentations in seconds with 2slides AI.
Reference professional designs, choose your style, and generate slides with perfect text rendering. Powered by Nano Banana—start creating your presentation now.
Your AI Agent for slides. Save time, shine faster with intelligent presentation creation.




© 2026 2slides. All rights reserved.