
Part of Investor presentation examples · Indian investor presentation examples
Bajaj Finserv Limited's Investor Presentation for Q2 FY2027 (quarter ended 30 September 2026, July to September 2026 of the Indian fiscal year ending 31 March 2027), reporting consolidated revenue of ₹43,416 crore (+16.7%), consolidated profit after tax of ₹5,952 crore (+25.4%) and PAT attributable to owners of ₹2,758 crore (+22.9%). The 117-page deck was filed with BSE and NSE (NSE: BAJAJFINSV, BSE: 532978) on 3 November 2026 and covers Bajaj Finance, Bajaj Housing Finance, Bajaj General Insurance, Bajaj Life Insurance, Bajaj Finserv Health, Bajaj Finserv Direct (Bajaj Markets), Bajaj AMC and Bajaj Financial Securities. All amounts are in ₹ crore, where one crore equals 10 million.
Uses this deck’s cover as a style reference for slides made from your own content. Or pick any page below to use its layout as the reference.
Quick Navigation
Tags
Share the slides
Bajaj Finserv Limited's Investor Presentation for Q2 FY2027 (quarter ended 30 September 2026, July to September 2026 of the Indian fiscal year ending 31 March 2027), reporting consolidated revenue of ₹43,416 crore (+16.7%), consolidated profit after tax of ₹5,952 crore (+25.4%) and PAT attributable to owners of ₹2,758 crore (+22.9%). The 117-page deck was filed with BSE and NSE (NSE: BAJAJFINSV, BSE: 532978) on 3 November 2026 and covers Bajaj Finance, Bajaj Housing Finance, Bajaj General Insurance, Bajaj Life Insurance, Bajaj Finserv Health, Bajaj Finserv Direct (Bajaj Markets), Bajaj AMC and Bajaj Financial Securities. All amounts are in ₹ crore, where one crore equals 10 million.
Detailed view of each slide page, including layout, key content and visual elements.
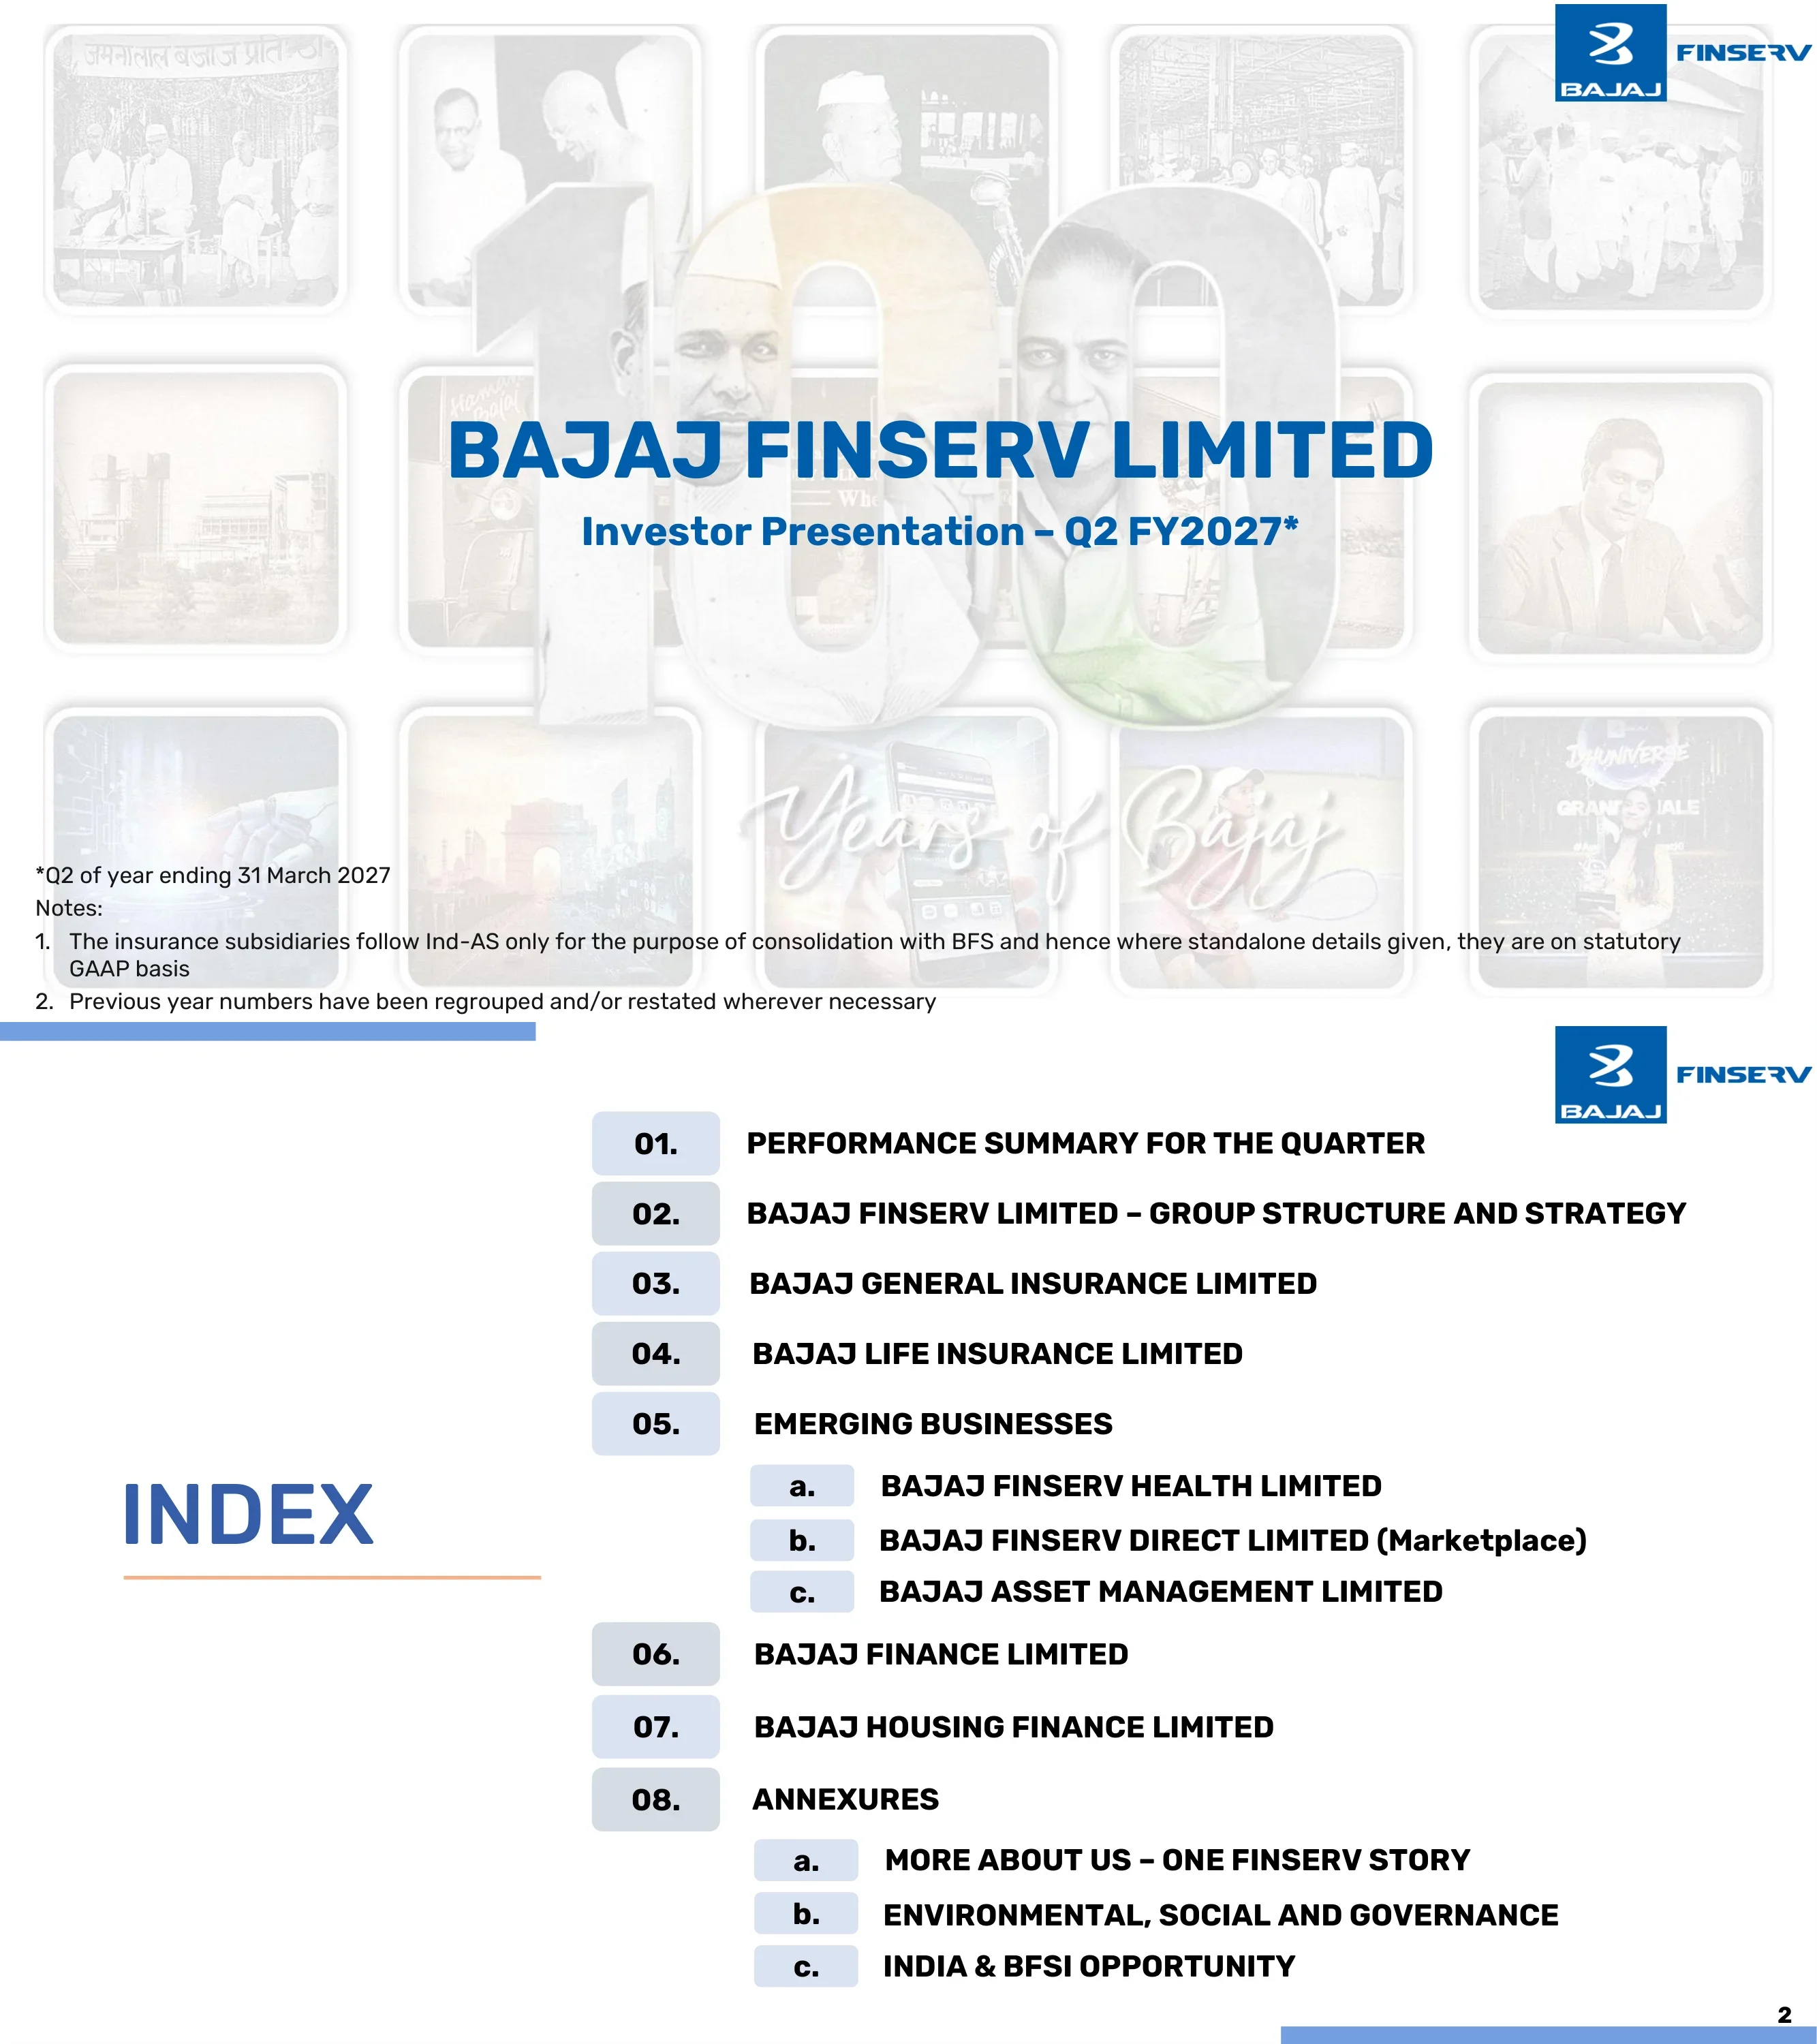
Cover of the Q2 FY2027 investor presentation (quarter of the year ending 31 March 2027). Notes state that insurance subsidiaries are on statutory GAAP for standalone figures and that prior-year numbers are regrouped.
Bold title block over a faded collage of historical photos with a large '100 Years of Bajaj' script and small footnotes below.
Agenda of eight numbered sections: performance summary, group structure and strategy, Bajaj General, Bajaj Life, emerging businesses (Health, Direct, AMC), Bajaj Finance, Bajaj Housing Finance and annexures.
Large 'INDEX' heading on the left with a numbered list 01 to 08 and lettered sub-items on the right.
Divider introducing the quarterly performance summary section.
Text-only slide with large blue capitals and an orange-boxed subtitle.
Consolidated revenue ₹43,416 crore (+16.7% vs ₹37,215 crore), consolidated PAT ₹5,952 crore (+25.4%) and PAT attributable to owners ₹2,758 crore (+22.9%). H1 revenue was ₹85,453 crore (+17.8%) and consolidated net worth ₹83,974 crore (+9.8%).
Navy-header table with Q2, H1 and FY2026 column groups and an orange-bordered note on MTM losses at Bajaj General (₹121 crore) and Bajaj Life (₹56 crore).
GWP ₹7,056 crore (+10.0%), GWP ex-crop and government health ₹5,636 crore (+21.3%), PAT ₹420 crore (down 18.8%), ROE 15.1%, combined ratio 104.5% and AUM ₹36,313 crore. Solvency was 229% against a 150% norm.
KPI tiles grouped under blue ribbon headers (Gross Written Premium, Profitability, Other Metrics) with a light-blue commentary column on the right.
GWP ₹10,277 crore (+22.8%), RWRP ₹1,942 crore (+5.0%), VNB ₹512 crore (+39.6%) with margin 21.6%, AUM ₹146,322 crore and PAT ₹55 crore versus ₹13 crore. Retail protection grew 51% and solvency was 255%.
Ribbon-headed KPI tiles (Revenue, VNB and Margin, Other Metrics) beside a light-blue commentary panel.
Net total income ₹15,974 crore (+23.0%), AUM ₹584,624 crore (+26.5%), PAT ₹6,267 crore (+28.5%), ROE 20.6%, GNPA 1.06% and NNPA 0.42%. 1.35 crore new loans were booked and 44 lakh new customers added.
Ribbon-headed KPI tiles for Revenue, Profitability and Other Metrics with commentary bullets on the right.
Net total income ₹1,254 crore (+15.0%), AUM ₹158,205 crore (+24.8%, past ₹1.5 lakh crore), PAT ₹757 crore (+17.7%), ROE 12.7%, GNPA 0.29% and NNPA 0.12%. Capital adequacy was 21.24% with Tier-1 at 20.83%.
Commentary bullets on the left and ribbon-headed KPI tiles on the right.
Bajaj Finserv Direct operating revenue ₹120 crore (+44.6%), PAT ₹(28) crore and net worth ₹242 crore. Bajaj Finserv Health operating revenue ₹190 crore (down 31.9%), PAT ₹(58) crore, net worth ₹414 crore and about 5.7 MM transactions.
Two stacked summaries, each with ribbon headers for Revenue, Profitability and Networth and short commentary bullets.
Bajaj AMC AUM ₹35,768 crore (+24.1%), operating revenue ₹24 crore (+71.5%), PAT ₹(45) crore. Bajaj Financial Securities revenue ₹160 crore (+20.3%), PAT ₹64 crore (+36.2%) and assets under finance ₹12,058 crore (+58.7%).
Two stacked company summaries with ribbon-headed KPI tiles and bullet commentary.
Divider opening the group structure and strategy section.
Large blue circle with the Bajaj logo on the left and section name in thin blue capitals with an orange underline on the right.
India in FY2026 compared with China in 2010: household savings 17.6% to 21.5% of GDP, GDP from ₹345 to ₹920 lakh crore (FY26 to FY35E), and UPI at 22.6 bn transactions a month. General insurance premium is projected from ₹3.4 to ₹11.0 lakh crore.
Dark navy left panel with the headline comparison and right-hand rows of demographic, income, digital-rail and insurance, lending and investment metrics, with a footer banner.
Group shareholding as on 30 Sep 2026: Bajaj Finance 51.30%, Bajaj Housing Finance 86.70% (via Bajaj Finance), Bajaj General and Bajaj Life 77.33% each, Bajaj AMC, Bajaj Financial Securities, Bajaj Finserv Health and Bajaj ALTs 100%, and Bajaj Finserv Direct 80.10% with 19.90% held by others.
Org chart with Bajaj Finserv (Listed) at the top and colour-coded boxes for lending, platforms, insurance and investments, split into direct and indirect subsidiaries.
Five lifecycle needs (asset acquisition, asset protection, family, health and income protection, investment and wealth management, retirement) are mapped to products and solutions companies and platforms across the group.
Orange circle with five need boxes above a dashed panel that separates products and solutions companies from platforms.
Group market capitalisation ₹1,040,000+ crore (10-year CAGR 28%), consolidated AUM ₹800,000+ crore, revenue ₹150,500+ crore and PAT ₹9,800+ crore. 18 crore+ customers, 4,050+ locations and 110,000+ employees.
Three blue columns of big-number stats covering scale, leadership positions and customer and distribution network.
Inputs (capital, brand with 100 years of trust, customer franchise, data and technology, leadership talent) flow through the Bajaj Finserv role of setting direction and tracking outcomes into profitable growth, market share, capital efficiency, resilience and customer satisfaction.
Left-to-right flow from inputs to a central framework box of six group functions to five outcomes, with a quote footer.
Five buckets: risk business (Finance and General, 20%+ ROE target), annuity (Housing 13-15%+ ROE, Life 18-20% ROEV), platform (Health, Markets), new businesses (AMC, ALTs with less than ₹2,000 crore sponsor capital to FY2028) and future opportunities such as re-insurance approved by the Board in July 2026.
Five columns with M, E1, E2 and N maturity badges and short bullet lists.
10-year CAGR of 25.8% for Bajaj Finserv versus Bajaj Finance 28.3%, Nifty Financial Services 13.8% and Nifty 50 11.4%. Sharpe ratio 0.50 and information ratio 0.48 for Bajaj Finserv.
Three KPI cards (CAGR, Sharpe, information ratio) above a rebased share-price line chart from Mar-15 to Mar-26.
Insurance PAT grew from ₹948 crore (FY2019) to ₹1,604 crore (FY2026) and lending PAT from ₹2,197 crore to ₹9,774 crore. During COVID, insurance rose 32% while lending fell 19%; PBT volatility was 17.8% versus 23.0% if engines moved together.
Two bar charts with a dashed COVID callout plus a quarterly PBT correlation table.
Market cap ₹267,223 crore minus Finserv's share of Bajaj Finance ₹299,876 crore gives an implied residual value of minus ₹32,653 crore. The residual includes Life embedded value ₹26,774 crore, Bajaj General, Health, AMC (AUM ₹35,768 crore), Markets and ALTs. Market cap data is as of 29 October 2026.
Equation strip at the top and six cards listing what counts in the residual value.
Five AI domains (Enterprise, Consumer, Agentic, Data AI, AI Governance) with 400+ projects, 150+ deployed and a 500+ member team. H1 FY2027 impact: ₹6,500+ crore loan disbursements and ₹90+ crore insurance revenue.
Orange central circle with five satellite bubbles, description bands, and statistic bars along the bottom.
Investment thesis: financial services growing about 1.5x nominal GDP, a single stock capturing BFSI growth, diversification across lending, insurance and investments, and 100 years of trust.
Single paragraph on a plain slide with key phrases highlighted.
Presented in Dec 2025: total income from ₹134 thousand crore to ₹315-340 thousand crore (about 20% CAGR), PAT from ₹9 to ₹21-24 thousand crore (about 2.5x) and customer franchise from about 100 MM to about 220 MM.
Three paired bar charts (2025 versus 2030) with a forward-looking statement disclaimer.
Divider opening the consolidated financial performance section.
Blue circle with logo on the left and section name in thin blue caps with an orange underline.
Bridge from Bajaj Finance ₹24,576 crore (+23%), Bajaj General ₹9,991 crore (+8%), Bajaj Life ₹9,302 crore (+16%), others ₹356 crore and standalone ₹2,047 crore (+38%) less intercompany ₹(2,856) crore to ₹43,416 crore (+17%) versus ₹37,215 crore.
Two stepped bridge charts (Q2 FY2027 and Q2 FY2026) with a revenue-mix donut and green or red growth markers.
H1 consolidated revenue ₹85,453 crore (+18%) versus ₹72,515 crore, built from Bajaj Finance ₹47,742 crore, Bajaj General ₹18,983 crore, Bajaj Life ₹19,518 crore and standalone ₹3,589 crore (+85%).
Same bridge-and-donut layout as the quarterly slide; the donut is labelled 'Q2 FY2027' in the source although the slide is H1.
PAT attributable to owners ₹2,758 crore (+23%, +22% excluding MTM) from Bajaj Finance ₹3,218 crore (+29%), Bajaj General ₹170 crore (down 37%), Bajaj Life ₹(17) crore, others ₹(142) crore and standalone ₹1,458 crore (+34%) less intercompany ₹(1,929) crore. Q2 FY2026 was ₹2,244 crore.
Two stepped profit bridges for Q2 FY2027 and Q2 FY2026 with an excluding-MTM callout.
H1 PAT attributable to owners ₹5,890 crore (+17%, +13% excluding MTM) from Bajaj Finance ₹6,289 crore (+28%), Bajaj General ₹575 crore (down 20%), Bajaj Life ₹116 crore (+452%) and standalone ₹2,576 crore (+82%).
Two stepped profit bridges for H1 FY2027 and H1 FY2026 with an excluding-MTM callout.
Divider introducing the Bajaj General Insurance section.
Blue circle with the General logo and 'Caringly yours' tagline on the left and the section name on the right.
Strategy of market share growth in chosen segments via a diversified portfolio and multi-channel distribution, with four differentiators: deep and wide distribution, diversified product mix, operational efficiency, and technology and data analytics.
Strategy statement box above four rows, each with a label and bullet panel.
GWP ₹7,056 crore (+10.0%), ex-crop and government health ₹5,636 crore (+21.3%), combined ratio 104.5% (102.0% ex-NATCAT), underwriting result ₹(115) crore, PAT ₹420 crore and solvency 229% versus 339%.
Navy-header table with quarter, period and FY2026 column groups.
GDPI and GDPI ex-crop and government health compared across PSU, private, SAHI and Bajaj General. Q2 FY2027 GDPI growth was 10% for Bajaj General versus 12% for the industry, and 21% versus 13% excluding crop and government health.
Two panels of clustered stacked bars for FY25/26, Q2 and H1 with growth mini-tables and market-share chips.
PBT falls from ₹1,583 crore to ₹1,274 crore before NATCAT after lower realised gains (₹329 crore), lower interest income (₹18 crore) and higher claims ratio (₹176 crore), partly offset by a ₹214 crore expense benefit; NATCAT impact of ₹75 crore leaves ₹1,199 crore.
Single waterfall chart with annotated boxes for underwriting loss and investment income.
Net worth ₹10,731 crore at H1 FY27 with no capital infusion since FY2008 and accumulated profit at 97% of net worth. ROE 15.2% for H1, AUM ₹36,313 crore, realised investment return 8.2% and 94.1% of debt in AAA or sovereign securities.
Four chart panels (capital and net worth, ROE, AUM, realised return) plus an AUM-mix donut (bonds 46%, gsec 33%, equity 17%, others 4%).
Business mix across FY25, FY26, Q2 and H1 periods split into retail motor, retail health, group health, property and liability, crop, government health and others; group health was 24% in H1 FY27.
Six 100% stacked bars with a seven-colour legend.
Channel mix across individual agents, banks, other corporate agents, brokers, direct and others, plus cards on bancassurance (260+ partners), agency (73,900+ agents and 95,000+ POSP), OEMs (50+ tie-ups, 9,500 dealers), rural (3.48 lakh farmers) and digital (25+ partnerships).
Stacked channel-mix bars alongside five channel cards.
Motor OD and TP GDPI mix with loss ratios: in Q2 FY2027 Motor OD was 73.0% (70.0% ex-NATCAT), Motor TP 50.5% and Motor total 60.7%. Q2 FY2027 motor GDPI was ₹2,037 crore.
Business-mix table, loss-ratio chips and stacked GDPI bars across six periods.
Health, PA and travel GDPI of ₹2,762 crore in Q2 FY2027 (₹4,639 crore in H1). Group employer-employee was 64% of the Q2 mix and government schemes 18%; loss ratio was 97.6% in Q2 FY2027.
Business-mix table, loss-ratio row and stacked GDPI bars across six periods.
Commercial lines were 43% and crop 41% of the Q2 FY2027 mix on GDPI of ₹2,230 crore. Loss ratio was 98.1% in Q2 FY2027 and 78.1% excluding NATCAT.
Mix table, loss-ratio chips and stacked GDPI bars by fire, marine, engineering, liability, crop and others.
Net Promoter Score rose from 68 to 74 for health and from 70 to 82 for motor between FY22 and FY26. Grievances per 10,000 new policies were 1.97 for Bajaj General in Q1 FY27 versus 3.61 for the average of top-5 peers.
Two clustered bar charts, NPS over FY22-FY26 and grievances over FY23-Q1 FY27.
H1 FY2027 digital servicing 92.9% (68.9% through AI bots), digital policy issuance 96.0% and digital payment 97.5% with cash at 0.13%. AI initiatives cut motor claims admissibility time by 60%, TP claim registration TAT by 50% and surety bond underwriting TAT by 80%.
Three digital-metric cards on the left and three AI initiative cards on the right.
Platform cards with H1 FY2027 metrics: website 121.6 lakh visitors and 3.0 lakh policies, app 67.8 lakh downloads, B Care portal 22 lakh policies, Farmitra 16.7 lakh downloads, and 240 integrations across 59 partners.
Three-by-three grid of platform cards each with a short description and metric line.
Four pillars: asset quality (94.1% of debt in AAA or sovereign, 88.0% equity in BSE 100), pricing and underwriting, re-insurance and reserving and solvency, noting prudent reserving shown by ultimate loss triangles.
Four left-hand labels, each paired with a bordered bullet box.
Divider introducing the Bajaj Life Insurance section.
Blue circle with the Life logo and 'Life goals. Done.' tagline plus the section name on the right.
Strategy of sustainable and profitable growth with balanced product mix, presence in 598 branches, balanced distribution including Bajaj Life Direct, a ULIP, traditional and group mix, and AI across the lifecycle.
Strategy box above four differentiator rows with bullet panels.
RWRP ₹1,942 crore (+5.0%), retail protection NB ₹217 crore (+50.7%), group protection NB ₹1,357 crore (+80.9%), renewal ₹5,106 crore (+17.3%), GWP ₹10,277 crore, VNB ₹512 crore, NBM 21.6% and solvency 255% versus 346%.
Navy-header table with Q2, H1 and FY2026 column groups.
Q2 FY2027 RWRP growth was 5% for Bajaj Life versus 10% for private insurers and 11% for the industry; H1 growth was 10% versus 12% and 13%. Market share was 5.6% in Q2 FY2027.
Three bar-and-line panels for FY2026, Q2 FY2027 and H1 FY2027 with market-share chips.
RWRP-based product mix across individual unit linked (about 41-45%), par (about 21%), annuity, non-par savings and non-par protection, which was 12% in H1 FY2027.
Six 100% stacked bars with a five-category legend.
Retail protection NBP was ₹217 crore in Q2 FY27 versus ₹144 crore (+51%) and ₹393 crore in H1 (+55%). Group protection NBP reached ₹1,357 crore in Q2 (+81%) and ₹2,723 crore in H1 (+89%).
Two side-by-side bar charts across FY, Q2 and H1 periods with growth callouts.
RWRP by channel: institutional business ₹1,064 crore in Q2 FY27, agency ₹644 crore and Bajaj Life Direct ₹233 crore, with year-on-year, quarter-on-quarter and year-to-date growth chips.
Four small bar panels (whole company and three channels) with growth chips.
Net worth ₹9,774 crore at H1 FY27 with capital invested ₹1,206 crore and no capital infusion since FY2008. AUM ₹146,322 crore (unit linked ₹90,325 crore; other ₹55,997 crore); 96.4% of debt in AAA or sovereign.
Net worth and AUM bar charts with two AUM-mix donuts (ULIP equity 76%, non-ULIP G-sec 53%).
Q2 FY2027 ANP ₹2,364 crore (+10.0%), VNB ₹512 crore (+39.6%) and NBM 21.6%. H1 VNB was ₹783 crore (+52.9%); rolling FY2027 VNB ₹1,897 crore (+44.3%) with NBM 20.8%.
Wide table with Q2, H1 and rolling columns plus explanatory bullets above.
VNB walk from ₹512 crore in H1 FY2026 (NBM 14.8%) plus mix and profile ₹276 crore and volume ₹90 crore to ₹878 crore before GST (NBM 21.6%), then GST impact of ₹(95) crore to ₹783 crore (NBM 19.2%).
Single waterfall chart with NBM labels beneath key bars.
Embedded value rose from ₹25,300 crore (31 March 2026) to ₹26,774 crore (30 Sept 2026) via unwinding ₹1,046 crore, VNB ₹783 crore, operating variance ₹23 crore and investment variance ₹331 crore. EVOP was ₹1,806 crore and annualised RoEV 14.8%.
Waterfall chart with VIF and NAV splits at the start and end plus a summary box.
Persistency at H1 FY27: 81% at 13th month, 71% at 25th, 68% at 37th, 62% at 49th and 52% at 61st month.
Five small bar panels, one per persistency month, each comparing FY25, FY26, H1 FY26 and H1 FY27.
Nine initiatives across business empowerment, login and underwriting, and servicing: Smart Coach, Customer 360, DIGI 2.0 (go-live planned Nov 2026), Customer app (4.9L+ downloads, rating 4.1), Humanoid (about ₹225 crore of renewals), Smart Pitch, analytical models, core system transformation and Marketing Assist.
Three-by-three card grid under three chevron headers.
Digital adoption 89.4%, grievance incidence 69 per 10k policies, digital self-servicing 81.2%, electronic payout 95.2%, retail claim settlement ratio 98.5%, 10.7 lakh customer app transactions and 13.8 lakh WhatsApp users.
Seven rounded metric tiles with definitions in the footer.
Four risk areas: asset quality (96.4% AAA or sovereign debt, 82.3% in NSE100 stocks), product pricing, ongoing risk management, and asset liability management using partly paid bonds and forward rate agreements.
Four labelled rows with bullet panels.
Divider introducing the Bajaj Finserv Health section.
Blue circle with the Health logo and the section name on the right.
India healthcare expenditure was ₹8.8 lakh crore (3.37% of GDP) in FY23. The US outsourcing reference shows ₹3.8 lakh crore already outsourced; India has about 18% of global population but about 1% of healthcare spending.
Three donuts (services, payers, providers), six insight boxes and a US outsourcing bar chart.
A digital-first health-tech company offering wellness, OPD and IPD services, with 130,000+ doctors, 32,000+ hospitals, about 5.6 MM transactions in Q2 FY2027, 660+ doctors for claim adjudication and AI-first claims adjudication.
Strategy box above four differentiator rows with bullet panels.
Platform model linking a network stack (doctors, dental, diagnostics, fitness, hospitals, pharma) with a consumer stack and a payer stack (corporates, insurers, government, international), with indicative progress shown by Harvey-ball icons.
Hub diagram with network stack on one side, consumer in the centre and payer stack on the other.
Five business lines: corporate TPA (premium under management ₹3,879 crore), Ayushman Bharat TPA (121 MM lives), retail TPA, OPD services for 16 insurers and international services (GMV ₹3,131 crore), supported by 660 medical professionals and 500+ technology resources.
Tree diagram with a parent box and five child boxes of stats.
Twenty services from preventive to tertiary care over 12 months: preventive 2,117,704, primary 19,631,230, secondary 544,041 and tertiary 2,184,495 transactions, with pharmacy the largest at 14,779,365.
Four columns of services with counts and tags for services offered by Vidal Health or BFHL.
Six business segments (employer-employee, government, retail products to insurers, value-add products, technology services, consumer services) supported by 2,400+ partners, 9 state schemes and a 20-service canvas.
Six vertical cards with a stats strip beneath.
Healthcare transactions moved from 5,922 thousand in Q2 FY26 to 5,694 thousand in Q2 FY27, with transaction value from ₹3,049 crore to ₹3,295 crore. Key developments include winning Tamil Nadu NHIS and onboarding Star Health for OPD plans.
Two stacked-bar charts over five quarters beside a key developments list.
Total income ₹192 crore versus ₹285 crore, PAT ₹(58) crore, capital infused ₹1,250 crore and net worth ₹414 crore. H1 metrics include 112,284 monitored transactions, ₹44 crore saved by fraud prevention and 74.50% discharges within 60 minutes.
Financial table on the left with six metric tiles on the right.
Divider introducing the Bajaj Finserv Direct (Bajaj Markets) section.
Blue circle with the Markets logo and section name on the right.
Contrasts product-out Bajaj Finance with customer-in Bajaj Markets (55+ lenders) using an Amazon versus Amazon Marketplace analogy. Digital lending is projected to cross a ₹11,310 crore opportunity by FY2030.
Two-column B2C versus B2B2C comparison with analogy logos and a strategic edge band.
Strategy to become a profitable, AI-first platform with the widest choice of BFSI products; differentiators cover open architecture, diversified product mix, technology and data analytics, and operational efficiency.
Strategy box above three differentiator rows with bullets.
Supply side of 100+ partners and 34 financial products with 140+ offerings meets a demand side with 221+ MM traffic, 48+ MM app installs and 90K+ transacting customers in Q2.
Supply-side to open-architecture marketplace to demand-side flow with six grey cards.
Partner counts by vertical and category total 106 unique partners, including 58 in lending, 19 in insurance, 29 fintechs, 20 NBFCs and 10 banks.
Logo wall grouped by banks, NBFCs, fintechs and insurers with two partner-count tables.
Total income ₹123 crore versus ₹90 crore, PAT ₹(28) crore, capital infused ₹809 crore and net worth ₹242 crore. Lending volume grew from ₹1,549 crore to ₹2,535 crore and organic traffic from 28 to 47 lakh.
Financial table beside two bar charts of lending volume and organic traffic.
Divider introducing the Bajaj AMC section.
Blue circle with the Asset Management logo and the section name on the right.
Industry AUM grew from ₹2,300 to ₹7,373 thousand crore (2020 to 2026), SIP inflow from ₹8,200 to ₹32,087 crore a month and retail investors from 2.1 to 6.0 crore. AUM is projected to scale from ₹74 to ₹2,791 lakh crore by 2047.
Three columns: growth outlook bars, AUM-to-GDP comparison chart and a 2026 to 2047 scalability table.
Innovative, future-focused and differentiated AMC built on differentiated products, technology, the INQUBE investment philosophy, risk management, and data and analytics.
Semicircle central statement surrounded by five pillar blocks.
Equity strategies mapped from category to investment strategy to style, from flexi cap and megatrends to small cap with a true-to-label approach.
Three-column chevron table of category, strategy and style.
Total income ₹24.2 crore, PAT ₹(45.1) crore, capital infused ₹900 crore and net worth ₹137 crore. AUM was ₹35,768 crore (equity ₹21,379 crore, debt ₹13,053 crore, passives ₹1,337 crore) and distributors reached 52,996.
Financial table, AUM breakdown table and two bar charts of quarterly AUM and distributors.
Divider introducing the Bajaj Finance section.
Blue circle with the Finance logo and the section name on the right.
Strategy targets ROA of 4.3%-4.7% and ROE of 19%-21%; customer franchise 12.88 crore with cross-sell base 8.23 crore. AUM mix was 30% urban, 12% rural, 13% MSME, 13% commercial and 32% mortgages.
Strategy box above five differentiator rows with bullet panels.
AUM ₹584,624 crore (+26.5%), franchise 12.88 crore, deposits ₹69,754 crore, net total income ₹15,974 crore, PAT ₹6,267 crore, ROA 4.6%, ROE 20.6%, opex to NTI 33.0%, GNPA 1.06% and NNPA 0.42%.
Navy-header table with quarter, period and FY2026 columns.
1.35 crore new loans, 44.2 lakh new customers, cost of funds 7.31%, loan losses ₹2,166 crore and CRAR 20.33%. Bajaj Financial Securities: net total income ₹160 crore, PAT ₹64 crore and ROE 11.6%.
Bulleted highlights list with a Bajaj Financial Securities band at the bottom.
Total franchise reached 12.89 crore with cross-sell franchise of 8.23 crore (63.9%). Quarterly franchise additions were 0.44 crore in Q2 FY2027.
Inverted funnel comparing Q2 FY26, Q2 FY27 and Q1 FY27 plus a chevron row of quarterly additions.
Divider introducing the Bajaj Housing Finance section.
Blue circle with the Housing logo and section name on the right.
Focus on a scalable balance sheet with reasonable ROE, a low-risk model anchored by Prime Housing and Lease Rental Discounting, a full mortgage suite and diversified borrowings across banks, money market and NHB.
Strategy box above four differentiator rows with bullets.
AUM ₹158,205 crore (+24.8%), net total income ₹1,254 crore, PAT ₹757 crore, ROA 2.2%, ROE 12.7%, GNPA 0.29%, NNPA 0.12%, opex to NTI 19.1% and disbursements ₹19,935 crore (+25.3%).
Navy-header table with quarter, period and FY2026 columns.
Divider introducing the annexures section.
Text-only blue caps title with an orange underline.
Divider introducing the One Finserv story annexure.
Text-only blue caps title with an orange underline.
Wheel of customer needs around 'BFS Customers' (consumer lending, credit lines, MSME, mortgage, general and life insurance, wellness, asset management, broking, payments, rewards, partnerships) with blurbs on how each business serves them.
Circular wheel with ring labels in the centre and blue-highlighted text blurbs surrounding it.
Eight principles: broadening offerings (750+ products, 4,000+ cities, 0.5 MM+ distribution network), deep partnerships, new initiatives, desire to differentiate, digitisation, continuous benchmarking, customer obsession, and efficient risk and capital management.
Eight dashed-border boxes with bullet lists.
Purpose statement about innovation, agility and ownership, supported by four founder's ethos values (customer obsession, develop and delegate, growth mindset, being responsible) and four behaviours (innovate to simplify, talent builder, continuous transformation, do the right thing).
Purpose quote box above two icon rows for ethos and behaviours.
Eight company cards as of 31 March 2026, including Bajaj Finance with ₹100 invested in 2000 becoming ₹2,34,715, Bajaj Life 5-year VNB CAGR of 35%, and Bajaj Housing Finance AUM ₹140,706 crore. The BFL card's AUM of ₹372,986 crore does not match the FY2026 AUM of ₹509,975 crore shown on page 95.
Eight company cards with bullet lists and a footer on AAA (Stable) and A1+ ratings.
At 30 Sep 2026 capital adequacy or solvency was 20% for BFL, 255% for Bajaj Life, 229% for Bajaj General and 21% for BHFL, with excess capital of ₹40,261 crore in total. Net capital generated since 1 Apr 2021 was ₹9,664 crore.
Wide table with column per company and rows for minimum, actual, excess and net capital generated.
Bajaj Finserv consolidated net total income ₹150,523 crore and PAT ₹9,801 crore in FY2026; Bajaj General GWP ₹23,326 crore with combined ratio 102.8%; Bajaj Life VNB ₹1,626 crore, embedded value ₹25,299 crore and AUM ₹133,563 crore.
Table of FY2016, FY2021, FY2025 and FY2026 values with growth, 5-year and 10-year CAGR columns.
Bajaj Finance FY2026 net total income ₹54,126 crore, PAT ₹19,332 crore, AUM ₹509,975 crore and ROE 18.1%; Bajaj Housing Finance PAT ₹2,560 crore and AUM ₹140,706 crore.
Same table layout as the previous slide covering Bajaj Finance and Bajaj Housing Finance.
Divider introducing the ESG update.
Text-only title with subtitle on a plain slide.
Eight focus areas: governance, financial inclusion, preserving and protecting environment, empowering society, customer centricity, human capital management, information and cyber security, and stakeholder engagement.
Two-by-four grid of icon cards with short descriptions.
Responsible investments of 95% (Bajaj General) and 98% (Bajaj Life), 30+ MM new-to-credit customers, wind power 90.4 MM kWh, CSR expenditure ₹416 crore with 9.3 MM beneficiaries, and claim settlement of 99.3% (Life retail) and 95.4% (General). Gender diversity is about 14%.
Six icon panels with bullets and a banner on renewable energy and carbon neutrality by FY2032.
Through Bajaj Beyond, Bajaj Group companies committed ₹5,000 crore over five years to impact 2 crore individuals, across youth skilling, child development and Pune city infrastructure.
Commitment header above three columns with a photo strip.
Divider introducing the India and BFSI opportunity annexure.
Text-only title with subtitle.
1.45 Bn+ Aadhaar IDs generated, UPI at 24.07 Bn monthly transactions in Sep 2026, ONDC with 500 million+ transactions, fintech market at USD 422 billion by 2029 and 97.8 Crore+ ABHA IDs.
Icon infographic with statistic callouts grouped by theme.
India remains under-insured: penetration is 2.7% for life and 1.0% for non-life as a share of GDP, and insurance density is US$72 for life and US$25 for non-life. India's GDP per capita CAGR for FY2015-25 is 6.2%.
Four charts covering penetration, density, GDP per capita CAGR and population composition.
Divider introducing the product suites and supplementary analysis.
Text-only blue caps title.
Product lists for personal, commercial, SME, rural and partnership segments, with new products launched during the period highlighted in orange.
Five dense text columns with orange highlights and an icon illustration strip.
Product quadrant by need: mortality (life protection), long-term wealth, longevity (retirement planning) and morbidity (health protection). The text layer is image-based, so only product logos appear.
Quadrant circle surrounded by product logos and riders.
Numbered product lists for Bajaj Finance across consumer, SME, commercial, rural, deposits, payments and partnerships, plus nine Bajaj Housing Finance products and ten Bajaj Financial Securities products.
Dense numbered columns grouped by segment and company.
Five-year (FY2022-FY2026) comparison: GWP CAGR 13.1% versus 10.7%, combined ratio 101.1% versus 118.5%, cumulative PAT ₹8,011 crore versus ₹4,859 crore, ROE 15.9% versus 1.3%, market share 7.4% to 8.3% and solvency 302% versus 119%.
Six KPI boxes with green up arrows and explanatory text, plus an IFRS 17 note.
GDPI growth by line: Q2 FY2027 motor total 18.3% versus industry 12.4%, group health 33.4% versus 16.9%, and total excluding crop and government health 21.5% versus 13.2%.
Table of lines of business with Q2 and H1 columns for Bajaj General and industry, plus commentary bullets.
Q2 FY2027 net loss ratios: fire 136.0% (69.2% ex-NATCAT), motor total 60.7%, health, PA and travel 97.6% and total 83.7%; total excluding crop, government health and NATCAT was 74.2%.
Table of lines of business with Q2 and H1 loss ratios for FY2027 and FY2026.
Dense accident-year cohort table of ultimate net loss re-estimates as at 31 March 2026. The original estimate for the 2016-and-before cohort is ₹16,869 crore and favourable development is ₹967 crore for AY2021.
Wide triangular numeric table with accident-year columns and diagonal re-estimate rows.
Dense accident-year cohort table of cumulative payments. For the 2016-and-before cohort, 89% is paid by year 4 and 92% by year 7, with net claims provisions of ₹3,532 crore.
Wide triangular numeric table with payment diagonals and percent-paid rows.
Dense accident-year cohort table for Motor TP. Original estimate for the 2016-and-before cohort is ₹4,087 crore and favourable development is ₹559 crore for AY2021.
Wide triangular numeric table with accident-year columns and diagonal re-estimate rows.
Dense cumulative payment table for Motor TP showing a long tail: only 24% to 27% of recent cohorts is paid by year 4 and 41% to 48% by year 7, versus 57% and 69% for the 2016-and-before cohort.
Wide triangular numeric table with payment diagonals and percent-paid rows.
The IMTPIP pool ran from 1 April 2007 to 31 March 2012, and ₹2,059 crore was paid to Bajaj General. At FY2026 expected claims were ₹2,374 crore, paid ₹2,118 crore and the provision ₹256 crore.
Explanatory bullets above a small three-column reserving table.
Five-year (FY2021-FY2026) comparison: GWP CAGR 22% versus 10%, RWRP 25% versus 12%, VNB 35% versus 17%, AUM 13% versus 11%, solvency 266% versus 170%-240% and market share 3.3% to 5.7%.
Six KPI boxes with explanatory text and an IFRS 17 tailwind note.
Closing slide of the Q2 FY2027 investor presentation.
Centred 'Thank You' message on a plain slide with the Bajaj logo.
Legal disclaimer stating the presentation is for information only and not an offer of securities, that forward-looking statements involve risks and uncertainties, and that readers must make their own assessment.
Dense legal text across the full slide.
Common questions about this slide and the underlying presentation content.
Bajaj Finserv follows the Indian fiscal year from April to March. FY2027 runs from April 2026 to March 2027, so Q2 FY2027 is July to September 2026 (the quarter ended 30 September 2026) and H1 FY2027 is April to September 2026.
It is the English-language original investor presentation, filed with the stock exchanges BSE and NSE (NSE: BAJAJFINSV, BSE: 532978) on 3 November 2026. All amounts are in ₹ crore (one crore equals 10 million) unless a slide states otherwise.
Consolidated total revenue was ₹43,416 crore (+16.7%) and consolidated profit after tax was ₹5,952 crore (+25.4%). Profit after tax attributable to owners was ₹2,758 crore (+22.9%), and consolidated net worth was ₹83,974 crore.
It covers Bajaj Finance, Bajaj Housing Finance, Bajaj General Insurance, Bajaj Life Insurance, Bajaj Finserv Health, Bajaj Finserv Direct (Bajaj Markets), Bajaj AMC and Bajaj Financial Securities. The sections are performance summary, group structure and strategy, financial performance, one section per company, and annexures on the One Finserv story, ESG, and the India and BFSI opportunity.
Bajaj Finance reported AUM of ₹584,624 crore and PAT of ₹6,267 crore. Bajaj Life reported VNB of ₹512 crore with a new business margin of 21.6%, and Bajaj General's combined ratio was 104.5%.
Yes, as a structural reference. It shows KPI tiles under ribbon headers, consolidated revenue and profit bridges, waterfall charts, capital tables, section dividers and accident-year loss triangles. Use the layouts as inspiration and replace all content with your own figures.
Yes, the PDF is available to download from this gallery page. The content is Bajaj Finserv's own public investor presentation, and the deck's disclaimer states it is not an offer of securities.

Create Your Own Slides
Turn your ideas into professional presentations in seconds with 2slides AI.
Reference professional designs, choose your style, and generate slides with perfect text rendering. Powered by Nano Banana—start creating your presentation now.
Your AI Agent for slides. Save time, shine faster with intelligent presentation creation.


© 2026 2slides. All rights reserved.