
Part of Investor presentation examples · Australian investor presentation examples
Australian Foundation Investment Company NZ Shareholder Information Meeting November 2026 — the presentation Australian Foundation Investment Company Ltd (ASX: AFI, also NZX-listed), Australia's largest listed investment company, gave to its New Zealand shareholders and lodged with the ASX on November 15, 2026. It covers the new CEO's priorities, FY27 dividend guidance and the move to quarterly dividends, recent portfolio buying and selling, performance to 31 October 2026, the top 25 holdings and the international portfolio.
Uses this deck’s cover as a style reference for slides made from your own content. Or pick any page below to use its layout as the reference.
Quick Navigation
Tags
Share the slides
Australian Foundation Investment Company NZ Shareholder Information Meeting November 2026 — the presentation Australian Foundation Investment Company Ltd (ASX: AFI, also NZX-listed), Australia's largest listed investment company, gave to its New Zealand shareholders and lodged with the ASX on November 15, 2026. It covers the new CEO's priorities, FY27 dividend guidance and the move to quarterly dividends, recent portfolio buying and selling, performance to 31 October 2026, the top 25 holdings and the international portfolio.
Detailed view of each slide page, including layout, key content and visual elements.
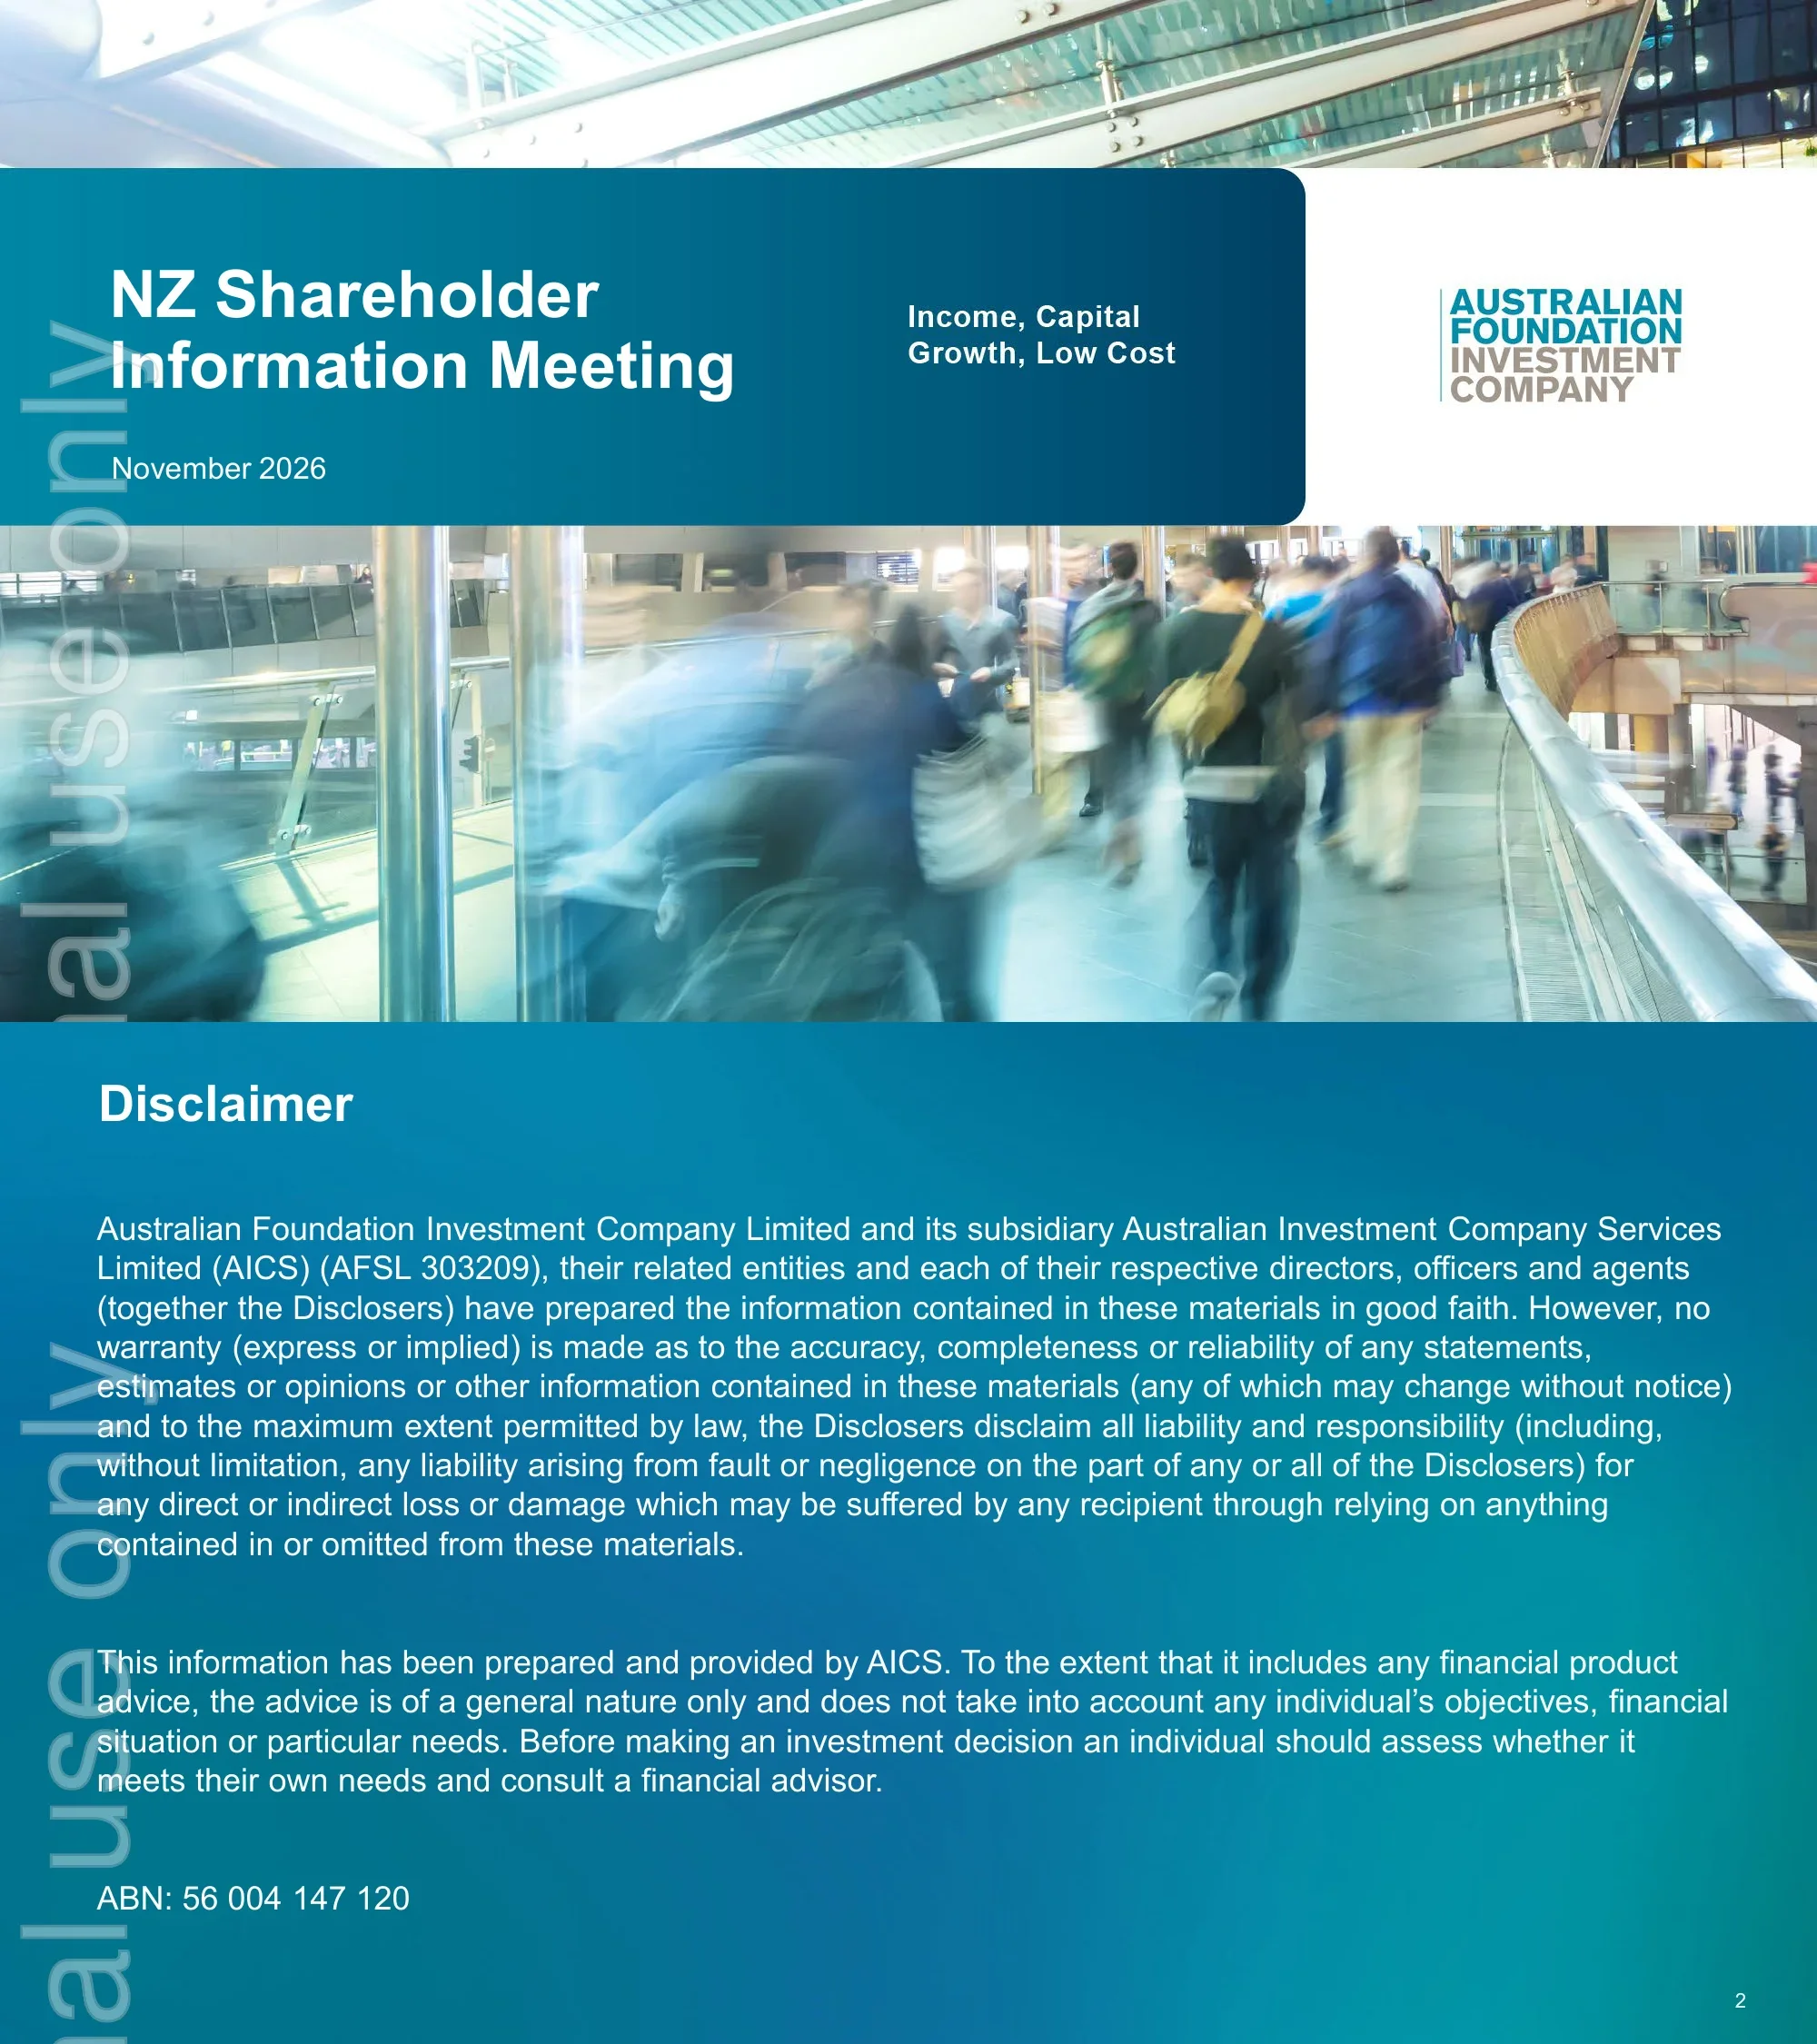
Cover slide for Australian Foundation Investment Company's NZ Shareholder Information Meeting, dated November 2026. The tagline reads 'Income, Capital Growth, Low Cost'.
Full-bleed photo with a teal title band across the middle and the company logo on a white panel at right
Legal disclaimer from Australian Foundation Investment Company Limited and its subsidiary Australian Investment Company Services Limited (AICS, AFSL 303209): information is prepared in good faith with no warranty, and any advice is general in nature only. Investors should assess their own needs and consult a financial adviser. ABN 56 004 147 120.
Text-only slide on a teal gradient background
Three agenda items: CEO Address and Dividend Update presented by Alison Gibson; Portfolio Update presented by Brett McNeill; and Performance & Market Update presented by Brett McNeill.
Two-column table of topics and presenters separated by horizontal rules
Section divider introducing the CEO Address.
Full-bleed architectural photo with a white rounded text panel at left
The CEO gives four reasons for rejoining AFIC: Purpose, People, Strong foundations, and the Ability to make a difference.
Four equal outlined cards in a row, each with a circular icon and label
Bar chart of AFIC 5-year annualised NTA returns (including Australian franking) against the S&P/ASX 200 Accumulation Index at Jun-06, Jun-11, Jun-16, Jun-21 and Jun-26. AFIC was ahead or roughly level in earlier periods, while the circled Jun-26 period shows AFIC behind the index; bar values are not labeled on the slide, so exact figures are not legible. AFIC returns are after expenses and tax, while index returns are not.
Teal subheading banner above a clustered column chart with a legend and footnote
Line chart of AFIC NTA per share versus share price (A$) from 2001 to 2026, with the share price falling below NTA in recent years. At 31 October 2026 NTA per share was A$7.92 (Australian dollars), the share price A$6.85, a discount to NTA of -13.5%. Why it matters: a quality portfolio at ~87 cents in the dollar, NTA excludes franking credits, and AFIC's biggest FY26 purchase was AFI shares.
Line chart on the left, stat table and 'Why it matters' callout box on the right
Four investment merits: permanent capital allowing a long-term view and the ability to step into volatility; low-cost active management with an MER of 0.14% for FY26; consistent fully franked dividends with excess franking reserves paid out as special dividends; and a discount to NTA giving exposure at ~87 cents in the dollar (based on A$6.85 share price and A$7.92 NTA at 31 October 2026).
2x2 grid of outlined cards, each with a circular icon, heading and description
Section divider introducing the Dividend Update.
Full-bleed photo with a white rounded text panel at left
Stacked column chart of ordinary and special dividends (cents per share) from FY01 to FY26, with a line for fully franked dividend reserves per share. Ordinary dividends trend upward over the period, with specials in FY01–FY04, FY19, FY25 and FY26; individual bar values are not labeled on the slide. The slide describes the franking credit reserve as ~2x the ordinary dividend.
Wide combination bar-and-line chart with a callout at top right and a legend below
Proposed FY27 dividend: ordinary 27 cents per share plus special 10 cents per share, a total of 37 cents fully franked, subject to no material adverse market conditions and final Board approval. AFIC is moving to quarterly payments: 6.75c ordinary + 2.50c special = 9.25c in each of November 2026, February 2027, May 2027 and August 2027.
Two columns: stacked guidance boxes at left, dividend schedule table at right
Yield comparison: S&P/ASX 200 Index 3.6% excluding franking and 4.7% including Australian franking; AFIC ordinary dividend 3.9% and 5.6%; AFIC ordinary + special 5.4% and 7.7%. AFIC yields use the ASX share price at 31 October 2026; the index yield uses consensus estimates and assumes a 70% franking rate.
Three pairs of columns with value labels and a methodology footnote
Section divider introducing the Portfolio Update.
Full-bleed photo with a white rounded text panel at left
Three pillars: focus on quality companies; build a well diversified portfolio with the right mix of income and growth; and benefit from compounding returns over the long term.
Three light-teal panels with top accent bars, each with an icon and statement
Transurban dividend per share (A$) rose from $0.41 in FY22 to $0.58, $0.62, $0.65 and $0.69 in FY26, with $0.72 estimated for FY27. Telstra DPS went from $0.17 (FY22, FY23) to $0.18, $0.19, $0.21 in FY26, and $0.22 estimated for FY27. FY27e figures are consensus estimates (source: FactSet, company reports).
Two side-by-side column charts with company logos, divided by a vertical rule
Pro Medicus net profit after tax (A$m) grew from $44 in FY22 to $61, $83, $115 and $145 in FY26, with $188 estimated for FY27. TechnologyOne NPAT rose from $73 to $89, $103, $118 and $138, with $163 estimated for FY27. FY27e values are consensus estimates.
Two side-by-side column charts with company logos, divided by a vertical rule
Newmont operating cash flow (US$b) went $4.3, $3.2, $2.8, $6.4, $10.3 from FY22 to FY26, with $12.5 estimated for FY27. Evolution Mining operating cash flow (A$b) went $0.8, $0.7, $1.3, $2.0, $2.6, with $2.6 estimated for FY27. FY27e figures are consensus estimates.
Two side-by-side column charts with company logos, divided by a vertical rule
Major transactions for FY27 to date. Trimmed holdings: James Hardie, Brambles, Amcor, Woolworths Group, Santos and Reece. Complete disposals: PEXA, NEXTDC, Ampol and Temple & Webster.
Two outlined boxes side by side, each containing a grid of company logos
Section divider introducing the Performance & Market Update.
Full-bleed photo with a white rounded text panel at left
AFIC portfolio performance to 31 October 2026, including Australian franking: over 1 year the NTA total return was 4.7% versus 4.8% for the S&P/ASX 200 Accumulation Index. Financial year to date AFIC returned 4.6% versus 3.2% for the index. AFIC returns are after expenses and tax; index returns are not.
Clustered column chart with two groups, legend and footnote
August reporting season dividend growth from some of AFIC's largest holdings (ordinary dividends for the six months to June 2026 vs prior corresponding period): BHP +50%, RIO +33%, WOW +16%, TLS +11%, WES +8%, TCL +6%, CBA +4%, GMG 0%, WDS -3%, CSL -8%.
Single column chart with positive green bars and negative orange bars, labeled by ticker
Key portfolio statistics at 31 October 2026: total portfolio value A$9.8b (investment plus trading portfolio, including cash), 59 stocks in the Australia and New Zealand portfolio, and NTA backing of A$7.92 per share. The top 25 holdings shown by logo include BHP, Commonwealth Bank, CSL, Macquarie, NAB, Westpac, Transurban, Telstra, Wesfarmers, ANZ, Goodman, Woolworths, Woodside, Rio Tinto, ResMed, Coles, CAR Group, Computershare, Fisher & Paykel Healthcare, Mainfreight, Evolution Mining, JB Hi-Fi, ASX, REA Group and ALS.
Intro statement on top, stat boxes at left, 5x5 logo grid at right
International portfolio at 31 October 2026 (excluding cash): total value A$154.5m, 1.6% of AFIC's portfolio value, 16 stocks. Holdings are Visa, Microsoft, Eli Lilly, Waters, Spotify, Amazon, NVIDIA, HCA Healthcare, Schneider Electric, Ferguson, CME Group, Netflix, Airbnb, Fraport, Google and Heidelberg Materials.
Stat boxes at left, 4x4 logo grid at right
Closing slide showing only the Australian Foundation Investment Company logo.
Centered logo on a full-bleed textured teal background
Common questions about this slide and the underlying presentation content.
It is a 24-slide investor deck that Australian Foundation Investment Company Ltd (ASX: AFI, also NZX-listed) presented to its New Zealand shareholders and lodged with the ASX on November 15, 2026. It covers a CEO address, FY27 dividend guidance, portfolio changes, performance to 31 October 2026 and portfolio holdings.
A total of 37 cents per share fully franked: a 27c ordinary dividend plus a 10c special dividend, subject to no material adverse market conditions and final Board approval. It will be paid quarterly as 9.25c (6.75c ordinary + 2.50c special) in November 2026, February 2027, May 2027 and August 2027.
AFIC's fiscal year runs July to June, so FY26 is July 2025 to June 2026 and FY27 is July 2026 to June 2027. References such as 'FYTD' performance and 'FY27 to date' transactions in the deck refer to periods since 1 July 2026.
At 31 October 2026 the NTA per share was A$7.92 and the share price A$6.85 (Australian dollars), a discount of -13.5%. The deck frames this as buying a quality portfolio for about 87 cents in the dollar, and notes AFIC's biggest FY26 purchase was AFI shares.
To 31 October 2026, AFIC's NTA total return including franking was 4.7% over one year versus 4.8% for the S&P/ASX 200 Accumulation Index, and 4.6% financial year to date versus 3.2%. The CEO also flags that 5-year annualised NTA returns to June 2026 lagged the index.
Recent buying highlighted Transurban, Telstra, Pro Medicus, TechnologyOne, Newmont and Evolution Mining. In FY27 to date it trimmed James Hardie, Brambles, Amcor, Woolworths, Santos and Reece, and fully exited PEXA, NEXTDC, Ampol and Temple & Webster.
Total portfolio value was A$9.8b at 31 October 2026 across 59 Australian and New Zealand stocks, plus an international portfolio of A$154.5m (1.6% of the total) in 16 stocks. The management expense ratio (MER) was 0.14% for FY26.
Based on the proposed FY27 dividend and the 31 October 2026 share price, AFIC's ordinary plus special yield is 5.4% (7.7% including Australian franking), and the ordinary-only yield is 3.9% (5.6%). This compares with 3.6% (4.7%) for the S&P/ASX 200 Index.

Create Your Own Slides
Turn your ideas into professional presentations in seconds with 2slides AI.
Reference professional designs, choose your style, and generate slides with perfect text rendering. Powered by Nano Banana—start creating your presentation now.
Your AI Agent for slides. Save time, shine faster with intelligent presentation creation.


© 2026 2slides. All rights reserved.