
Part of Investor presentation examples
ASUS Q3 2026 Earnings Presentation — ASUSTeK Computer Inc.'s (TWSE: 2357) "3Q 2026 Investor Conference" deck held November 12, 2026, covering unaudited brand consolidated 3Q26 results, the 4Q26 outlook, the ASUS AI ecosystem strategy and business group updates across System, Open Platform, Infrastructure Solutions and Physical AI Solutions.
Uses this deck’s cover as a style reference for slides made from your own content. Or pick any page below to use its layout as the reference.
Quick Navigation
Tags
Share the slides
ASUS Q3 2026 Earnings Presentation — ASUSTeK Computer Inc.'s (TWSE: 2357) "3Q 2026 Investor Conference" deck held November 12, 2026, covering unaudited brand consolidated 3Q26 results, the 4Q26 outlook, the ASUS AI ecosystem strategy and business group updates across System, Open Platform, Infrastructure Solutions and Physical AI Solutions.
Detailed view of each slide page, including layout, key content and visual elements.
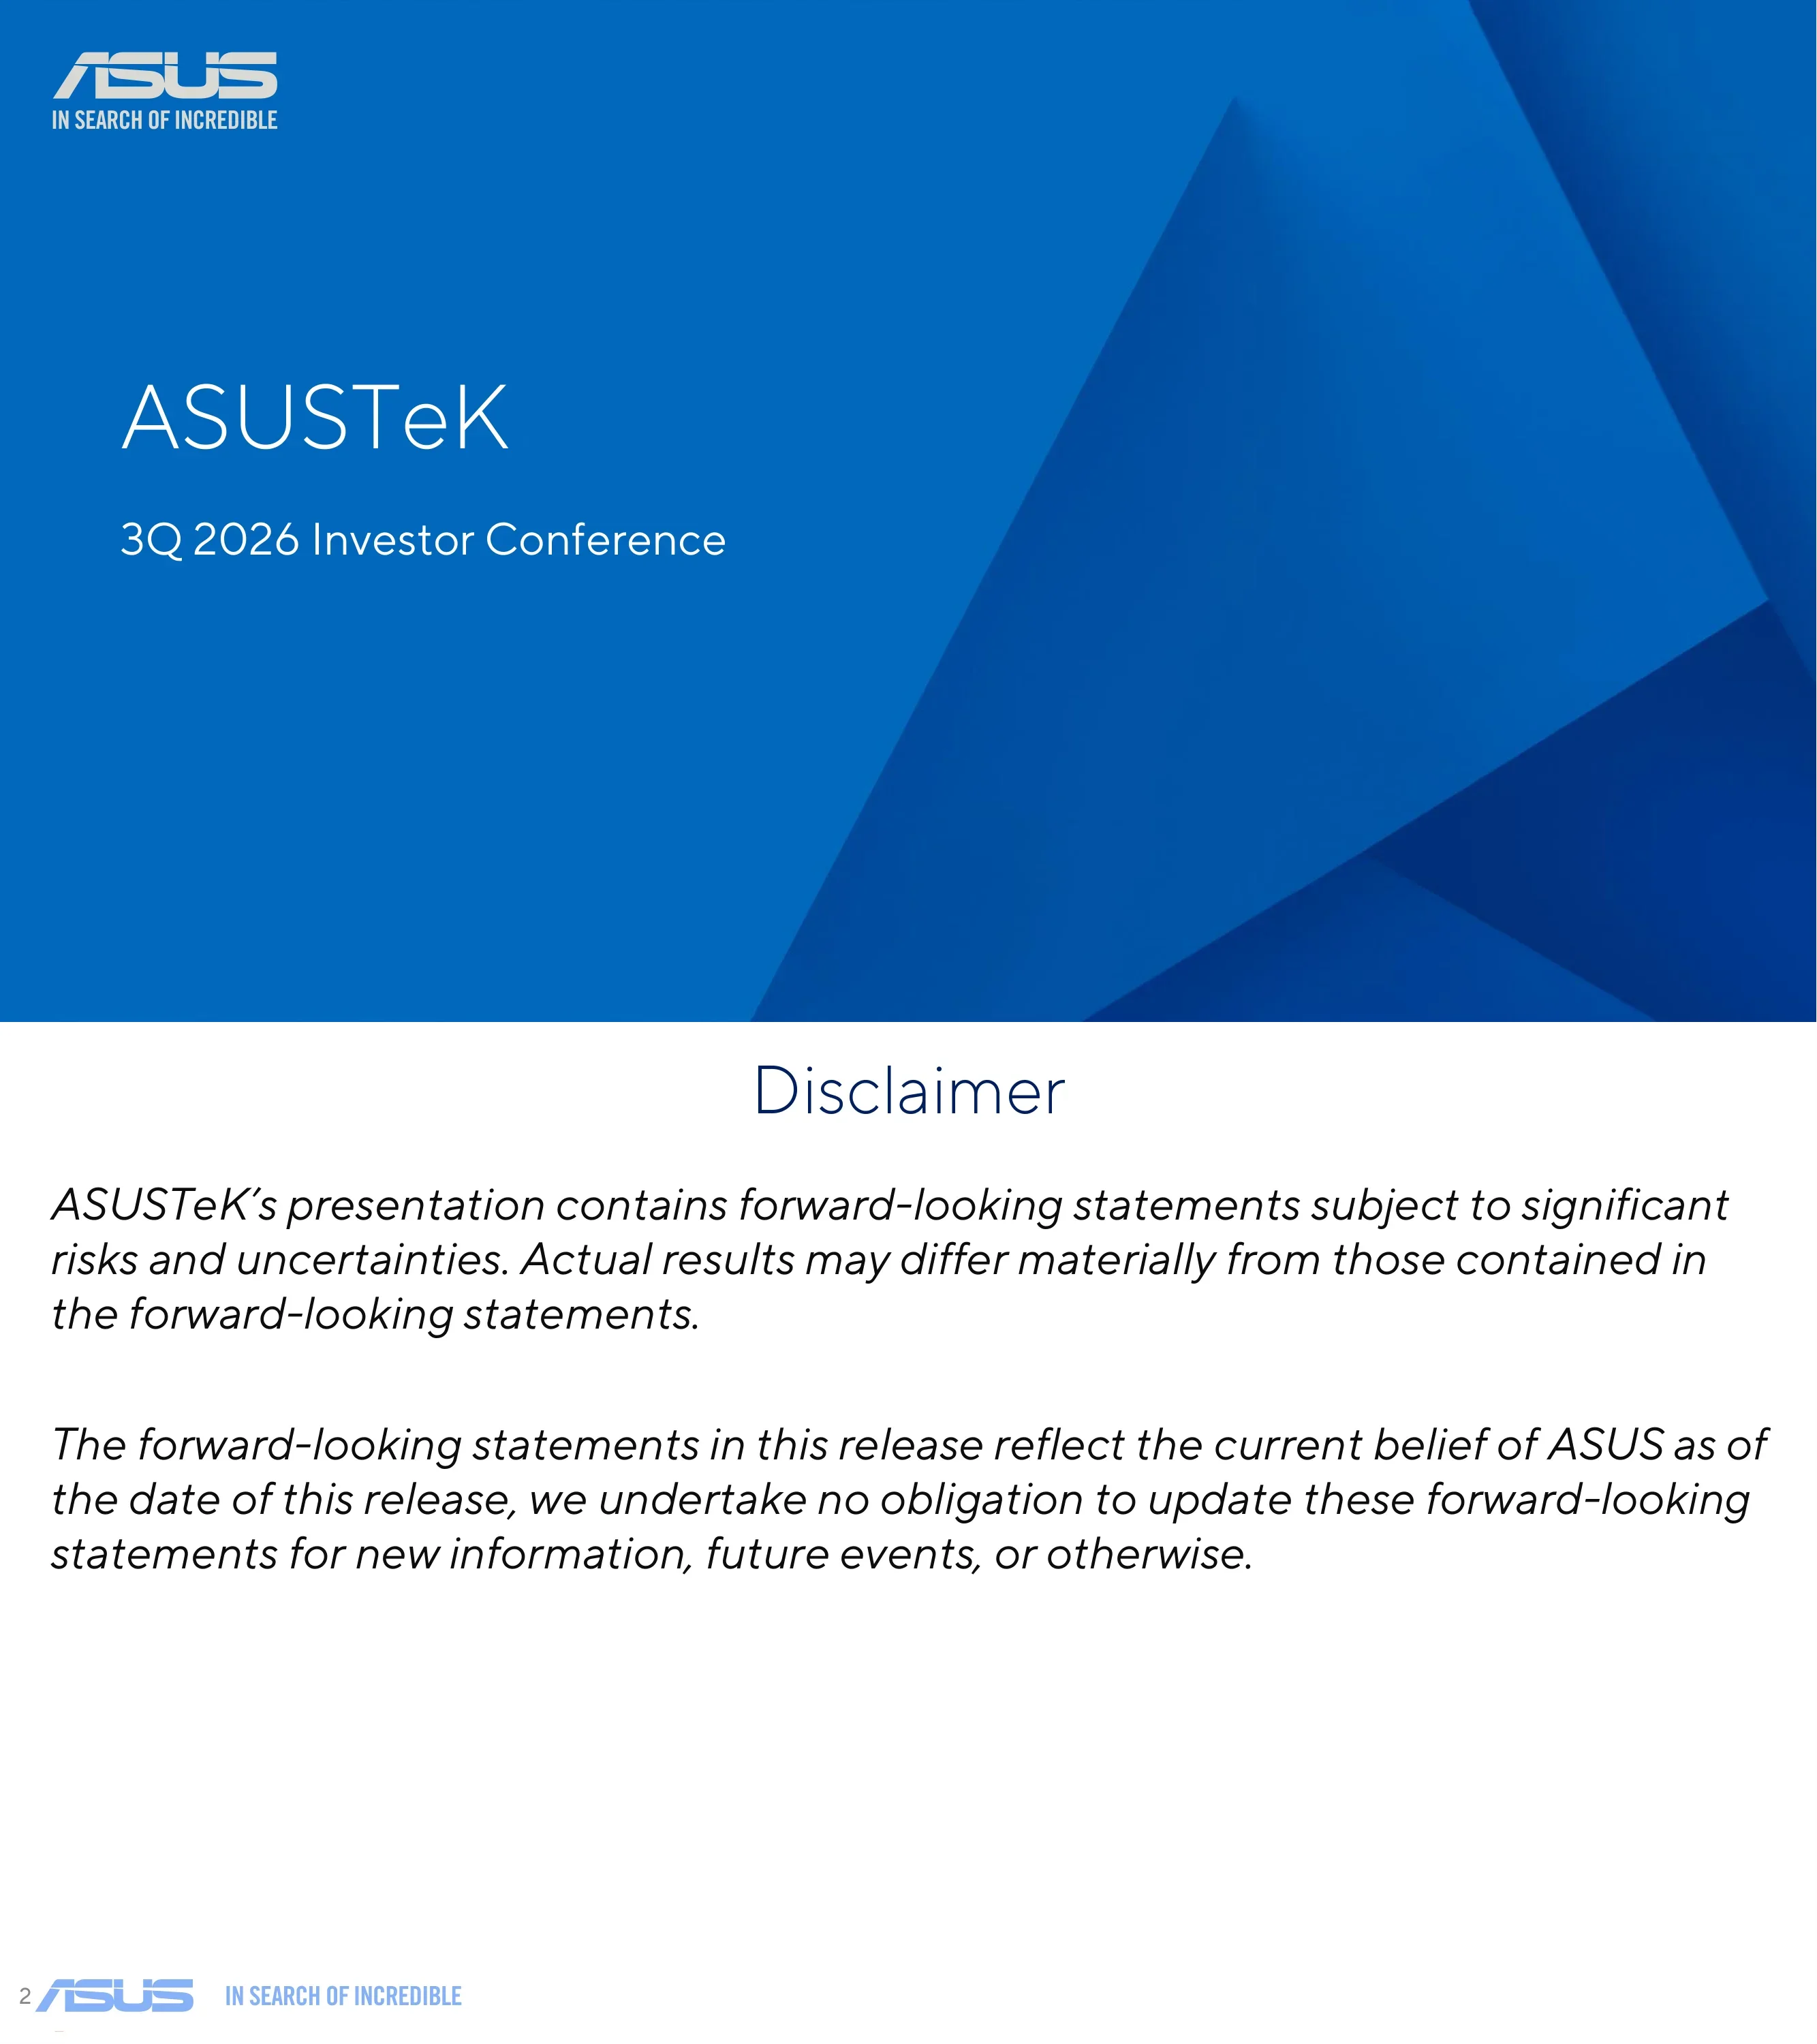
Title slide reading "ASUSTeK" and "3Q 2026 Investor Conference" with the ASUS logo and the tagline "In Search of Incredible".
Full-bleed blue background with angular shaded facets, logo top left, company name and subtitle left-aligned in the lower middle.
Forward-looking statement notice: the presentation contains statements subject to significant risks and uncertainties, actual results may differ materially, and ASUS undertakes no obligation to update them for new information, future events or otherwise.
White slide with a centered title and two italic paragraphs of body text, footer logo bottom left.
Three agenda items: 3Q 2026 Financial Result, Strategy & Outlook, and Q & A.
Blue background with large left-aligned title and a three-item bullet list.
Section divider introducing the financial results part of the deck, titled "3Q 2026 Financial Result".
Blue full-bleed background with a single large left-aligned title and a darker triangular facet at right.
Net revenue of NT$258,788 million (+7% QoQ, +36% YoY versus NT$189,907 million in 2025 3Q). Gross profit NT$41,205 million, operating profit NT$21,964 million (+161% YoY), pre-tax profit NT$25,558 million and net profit NT$21,631 million (+14% QoQ, +105% YoY). EPS was 29.1 versus 25.6 in 2026 2Q and 14.2 in 2025 3Q; gross margin 15.9% and operating margin 8.5%. Footnote: unaudited brand consolidated financials.
Full-width table with line items in rows and columns for 2026 3Q, 2026 2Q, QoQ, 2025 3Q and YoY, with margin rows highlighted in blue.
Total non-operating items were NT$3,594 million versus NT$5,036 million in 2026 2Q (-29%) and NT$3,744 million in 2025 3Q (-4%). Components include net interest income of (782), investment income of 1,732 (Askey 76, others 1,656), exchange gain of 2,007, dividend income of 1,049, fair value change of CB of (300) and other income (net) of (112), all in NT$ millions.
Table of non-operating line items with QoQ and YoY columns and italic sub-rows for the investment income breakdown.
At Sep 30, 2026 total assets were NT$1,000,900 million (+25% QoQ, +86% YoY), including cash of 113,882 and inventories of 463,886. Total liabilities were 649,430, bank loan and bonds 220,513 and stockholders' equity 351,470. Average days of inventory were 196, AR 67, AP 105 and the cash conversion cycle 159 days versus 132 in the prior quarter.
Dense balance sheet table with columns for Sep 30, 2026, Jun 30, 2026, QoQ, Sep 30, 2025 and YoY, followed by a working capital days block.
By business group, System is 50%, IS 30% and Open Platform 20%. By region, Asia is 42%, EURP 35% and America 23%.
Two side-by-side pie charts labeled Business Group and Region, with percentage labels inside each slice.
Guidance by segment: PC QoQ -15% and YoY +15%; Component QoQ -10% and YoY -15%; Server QoQ +100% and YoY +280%.
White slide with a centered title and three bullet lines of outlook figures.
Section divider introducing the strategy and outlook part of the deck.
Blue full-bleed background with a single large left-aligned title.
Three headline KPIs: 3Q revenue +36% YoY, Server 3Q revenue +100% YoY and PC 3Q revenue +25% YoY. Supporting bullets cite hyper-growth in Server with a robust order pipeline, PC consistently outperforming the broader industry, and proven execution and operational resilience.
Title on top, three large gradient-colored KPI numbers in a row with underlines and captions, then three bullet lines below.
Four columns map the ASUS AI ecosystem: Cloud & Edge AI Infrastructure (Server, +100% 3Q revenue YoY), Local AI Accelerators (NUC +20%, Workstation +50%), Client AI PC / Devices (AI PC +100%, RTX Spark No.1 market share) and Physical AI Applications (2026/9 repositioned). They align with the Infrastructure Solutions, Open Platform, System and Physical AI Solutions business groups.
Four rounded gradient cards with icons and sub-tags, each linked to a business group label on a continuous arrow band at the bottom.
Positions ASUS as an end-to-end infrastructure solutions provider with three pillars: first-to-market on new platforms (next-generation platform readiness, platform diversification), expand key accounts (dedicated team, deep engagement, new accounts) and solution-based deployment (storage and infrastructure solutions, customized design and technical support as a service).
Three equal columns separated by dotted dividers, each with a circular icon, a blue heading and bullet points.
Showcases products built with NVIDIA RTX Spark and DGX Station: ASUS ProArt P16/P14 laptop ("Your AI workstation travels with you"), ASUS ProArt GR1X mini PC ("Agents that keep running after you log off") and ExpertCenter Pro ET900N G3 workstation ("Data-center AI at the desk"). Review award badges are shown beside the laptop.
Left column with two product images and descriptions, a dotted divider, and a tall workstation image with caption on the right.
Features the ASUS ExpertBook A7, an ultraslim all-metal Copilot+ PC for the modern workday, and the Zenbook DUO, labeled TIME Best Inventions of 2026 (Consumer Electronics).
Two product photos side by side with bold product names and one-line descriptions beneath; award ribbon on the right image.
ROG slide in gold on black, with Innovation cards (ROG Portfolio revealed at Gamescom; ROG XBOX Ally X20, the 20th anniversary handheld) and Community cards (Gamescom 2026 with Alan Walker; Spider-Man, where blockbuster fandom meets ROG power). Footer reads "For those who dare".
Dark gaming-themed slide with four chamfered cards in two groups labeled Innovation and Community, each with a caption and image.
2026 Q3 performance: PC revenue up more than 25% YoY, high-value product revenue share above 65%, and Commercial PC shipments up more than 30% YoY. Highlights state PC revenue outperformed the industry and expanded market share, a majority of revenue came from high-value products, and Commercial PC shipments expanded. Source noted as market research and internal data.
Top panel with two bar charts and a pie chart under a navy side label, bottom panel with three business highlight bullets.
OP revenue up 5% to 10% YoY. ROG gaming ecosystem revenue: Display about 20% and Gaming and Workspace Gear (GWG) above 60%. Edge AI systems: NUC about 20% and Workstation (WS) above 50%. Highlights cover the ROG gaming ecosystem, Edge AI momentum with Ascent GX10-driven NUC growth, and MB and VGA business recovery from industry headwinds.
Top panel with three bar chart groups with percentage labels, bottom panel with three highlight bullets.
Server revenue up more than 100% YoY, with a dashed Deferred portion shown on the 26Q3 bar, and general server revenue up more than 80% YoY. Highlights: server sales doubled while Q3 revenue was deferred and the full-year outlook remains unchanged; AI server momentum drove general server growth; at OCP 2026 ASUS launched the XA P2N-E2, a 2U NVIDIA MGX-based server powered by NVIDIA Vera CPUs, designed to accelerate agentic AI.
Top panel with two bar charts and a booth photo with caption, bottom panel with three highlight bullets.
Highlights ASUS participation at Taipei Automation 2026 (August 19-22) under the theme "Ubiquitous AI: Driving the Physical AI Era", strengthening the Physical AI ecosystem through cross-industry collaborations and showcasing real-world smart manufacturing applications.
Top panel with two exhibition photos under a centered caption, bottom panel with a single highlight bullet.
Three recognitions: ASUS made TIME's World's Best Companies list for the third time, ranked 48th globally (2026); ASUS was recognized among Newsweek's World's Most Trustworthy Companies for the third consecutive year (2026); and ASUS was named one of the Forbes World's Best Employers for the tenth consecutive year.
Three award graphics in a row, each with a centered caption below.
Closing question-and-answer slide with the ASUS logo and tagline.
Blue full-bleed background with a large left-aligned "Q & A" title.
Common questions about this slide and the underlying presentation content.
It covers the third quarter of 2026 (3Q26), with balance sheet data as of September 30, 2026. The deck is titled "3Q 2026 Investor Conference" and was held on November 12, 2026, covering 3Q26 operating results, brand business updates and strategy. Financials are unaudited brand consolidated figures.
Net revenue was NT$ (New Taiwan dollars) 258,788 million, up 7% QoQ and 36% YoY. Operating profit was NT$21,964 million (8.5% operating margin), net profit was NT$21,631 million and EPS was 29.1. Gross margin was 15.9%.
Slide 9 gives PC QoQ -15% and YoY +15%, Component QoQ -10% and YoY -15%, and Server QoQ +100% and YoY +280%.
The English version of this deck was filed on Taiwan's Market Observation Post System (MOPS) for ASUSTeK Computer Inc.'s investor conference (法說會). A Chinese version also exists. ASUS is listed on the Taiwan Stock Exchange under ticker 2357.
It has 22 slides: cover, disclaimer, agenda, a 3Q 2026 Financial Result section (income statement, non-operating items, balance sheet, revenue mix, 4Q outlook), a Strategy & Outlook section (growth KPIs, AI ecosystem, Infrastructure Solutions strategy, PC and ROG product pages, four business group reviews, awards) and a Q&A slide.
Slide 8 shows the 2026 3Q revenue mix by business group as System 50%, Infrastructure Solutions (IS) 30% and Open Platform 20%, and by region as Asia 42%, Europe 35% and America 23%.
It reviews the System Business Group (PC), Open Platform Business Group (ROG gaming ecosystem and Edge AI systems), Infrastructure Solutions Business Group (servers) and Physical AI Solutions Business Group, each with Q3 performance and business highlights.
Yes. The deck can be viewed page by page on 2slides, and its structure of disclaimer, agenda, financial tables, KPI call-outs, strategy pages and Q&A is a useful reference for building your own earnings or investor conference presentation. The content remains ASUS's own; reuse the layout, not the company data.

Create Your Own Slides
Turn your ideas into professional presentations in seconds with 2slides AI.
Reference professional designs, choose your style, and generate slides with perfect text rendering. Powered by Nano Banana—start creating your presentation now.
Your AI Agent for slides. Save time, shine faster with intelligent presentation creation.


© 2026 2slides. All rights reserved.