
Part of Investor presentation examples · Japanese investor presentation examples
Astellas Pharma H1 FY2026 earnings presentation (Q2 FY2026, six months to September 30, 2026), presented by President and CEO Naoki Okamura on November 4, 2026. This is a Japanese-language deck (2026年度第2四半期(中間期)決算概況) released on TDnet, the Tokyo Stock Exchange's timely disclosure system. It covers first-half results (revenue ¥1,270.9 billion, up 23.4%; core operating profit ¥424.9 billion, up 50.3%), an upward revision of the FY2026 forecast to revenue of ¥2,330 billion and core operating profit of ¥700 billion (30.0% core margin), and pipeline progress across PADCEV, IZERVAY, VYLOY, VEOZAH, XOSPATA, setidegrasib, ASP2138, ASP546C, ASP6958/VIR-5500 and cell and gene therapy programs. Figures are in ¥100 million (億円); Astellas' fiscal year FY2026 runs from April 2026 to March 2027.
Uses this deck’s cover as a style reference for slides made from your own content. Or pick any page below to use its layout as the reference.
Quick Navigation
Tags
Share the slides
Astellas Pharma H1 FY2026 earnings presentation (Q2 FY2026, six months to September 30, 2026), presented by President and CEO Naoki Okamura on November 4, 2026. This is a Japanese-language deck (2026年度第2四半期(中間期)決算概況) released on TDnet, the Tokyo Stock Exchange's timely disclosure system. It covers first-half results (revenue ¥1,270.9 billion, up 23.4%; core operating profit ¥424.9 billion, up 50.3%), an upward revision of the FY2026 forecast to revenue of ¥2,330 billion and core operating profit of ¥700 billion (30.0% core margin), and pipeline progress across PADCEV, IZERVAY, VYLOY, VEOZAH, XOSPATA, setidegrasib, ASP2138, ASP546C, ASP6958/VIR-5500 and cell and gene therapy programs. Figures are in ¥100 million (億円); Astellas' fiscal year FY2026 runs from April 2026 to March 2027.
Detailed view of each slide page, including layout, key content and visual elements.
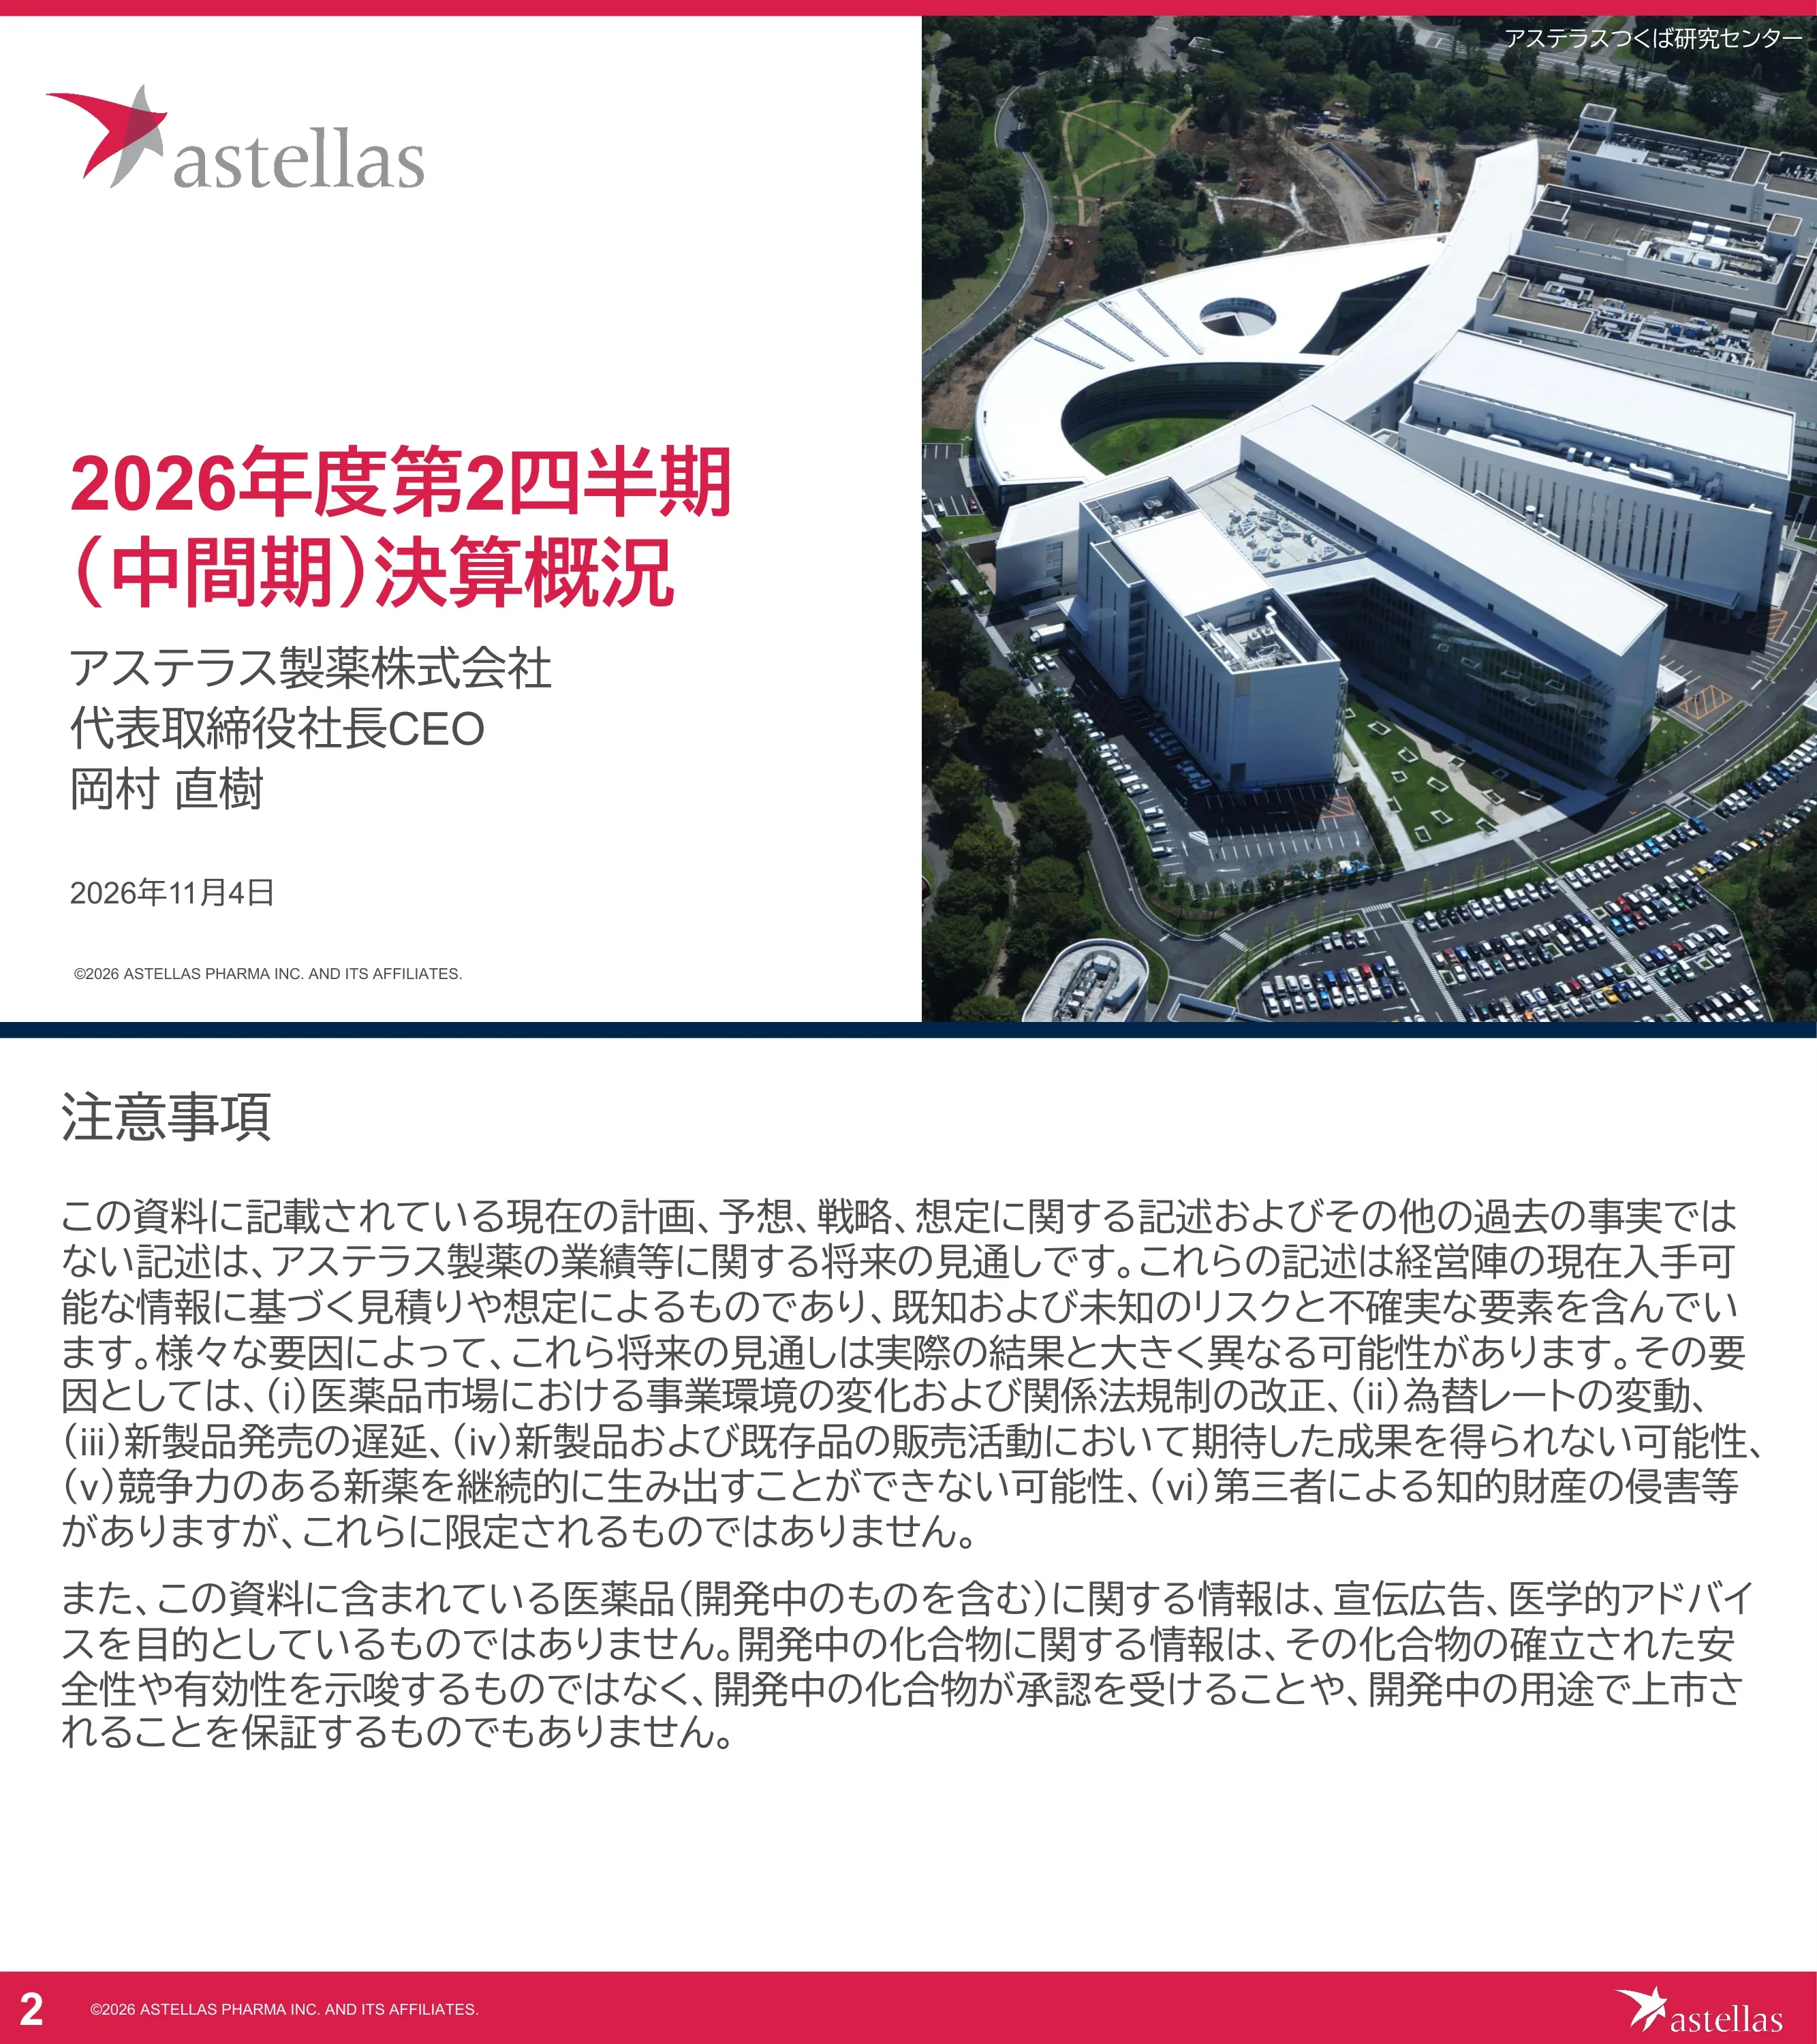
Title slide for Astellas Pharma's FY2026 second-quarter (interim) results, presented by President and CEO Naoki Okamura on November 4, 2026, with an aerial photo of the Astellas Tsukuba Research Center.
Split layout: left white panel with logo, red title, presenter and date; right half full-bleed aerial photograph
Forward-looking statement disclaimer listing risks such as changes in the pharmaceutical market and regulation, FX fluctuations, launch delays, sales underperformance, failure to create competitive new drugs and IP infringement; notes that pipeline information is not advertising or medical advice.
Single text column with heading, two dense paragraphs, red footer band with page number and logo
Progress ahead of plan with full-year forecast raised: revenue +23% and core operating profit +50% year on year, driven by strategic brands, cost optimization and favorable FX; forecast raised by ¥110 billion (+1,100億円) in revenue and ¥80 billion (+800億円) in core operating profit to ¥700 billion core OP and a 30% core margin; pipeline wins include EU approval of PADCEV in cisplatin-eligible MIBC, VEOZAH filings in Japan and China, two Phase 3 first-subject-dosed (setidegrasib NSCLC, ASP2138 G/GEJ), PoC for ASP6958/VIR-5500 in mCRPC, and three new clinical programs (ASP388B, ASP2020, ASP2767).
Heading with two red tagline subtitles, then three labeled sections (results, forecast revision, pipeline) of checkmark bullets, footnotes at bottom
Two-part agenda: I. FY2026 Q2 consolidated results and FY2026 full-year forecast revision (highlighted); II. Pipeline progress.
Two stacked rows each with a square Roman-numeral tile and section label; active section in red
P&L table in ¥100 million (億円): revenue 10,301 to 12,709 (+2,407, +23.4%, FX +993); cost of sales 2,479; SG&A 4,304 including US XTANDI co-promotion 1,318, other SG&A 2,985 (ratio 23.5%, -3.4ppt); R&D 1,677 (13.2%); core operating profit 2,826 to 4,249 (+50.3%, margin 33.4%, FX +412); amortization 713; operating profit 1,994 to 3,166 (+58.8%); profit before tax 3,175; interim net profit 1,476 to 2,415 (+63.6%); initial FY2026 forecast column (revenue 22,200, core OP 6,200). H1 FX: US$1 = ¥159, €1 = ¥184 (prior year ¥146 / ¥168).
Full-width financial table with columns for prior year, current year (red header), change, % change, FX impact and initial forecast; core basis on top, full basis below
Strategic brands grew more than 50% year on year: total ¥333.9 billion (3,339億円, +1,134, +51%); PADCEV 1,583 (+55%), IZERVAY 562 (+65%), VYLOY 459 (+73%), VEOZAH 307 (+34%), XOSPATA 429 (+25%); full-year strategic-brand forecast raised to ¥680 billion mainly on PADCEV (1L mUC globally and US MIBC); XTANDI 5,337 (+12%), flat ex-FX, with H2 decline expected from the US IRA.
Left table of product logos with H1 sales and year-on-year change; right pink commentary panel per brand; XTANDI row separated at bottom
SG&A excluding US XTANDI co-promotion rose 7.9% (down 0.3% ex-FX), ratio 23.5%, 3.4ppt better, with about ¥10 billion of SMT savings from the global capability center, AI/digital and shared promotional materials; R&D rose 17.0% (9.9% ex-FX), ratio 13.2%, with about ¥11 billion more pipeline spend (setidegrasib, ASP2138, ASP546C, ASP6958/VIR-5500) offset by about ¥8 billion SMT savings; total SMT optimization about ¥22 billion year on year.
Two headline bullets above a four-column grid table: cost item, year-on-year change, ratio to revenue, explanatory bullets
Forecast in ¥100 million (億円): revenue 23,300 vs initial 22,200 (+1,100; PADCEV, mirabegron, FX) and FY2025 actual 21,392; SG&A 8,150 including XTANDI co-promotion 2,300; other SG&A 5,850 (25.1%); R&D 3,600 (15.5%); core operating profit 7,000 vs 6,200 (+800, margin 30.0%); full-basis operating profit 4,600 (+650). Revised FX assumption US$1 = ¥158, €1 = ¥181 (H2: ¥156 / ¥177).
Two headline bullets, then table with FY2025 actual, initial forecast, revised forecast (red header), difference and a 'main revision items' commentary column
Agenda divider repeated with section II, Pipeline progress, now highlighted.
Same two-tile agenda layout with the second section active in red text
Quarterly FY2026 regulatory and clinical timeline: PADCEV in MIBC (EV-303 cisplatin-ineligible EU approval June, China filing July, Japan decision pending; EV-304 cisplatin-eligible Japan filing May, US approval July, EU approval October; EV-309 bladder-preservation Phase 3 start June); IZERVAY China filing May; VYLOY Phase 3 LUCERNA enrollment complete in July with data in FY2027; VEOZAH STARLIGHT 3 met primary endpoint in April, Japan filing August, China filing October; HIGHLIGHT 1 (VMS in breast cancer) data in FY2027.
Gantt-style matrix: product logo and indication rows against 1Q-4Q FY2026 and FY2027 columns, with pink (regulatory) and yellow (clinical) milestone boxes; blue text marks new progress
Stage map (Pre-PoC, PoC achieved, Phase 3/pivotal, launched) by therapeutic area: two Phase 3 FSDs (setidegrasib NSCLC in September, NCT07566052; ASP2138 G/GEJ in August, NCT07673887), PoC for ASP6958/VIR-5500 in mCRPC, new clinical entries ASP388B (iADC, Phase 1b/2), ASP2020 (cell therapy, Phase 1b) and ASP2767 (gene therapy, US IND cleared), and discontinuation of ASP5541; also lists ASP2998, ASP1002, ASP5834, ASP546C, ASP7317, AT845, ASP2957, ASP2246.
Left: chevron stage header over a grid of program boxes grouped by area (cancer, ophthalmology, neuromuscular) with modality tags; right: red 'key progress' bullet panel
Key milestones: ASP2138 (subcutaneous CLDN18.2 x CD3 T-cell engager) Phase 3 FSD in 1L G/GEJ in August with PDAC PoC call in FY2026; ASP6958/VIR-5500 (dual-masked PSMA x CD3 TCE) achieved PoC in mCRPC and FDA Fast Track, registrational plans under review. New programs: ASP388B, a B7-H3 dual-payload immune-stimulating ADC (topoisomerase I inhibitor plus STING agonist) with Phase 1b/2 FSD in September; option on Audax's IL-12 antibody-cytokine fusion DAX-044, Phase 1 to start in 2027.
Two columns: left 'key milestones' cards, right 'new programs' cards, each with grey header bar and red accent, plus molecule schematics
Next-generation ophthalmology programs enter the clinic: ASP2020, iPS-derived retinal pigment epithelium cells using HLA-edited universal cell technology for Stargardt macular dystrophy (Phase 1b FSD in August, NCT07734064; FDA Fast Track and rare pediatric disease designation); ASP2767, an AAV gene therapy delivering BDNF and TrkB for glaucomatous optic neuropathy (US Phase 1/2 IND cleared, NCT07770685; FDA Fast Track).
Two side-by-side program panels with grey title bars, bullet lists and anatomical retina illustrations below
Strong momentum leads to a raised full-year forecast and an expected 30% core operating margin; pipeline advancing at every stage in line with Corporate Strategic Plan 2026. Business momentum: strategic brands up more than 50%, SG&A held flat (ex-XTANDI co-promotion and FX), forecast raised. Pipeline: LCM regulatory milestones for PADCEV and VEOZAH, two Phase 3 FSDs, ASP6958/VIR-5500 PoC, three new clinical programs.
Red headline statement, then two columns with circular icons and colored header bars (dark red: performance; pink: pipeline), bullet lists beneath
Section divider introducing the reference materials appendix.
Left crimson panel with white title; right photo of Astellas logo signage on a building facade
Peak sales expectations: PADCEV ¥400-500 billion (4,000-5,000億円, based on total product sales including Pfizer-booked Americas sales), VYLOY ¥100-200 billion, XOSPATA ¥100-200 billion, IZERVAY ¥200-400 billion, VEOZAH ¥150-250 billion.
Five equal columns with product logo, color-coded therapeutic area band (green oncology, blue ophthalmology, purple women's health) and a card showing peak sales range
Three priorities: business investment for growth first, raising dividends based on profit and cash plans, and opportunistic share buybacks with surplus cash; Gross Debt/EBITDA kept at 1.0-1.5x to retain capacity for large investments. Dividend history bar chart from ¥14 (FY05) to ¥78 (FY25) and a forecast ¥80 for FY26, with at least ¥2 annual increases through the Corporate Strategic Plan 2026 period (FY27-FY30 bars illustrative).
Three numbered pink policy boxes across the top, centered policy sentence, then a large dividend-per-share bar chart with a callout
Average H1 rates: US$ ¥146 to ¥159 (¥13 weaker yen), euro ¥168 to ¥184 (¥16 weaker); FX increased revenue by ¥99.3 billion (993億円) and core operating profit by ¥41.2 billion (412億円).
Small table at top left with currency rows and red current-period header, two impact bullets below, remainder white space
Forecast FX assumptions revised from US$ ¥150 to ¥158 and euro ¥180 to ¥181 (H2 assumption ¥156 / ¥177); a ¥1 weaker yen versus assumption adds about ¥8.6 billion revenue and ¥2.7 billion core OP for the dollar, and about ¥3.8 billion revenue and ¥1.7 billion core OP for the euro.
Two tables stacked: FX assumptions (initial vs revised vs change) and sensitivity matrix by currency for revenue and core operating profit
In ¥100 million: total assets 35,670 (March 2026) to 35,278 (September 2026); cash 2,816 to 2,382; equity attributable to owners 18,290 to 19,817 (ratio 51.3% to 56.2%). H1 cash flow: operating 2,701 (vs 2,826), investing -819, free cash flow 1,882 (vs 2,524), financing -2,304, including CP/short-term borrowings +1,047, new bonds/loans 500, repayments -2,966 and dividends -699.
Two stacked tables: balance sheet snapshot and cash flow comparison, red headers for latest period
Interest-bearing funding fell from ¥589.9 billion (June 2026) to ¥424.9 billion (September 2026): non-current 3,200 to 2,700 (bonds 2,200; long-term loans 1,000 to 500); current 2,699 to 1,549 (CP 300 to 749, short-term loans 0 to 300, current long-term loans 1,399 to 500, current bonds 1,000 to none). Figures in ¥100 million (億円).
Single table with June and September columns, grouped non-current and current liabilities with sub-rows
Intangible assets in ¥100 million with foreign-currency reference: IZERVAY US 5,200 ($3,304M), IZERVAY ex-US 480 ($305M), VEOZAH 815 (€450M), gene therapy technology from the Audentes acquisition 570 ($362M), VYLOY 520 (€400M), ASP6958/VIR-5500 378 ($240M), ASP7317 271 ($172M), ASP546C 230, AT845 114 ($73M).
Two-column value table (yen and foreign currency) with asset names on the left, footnotes below
Target of ¥200 billion (2,000億円) recurring cost optimization during Corporate Strategic Plan 2026 (FY2026-FY2030) to fund pipeline reinvestment and keep high margins: Sustainable Margin Transformation achieved ¥65 billion in FY2024-2025, with ¥40 billion planned in FY2026, ¥45 billion in FY2027 and additional measures; levers include insourcing, global capability center, AI/digital, XTANDI and mirabegron lifecycle-based cost optimization, and a more agile operating model.
Stepped waterfall-style bar chart (grey, yellow, red) with a bracket to the ¥200 billion target, plus a red-bordered box of key measures
Full pipeline grid by area as of October 2026: prostate cancer (XTANDI, ASP6958/VIR-5500), urothelial cancer (PADCEV, enfortumab vedotin bladder preservation), upper GI and pancreatic cancer (VYLOY, zolbetuximab with pembrolizumab, ASP2138, setidegrasib, ASP546C), AML (XOSPATA and gilteritinib studies), solid tumors (setidegrasib NSCLC, gilteritinib ALK+ NSCLC, ASP1002, ASP5834, ASP2998, ASP388B), ophthalmology (IZERVAY, ASP7317, ASP2020, ASP2767), VMS (VEOZAH, fezolinetant in breast cancer) and neuromuscular/neurology (AT845, ASP2957, ASP2246).
Dense multi-panel grid of color-coded therapy-area tables, each listing assets with phase indicators (numbered circles 1-3 or 'launched')
FY2026: PoC decisions for AT845 (Pompe) and ASP2138 (pancreatic); FY2027: VYLOY Phase 3 LUCERNA data and VEOZAH HIGHLIGHT 1 data; FY2028: setidegrasib 2L+ NSCLC Phase 3 data; FY2029: setidegrasib 1L pancreatic and ASP2138 1L G/GEJ Phase 3 data. Phase 3/pivotal starts planned in FY2026-2027 for ASP7317 and ASP546C; PADCEV EV-309 data in FY2028-2030; IZERVAY prefilled syringe launch in FY2028-2029.
Four red chevron year headers across the top with milestone lists under each, lower band for Phase 3 starts and lifecycle items with product logos
Stage transitions since the previous announcement: Phase 1 entry for ASP2020 (Stargardt) and ASP388B (cancer); Phase 3 entry for ASP2138 (gastric/GEJ) and setidegrasib (NSCLC); filings for fezolinetant (menopausal VMS, Japan and China); approval of enfortumab vedotin in cisplatin-eligible MIBC (EU); discontinuation of ASP5541 (prostate cancer, Phase 2).
Five red chevrons (Phase 1, Phase 2, Phase 3, filing, approval) with assets listed underneath and a grey 'discontinued' box below
Addressable patients across the US, Germany, France, Italy, Spain, UK, Japan and China (Astellas estimate): MIBC cisplatin-ineligible EV-303 38,000; cisplatin-eligible EV-304 59,000; bladder preservation EV-309 34,000; 1L mUC EV-302 115,000; 2L+ mUC EV-301 49,000. Partnered with Pfizer.
Centered table with merged MIBC label, pivotal trial column and patient-count column, footnotes and Pfizer logo
EV-303/KEYNOTE-905 (cisplatin-ineligible MIBC, n=595): US approval November 2025, EU approval June 2026, Japan filing January 2026, China filing accepted July 2026. EV-304/KEYNOTE-B15 (cisplatin-eligible MIBC, n=808): US approval July 2026, EU approval October 2026, Japan filing May 2026, China filing accepted July 2026. EV-309 (bladder preservation vs chemoradiation, n=390): FSD June 2026. Phase 2 EV-209 (n=240): FSD April 2026.
Four-row trial table: trial name, NCT number, design, sample size, regulatory status; blue text for new events
Comparison of nine EV trials from MIBC to previously treated mUC: EV-304 EFS HR 0.53 and OS HR 0.65 with pCR 55.8% vs 32.5%; EV-303 EFS HR 0.40, OS HR 0.50, pCR 57.1% vs 8.6%; EV-302 PFS HR 0.48, OS HR 0.51 (33.8 vs 15.9 months), ORR 67.5% vs 44.2%; EV-103 and EV-201 cohort results (ORR 44-73%); EV-301 OS HR 0.70 (12.9 vs 9.0 months), ORR 41% vs 18%.
Wide matrix table: disease stage headers across columns, endpoints (OS, EFS/PFS, pCR/ORR, DoR) as rows, with checkmarks and footnote symbols
Study schemas for three Phase 3 MIBC trials: EV-303/KEYNOTE-905 (EV+pembrolizumab perioperative vs cystectomy alone, n=595, 1:1:1, primary EFS), EV-304/KEYNOTE-B15 (EV+pembro perioperative vs neoadjuvant cisplatin+gemcitabine, n=808, primary EFS) and EV-309 (EV+pembro vs concurrent chemoradiation, n=390, primary BI-EFS and OS); one cycle = 21 days.
Three horizontal study-design schematics with colored arm bars, a vertical cystectomy bar and endpoint bullets at right
38% of screened gastric/GEJ patients in SPOTLIGHT and GLOW were CLDN18.2-positive; Phase 2 ILUSTRO cohort 4B (zolbetuximab + nivolumab + mFOLFOX6) mPFS 14.8 months overall, 18.0 months in CLDN18.2-high and 23.6 months in CLDN18.2-high CPS ≥1 (ASCO GI 2026); Phase 3 LUCERNA (n=500, 1L with pembrolizumab + chemo) completed target enrollment.
Left overview and latest-data bullets, right Kaplan-Meier PFS curve, bottom trial table
Explains the quality-of-life burden of vasomotor symptoms and the post-WHI decline in hormone therapy use; trials: Japan Phase 3 STARLIGHT 2 (n=410) and STARLIGHT 3 (n=277) with Japan filing August 2026; China Phase 2 (n=150) with filing accepted October 2026; Phase 3 HIGHLIGHT 1 in breast cancer patients on adjuvant endocrine therapy (n=540), FSD August 2024.
Two text columns of context at top, then a trial table grouped by country and indication
Treatment-pathway diagram for FLT3-mutated AML positioning PASHA, PrE0905, VICEROY, GOSSAMER, MORPHO and ADMIRAL; PASHA (HOVON, n=766) missed its primary endpoint vs midostaurin; PrE0905 (n=181) topline presented at ASH 2024; VICEROY (n=70) FSD January 2023; Phase 1 in ALK-fusion NSCLC (n=40) FSD October 2025.
Flow diagram at top showing induction, consolidation, transplant and maintenance, trial table below
KRAS G12D mutation present in about 40% of pancreatic and 5% of NSCLC cases; 2L+ NSCLC Phase 3 vs docetaxel (N=356, primary PFS and OS, NCT07566052) with data expected FY2028; Phase 1 monotherapy data at ELCC 2026 and in NEJM showed mPFS 11.2 months and ORR 37.5% in second or third line.
Left overview with degrader mechanism illustration; right NSCLC panel with randomization schema and PFS curve
1L pancreatic Phase 3 with mFOLFIRINOX or NALIRIFOX (N=614, primary OS, NCT07409272), interim data expected FY2029; 1L Phase 1 data at ASCO GI 2026 (600 mg + mFOLFIRINOX: ORR 7/12, 58.3%; DCR 10/12, 83.3%); AACR Pancreatic Cancer 2026 translational data show about 95.5% KRAS G12D protein degradation and a resistance profile distinct from inhibitors daraxonrasib and HRS-4642.
Left: schema and waterfall plot; right: blue-header resistance comparison table
Subcutaneous bispecific for gastric/GEJ and pancreatic cancer (CLDN18.2-positive in about 70% of G/GEJ and 60% of PDAC); ESMO 2025 data with standard of care: 1L ORR 62.5% (15/24) and 12-week DCR 100%, 2L ORR 37.5% (9/24); 1L G/GEJ Phase 3 (N=570, primary OS and PFS, NCT07673887) in CLDN18.2 low-to-intermediate patients with data in FY2029; PDAC PoC decision in FY2026.
Two columns: overview with mechanism graphic and latest data; current status with Phase 3 schema and waterfall chart
ADC with proprietary topoisomerase I inhibitor payload (DAR 8) and MediLink TMALIN linker, FDA Fast Track in gastric cancer, global rights ex-Greater China; China Phase 2 at ASCO 2026: 2L+ G/GEJ (n=26) ORR 65.4%, DCR 84.6%, mPFS 5.7 months, mOS 11.7 months; 2L+ pancreatic (n=30) ORR 26.7%, DCR 83.3%, mPFS 4.1 months, mOS 10.0 months; global Phase 1b/2 ongoing and China Phase 3 run by Evopoint.
Left overview and status panels with ADC icon; right two survival curves each paired with a red-header data table
Compares VYLOY (monoclonal antibody), ASP2138 (T-cell-redirecting bispecific) and ASP546C (ADC) on modality, mechanism, clinical data and future potential: VYLOY as standard of care in CLDN18.2-high G/GEJ (about 38% of patients), ASP2138 expanding to low-to-intermediate expressers (about 35%) with subcutaneous dosing, ASP546C aiming at chemo-free regimens across all CLDN18.2-positive patients.
Three-column comparison table with antibody icons in headers and color-coded columns (grey, yellow, pink)
About 176,000 1L and 40,000 2L pancreatic patients across seven major markets; KRAS G12D in about 40% and CLDN18.2 in about 60% of PDAC; setidegrasib 1L Phase 3 (N=614, interim data FY2029), ASP2138 Phase 1 with PoC decision in FY2026, ASP546C Phase 1b/2 FSD in May 2026.
Headline statistics at top, two pink panels split by biomarker (KRAS G12D, CLDN18.2) with program cards
Prostate cancer program in Phase 1 (NCT05997615) that achieved PoC in mCRPC and FDA Fast Track; initial dose-escalation data at ASCO GU 2026 in heavily pretreated mCRPC: ORR 45%, one patient treated about 300 days, no dose-limiting toxicities and mostly Grade 1 CRS without prophylaxis; PSA response waterfall at ≥3000 µg/kg Q3W.
Left overview with protein-structure graphic and status bullets; right latest-data bullets and PSA waterfall chart with response table
RPE cell transplant for geographic atrophy secondary to AMD (about 5 million patients globally); Phase 1b (NCT03178149) achieved PoC in severe vision loss; ARVO 2026 data showed no intraocular inflammation, rejection or tumor signals, and mean BCVA in the study eye improved by 9.08 letters at week 52 vs -5.75 in the fellow eye (cohorts 2/2b, n=3-5).
Left overview with eye and retina illustration and status; right line chart of BCVA change over 52 weeks
Explains HLA gene editing of clinical-grade human iPS cell lines with rAAV: removing HLA class I/II avoids T-cell attack and expressing a single-chain HLA-E avoids NK-cell attack (B2M-/HLA-E, 2x TK, RFXANK-/-), from Universal Cells, an Astellas company.
Left process icons and wild-type vs universal cell diagram; right red headline bullet with sub-points and reference notes
Muscle-specific AAV8 gene therapy for Pompe disease (incidence about 1 in 40,000; standard enzyme replacement therapy requires biweekly infusions); Phase 1/2 FORTIS (NCT04174105) with FDA RMAT designation in February 2025 and additional analyses toward a PoC decision; WORLDSymposium 2026 follow-up: 5 of 6 participants with more than one year of follow-up stayed off ERT for 1-3.5+ years; FVC and 6MWT change charts.
Left overview with AAV8 capsid icon and status; right two spaghetti line charts of FVC and six-minute walk test
Common questions about this slide and the underlying presentation content.
It is Astellas' 43-page results deck for the first half of FY2026 (April to September 2026), presented on November 4, 2026. It covers the consolidated P&L, key product sales, cost items, the upward revision of the full-year forecast, pipeline progress, and a reference section with FX, balance sheet, cash flow, intangible assets, capital allocation and per-asset clinical data.
Yes. The original is a Japanese-language earnings presentation (決算説明会資料) titled 2026年度第2四半期(中間期)決算概況, released on TDnet, the Tokyo Stock Exchange's timely disclosure system. The page text here is an English summary of each slide; amounts keep the company's units, such as ¥100 million (億円).
Revenue was ¥1,270.9 billion (12,709億円), up 23.4% year on year, and core operating profit was ¥424.9 billion (4,249億円), up 50.3%, for a 33.4% core margin. Operating profit was 3,166億円 and interim net profit 2,415億円. FX added about 993億円 to revenue and 412億円 to core operating profit.
Revenue guidance rose by 1,100億円 to 23,300億円 and core operating profit by 800億円 to 7,000億円, implying a 30.0% core operating margin; full-basis operating profit rose to 4,600億円. The revised FX assumption is US$1 = ¥158 and €1 = ¥181. FY2026 runs from April 2026 to March 2027.
The five strategic brands grew 51% to 3,339億円: PADCEV 1,583, IZERVAY 562, VYLOY 459, XOSPATA 429 and VEOZAH 307 (all 億円). XTANDI was 5,337億円, up 12% but roughly flat excluding FX, with a decline expected in the second half because of the US Inflation Reduction Act.
The original PDF can be downloaded free from this page. It is a useful reference for structuring a pharma or biotech earnings deck, with a highlights page, red-accented financial tables, pipeline stage maps, milestone timelines and asset profile slides. 2Slides can help you build a similar deck from your own content.
EU approval of PADCEV in cisplatin-eligible MIBC, VEOZAH filings in Japan and China, first patients dosed in Phase 3 trials of setidegrasib (NSCLC) and ASP2138 (gastric/GEJ cancer), proof of concept for ASP6958/VIR-5500 in mCRPC, and three new clinical programs: ASP388B, ASP2020 and ASP2767. ASP5541 was discontinued.
Official English IR site with financial results, presentations and Corporate Strategic Plan 2026 materials
Japanese IR site where the original 決算説明会資料 are posted

Create Your Own Slides
Turn your ideas into professional presentations in seconds with 2slides AI.
Reference professional designs, choose your style, and generate slides with perfect text rendering. Powered by Nano Banana—start creating your presentation now.
Your AI Agent for slides. Save time, shine faster with intelligent presentation creation.


© 2026 2slides. All rights reserved.