
Part of Investor presentation examples · Semiconductor investor presentation examples
Arm Holdings plc Q2 FYE27 Investor Presentation (November 4, 2026): second-quarter fiscal 2027 results for the quarter ended September 30, 2026, with total revenue of $1,443m (up 27% YoY), Q3 FYE27 guidance, and Arm's long-term model built on IP/CSS royalties, licensing and the new Arm AGI CPU silicon business, published on Arm's investor relations site.
Uses this deck’s cover as a style reference for slides made from your own content. Or pick any page below to use its layout as the reference.
Quick Navigation
Tags
Share the slides
Arm Holdings plc Q2 FYE27 Investor Presentation (November 4, 2026): second-quarter fiscal 2027 results for the quarter ended September 30, 2026, with total revenue of $1,443m (up 27% YoY), Q3 FYE27 guidance, and Arm's long-term model built on IP/CSS royalties, licensing and the new Arm AGI CPU silicon business, published on Arm's investor relations site.
Detailed view of each slide page, including layout, key content and visual elements.
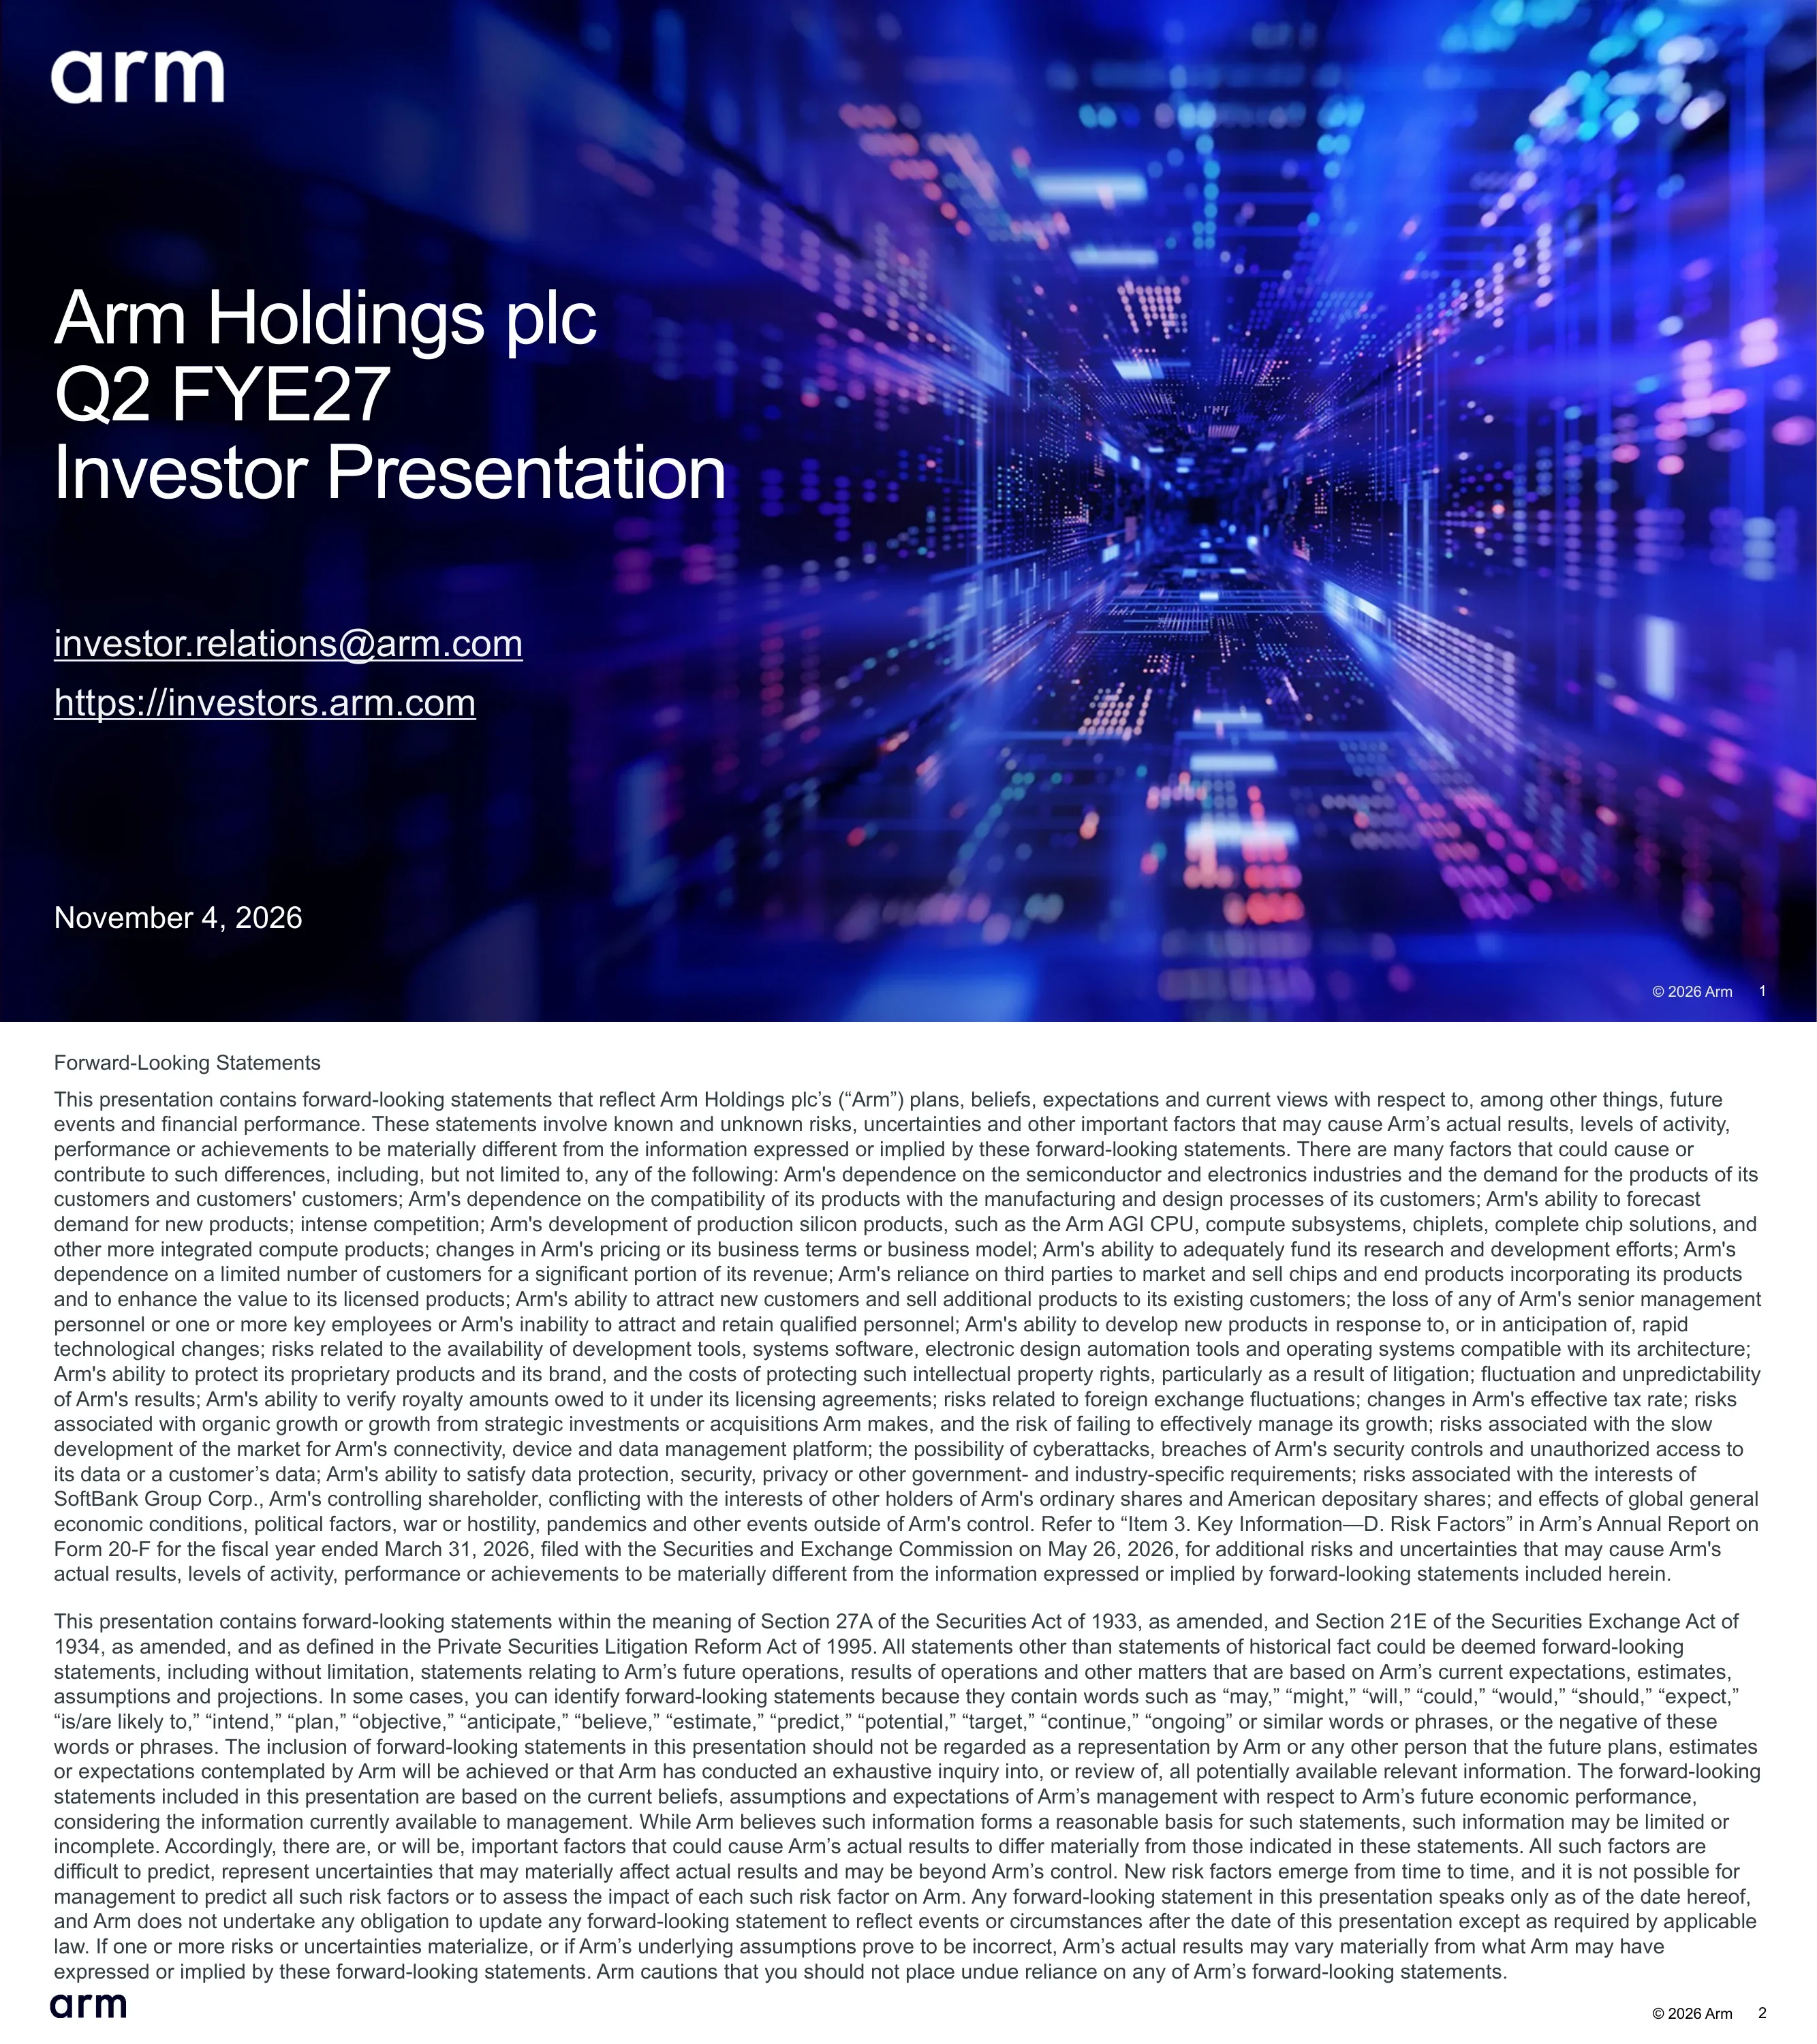
Cover slide titled Arm Holdings plc Q2 FYE27 Investor Presentation, dated November 4, 2026, with contact details investor.relations@arm.com and https://investors.arm.com.
Full-bleed photographic background of a glowing blue and purple data center corridor; white Arm logo top-left; large white left-aligned title block; contact links and date stacked below.
Safe-harbor disclaimer listing risks such as dependence on the semiconductor industry, competition, development of production silicon including the Arm AGI CPU, CSS and chiplets, customer concentration, royalty verification, FX, tax, and the interests of controlling shareholder SoftBank Group; refers to the Form 20-F for the fiscal year ended March 31, 2026, filed May 26, 2026.
Two dense full-width paragraphs of small grey body text on white under a small heading; Arm logo bottom-left, page number bottom-right.
Defines the non-GAAP measures used (cost of sales, gross margin, R&D and SG&A opex, operating income and margin, net income, EPS, free cash flow and FCF TTM), explains exclusions such as share-based compensation, employer taxes on SBC, acquisition-related expenses and equity-investment gains or losses, and notes third-party logos are used without endorsement.
Full-page block of disclaimer paragraphs with two small section headings; white background.
Operating highlights: total revenue $1,443m (up 27% YoY), non-GAAP operating expenses $774m, trailing 12-month non-GAAP free cash flow $1,096m. Innovation highlights: more than 375bn cumulative Arm-based chips shipped since 1990, strong Arm AGI CPU demand turning into purchase orders with Arm more confident in up to $2bn of chip revenue across FYE27 and FYE28, and four more CSS licenses signed in the quarter for data center and smartphone chips.
Three-column layout: left rounded card with three large blue KPI figures, large black Arm logo in the centre, right rounded card with three blue headline highlights and grey supporting text.
Total revenue $1,443m up 27% YoY; royalty revenue $670m up 8% on Armv9 and CSS royalty rates and data center deployment, partly offset by memory pricing pressure on smartphones; license and other revenue $773m up 50% on strong IP demand, timing of high-value agreements and backlog. Stacked bar chart covers FYE24 Q2 to FYE27 Q2, highlighting FYE26 Q2 ($1,135m) versus FYE27 Q2 ($1,443m).
Title and three bullet points across the top; 13-bar stacked column chart below with blue royalty and navy license segments, values labelled inside bars, dashed callout boxes around the comparison quarters.
Annualized contract value (ACV), a normalized measure of license and other revenue, rose 12% YoY to $1,790m in Q2, continuing a steady climb from $1,108m in FYE24 Q2, while quarterly license revenue fluctuated between $330m and $819m.
Single bullet under the title; combined chart with blue columns for quarterly license revenue and a blue line with circle markers for ACV, joined by dashed drop lines.
Revenue-to-profit bridge: revenue $1,443m (license $773m, royalty $670m), non-GAAP cost of sales $31m, non-GAAP gross profit $1,412m (98% gross margin), non-GAAP operating expenses $774m, non-GAAP operating income $638m (44% operating margin) and non-GAAP net income $566m; depreciation and amortization was $81m.
Waterfall-style column chart from left to right with colour-coded bars (blue/teal revenue, purple gross profit, teal opex, orange operating income, grey net income); large margin percentages above the relevant bars; footnotes at bottom.
Q3 FYE27 guidance: revenue of $1,540m plus or minus $50m (printed on the slide as "$1,540bn +/- $50m"), non-GAAP operating expense of about $825m, and non-GAAP fully diluted EPS of $0.56 plus or minus $0.04; a footnote explains that forward-looking non-GAAP measures are not reconciled to GAAP.
Clean three-row table with a light-blue header row labelled Q3 FYE27; metric names left, guidance values right; footnote paragraph below.
Section divider introducing the strategy part of the deck on product mix and market opportunity.
Dark navy full-bleed background with an Earth-from-space horizon showing city lights; large white left-aligned title; white Arm logo top-left.
Three-stage progression: IP Portfolio (more Armv9 CPUs, performance per watt), CSS Platform (higher royalty, 2x Armv9 CPU, integrated and validated systems), and Silicon (product and market expansion, an optimized chip family for cloud and AI data centers).
Horizontal arrow banner split into three labelled stages across the top; three image panels below showing separate IP blocks, the same blocks integrated into a subsystem, and a rendered Arm chip package.
Arm IP and CSS are licensed to chip designers, who pay an upfront license fee and a per-chip royalty; separately, the Arm AGI CPU is sold directly to cloud and AI data center companies, generating chip revenue.
Three bullets on top; flow diagram below with an Arm 'power efficient compute' box branching into two rows of three linked cards (model, customer, what Arm earns), blue for the IP/CSS model and dark purple for the silicon model.
Three additive growth drivers: More Chips (semiconductor revenue grew at about 10% CAGR over ten years and CPU-related revenue is forecast to grow about 12% CAGR to 2030), More Share Gains (Arm gaining share in growing end markets), and More Arm Technology (inference and agentic AI workloads drive higher royalty rates per chip).
Three equal outlined cards in a row joined by purple plus signs; heading and short grey paragraph in each card; footnote on the forecast source.
Cloud AI (cloud, enterprise, wireless and edge infrastructure), Edge AI (intelligent edge devices such as phones, wearables and glasses, personal AI computing, PCs and tablets) and Physical AI (autonomous and AI-defined vehicles, robotics), each benefiting from market growth, share gains and Armv9 and CSS royalty rates.
Purple subtitle under the main title; three rows, each with a blue segment label and description on the left and product photos under blue-underlined category headers on the right.
Arm's TAM estimates from FYE26 to FYE31: Cloud AI grows from $35B other CPU, $50B data center CPU and $245B XPU to $50B, $100B+ and $1T+; Edge AI from $180B to $245B; Physical AI from $25B to $60B; total from $535B to $1.5T+ (internal estimates as of March 2026).
Table-like grid with four rows (Cloud AI, Edge AI, Physical AI, Total); FYE26 values left, FYE31 values right, gradient wedge shapes between them showing growth; light grey row backgrounds.
Opportunity steps: $2.4B IP/CSS-only opportunity (FYE26), $24B when the AGI CPU captures full chip value (FYE26), $50B by enlarging the customer set beyond CSPs (FYE26), and $100B+ as inference and agentic AI at least double the market in five years (FYE31): a 40x opportunity increase from FYE26 to FYE31.
Four chevron arrows running left to right with dollar figures above each; very large '40x' statement in the lower right with supporting text.
Accelerators generate tokens, CPUs orchestrate and agents drive the system: agents execute workflows continuously, generate more than 15x more requests per user, and shift the bottleneck to the CPU; an AI data center needs about 30m CPU cores per GW today versus about 120m with agentic AI, so 4x more cores must fit in the same power envelope.
Purple subtitle; left column of three bulleted headings with short explanations; right dark navy rounded panel comparing ~30m and ~120m cores per GW in cyan with a lavender 4x arrow and a bold conclusion line.
Customer demand and the financial opportunity led to the Arm AGI CPU, built for efficiency (purpose-built with no legacy overhead), scale (more cores deliver linearly more performance while memory and IO keep pace) and performance (more work per cycle, full performance always available).
Bullet list on the left with bolded keywords; large rendered Arm AGI CPU package image on the right.
Arm's IP/CSS business is gaining share in the data center; the AGI CPU shares the same software ecosystem and began with demand pull from new customers; FYE28 is expected to be the first year of meaningful AGI CPU revenue, ramping exponentially to about $15B in FYE31, complementary to IP/CSS.
Six bullets on the left; right outlined chart panel with blue gradient columns FYE26 to FYE31 rising to a dashed $15B line (no individual year values shown).
Royalty drivers have been end-market growth, share gains, more cores and complexity per chip, and higher royalty rates from Armv9 and CSS; royalty revenue grew at about 14% CAGR from FYE22 to FYE26 and is forecast to grow at a 20% CAGR from FYE26 to FYE31.
Bullets with sub-bullets on the left; right chart panel titled 'Increasing royalty revenue growth' with columns FYE22 to FYE31 and an orange two-segment trend line labelled ~14% CAGR and 20% CAGR (no column values shown).
Technology improvements keep customers on the leading edge and lift royalty rates: per-core pricing rises from 1x for first-gen Armv9 (2023) through subsequent-gen Armv9 (2025) and first-gen CSS (2023) to about 3x for subsequent-gen CSS (2025). Higher core count: AI and agentic AI drive more cores per data center chip, and Arm's royalty scales with core count, shown in a scatter of launched and planned customer chips from 2016 to 2032 trending toward roughly 250 cores.
Two-column comparison with blue 'Technology Improvements' and orange 'Higher Core Count' header bars; left panel horizontal arrow bars against a 1x-3x per-core pricing axis; right panel scatter plot with a dotted trend line.
More than 70% of Arm's forecast royalties are based on rates already under contract: 100% for FYE26, ~100% for FYE27, ~85% for FYE28, ~75% for FYE29, ~65% for FYE30 and ~60% for FYE31.
Purple subtitle; six full-height bars in an outlined panel, blue portion showing contracted share with rotated white percentage labels and grey gradient tops for the uncontracted remainder.
Royalty revenue mix excluding the Arm AGI CPU family: in FYE26 Edge AI was 78%, Cloud AI 14% and Physical AI 8%; the FYE31 pie (no percentages printed) shows Cloud AI growing to a much larger slice, roughly a third or more, with Edge AI still the largest.
Two side-by-side outlined panels each containing a gradient pie chart with segment labels; FYE26 left with percentages, FYE31 right without.
License revenue growth is well ahead of prior long-term expectations and will stay above the long-term target in the near term, leading to strong royalty growth later; the chart shows license revenue rising each year from FYE26 to FYE31, including design service revenue (for example from SoftBank) and excluding chip revenue.
Three bullets on the left; right outlined chart panel titled 'Increasing license revenue' with six gradient columns and no data labels; footnote inside the panel.
The Arm AGI CPU expands Arm into an underserved customer base and its revenue is additional to CPU IP and CSS license and royalty revenue; a stacked chart of licensing, royalty and AGI CPU revenue from FYE26 to FYE31 rises to about $25B in FYE31.
Two bullets on the left; right outlined panel with stacked columns in cyan (licensing), purple (royalty) and blue (Arm AGI CPU) and an orange dashed $25B line.
AI creates unprecedented opportunity and Arm's R&D drives new products; Arm has already ramped R&D for CPU, CSS and chip roadmaps, so non-GAAP operating cost growth decelerates from a 26% CAGR (FYE24 to FYE26) to a forecast mid-teens CAGR from FYE26 to FYE31.
Four bullets left; right chart panel with columns FYE24 to FYE31 and an orange two-segment trend line labelled 26% CAGR and mid-teens CAGR.
FYE31 model: IP/CSS business with $10B revenue and more than 65% non-GAAP operating margin; Arm AGI CPU business with $15B chip revenue and more than 30% non-GAAP operating margin; consolidated non-GAAP EPS of more than $9.
Three columns with grey headings; two stacked outlined KPI boxes in each of the first two columns and one tall box for consolidated EPS; large blue figures.
Section divider opening the appendix of historical royalty data and financial reconciliations.
Solid dark navy background with the word Appendix in white, placed right of centre.
Royalty revenue by architecture from FYE18 to FYE26: Armv7 and older falls from about 60% to under 25%, Armv8 peaks mid-period, and Armv9 rises from a sliver in FYE22 to roughly a third in FYE26; Armv9 commands a higher royalty per chip and adoption has started in smartphones and cloud compute.
100% stacked column chart across nine fiscal years in three shades of blue with legend; two bullets below.
Market share by chip value: Arm rose from 42% in FYE22 to 44%, 48%, 48% and 53% in FYE26, versus x86 and other architectures (proprietary ones such as 68000, AVR, PIC and PowerPC, and licensable or open-source ones such as MIPS and RISC-V), based on Arm internal estimates.
Boxed 100% stacked column chart with Arm share labelled in each bar; notes listing 'Other' architectures below.
Royalty revenue can continue for decades: a stacked area chart of royalty revenue by product launch cohort (FYE10 and older through FYE23 to FYE26) grows from about $750m in FYE16 to about $2.5bn in FYE26, and Arm is still collecting royalties on products developed in the early 1990s.
Single bullet; large stacked area chart with five colour bands (blue, navy, orange, cyan, magenta) on the left; teal vertical rule and large blue statement text on the right.
Market share and market value by end market, FYE22 to FYE26: mobile applications >99% ($29bn to $43bn), other mobile 70% ($18bn to $19bn), consumer electronics 30% to 36% ($72bn to $67bn), IoT and embedded 50% to 56% ($49bn to $51bn), cloud compute 9% to 23% ($16bn to $50bn), networking 26% to 37% ($15bn to $19bn), other infrastructure 12% to 17% ($14bn to $17bn), automotive and robotics 31% to 44% ($15bn to $26bn); total 44% to 50% ($228bn to $292bn).
Nine-row table grouped by vertical Edge AI, Cloud AI and Physical AI labels; band shapes showing share change in the middle and market value change on the right; footnotes and source note.
Same end-market table extended to FYE31 market value: mobile applications ~$80bn, other mobile ~$20bn, consumer electronics ~$75bn, IoT and embedded ~$70bn, cloud compute ~$100bn, networking ~$25bn, other infrastructure ~$25bn, automotive and robotics ~$60bn, total CPU opportunity ~$455bn.
Identical layout to the previous slide with an added FYE31 column whose bands slope upward to the right edge.
For the three months ended September 30, 2026: GAAP gross margin 97.1% vs 97.9% non-GAAP; GAAP total operating expenses $1,200m vs $774m non-GAAP (mainly $368m share-based compensation); GAAP operating income $201m (13.9% margin) vs $638m (44.2%); GAAP net income $130m vs $566m non-GAAP; diluted EPS $0.12 GAAP vs $0.52 non-GAAP on 1,079m diluted shares.
Financial reconciliation table with GAAP results, five adjustment columns and non-GAAP results; serif table font typical of SEC filings.
Quarterly cash flow for the three months ended September 30, 2026 vs 2025: net cash from operating activities $207m vs $567m, investing activities $103m vs $196m (including $249m acquisitions and $510m short-term investment maturities), financing activities -$113m vs -$190m; cash and equivalents at period end $3,251m vs $2,518m.
Title on the left; compact full-height cash flow table on the right with two comparison columns.
Quarterly non-GAAP free cash flow was $110m (vs $411m a year earlier) after $72m property and equipment, $5m intangibles and $20m intangible obligations; trailing twelve months ended September 30, 2026 FCF was $1,096m (vs $1,073m) from $1,734m operating cash flow.
Two stacked reconciliation tables (quarter and TTM), each comparing 2026 and 2025; two-line title.
Common questions about this slide and the underlying presentation content.
It is Arm Holdings plc's 35-page deck for the second quarter of fiscal year 2027 (the quarter ended September 30, 2026), dated November 4, 2026. It covers quarterly highlights, royalty and license revenue, annualized contract value, the revenue-to-profit bridge, Q3 FYE27 guidance, the Arm AGI CPU strategy, long-term targets to FYE31 and an appendix of GAAP reconciliations and cash flow.
Arm's fiscal year ends on March 31, so FYE27 runs from April 2026 to March 2027. Q2 FYE27 is July to September 2026, and the Q3 FYE27 guidance in the deck covers October to December 2026.
Total revenue was $1,443m, up 27% year over year, made up of $670m royalty revenue (up 8%) and $773m license and other revenue (up 50%). Non-GAAP operating income was $638m (44% margin), non-GAAP net income $566m, non-GAAP diluted EPS $0.52, and trailing twelve-month non-GAAP free cash flow $1,096m.
Arm guided to revenue of $1,540m plus or minus $50m, non-GAAP operating expense of about $825m, and non-GAAP fully diluted EPS of $0.56 plus or minus $0.04. The slide prints the revenue figure as "$1,540bn", but the row is labelled in $m, so it means $1.54 billion.
The Arm AGI CPU is a complete chip that Arm sells directly to cloud and AI data center companies, alongside its traditional licensing and royalty model. The deck says demand is turning into purchase orders, with up to $2bn of chip revenue across FYE27 and FYE28, FYE28 as the first meaningful revenue year, and about $15B of chip revenue in FYE31 at a non-GAAP operating margin above 30%.
For FYE31, Arm models $10B of IP/CSS revenue at a non-GAAP operating margin above 65%, $15B of AGI CPU revenue, royalty revenue growing at a 20% CAGR from FYE26, non-GAAP opex growing at a mid-teens CAGR, and consolidated non-GAAP EPS of more than $9. These are Arm's internal estimates as of March 2026.
Yes. The original PDF of all 35 slides is free to download from this page, and each slide is also shown as an image with a written page-by-page summary. The original was published on Arm's investor relations site, investors.arm.com.
The deck follows a clear earnings structure: highlights, revenue breakdown, a P&L bridge, guidance, strategy and market sizing, long-term model and a financial appendix. Its white backgrounds, navy titles, blue data colour and outlined chart panels make a good reference for an IR or finance deck, and you can recreate the structure with your own figures.
Official investor relations site where Arm publishes quarterly results, shareholder letters and investor presentations.

Create Your Own Slides
Turn your ideas into professional presentations in seconds with 2slides AI.
Reference professional designs, choose your style, and generate slides with perfect text rendering. Powered by Nano Banana—start creating your presentation now.
Your AI Agent for slides. Save time, shine faster with intelligent presentation creation.


© 2026 2slides. All rights reserved.