
Part of Investor presentation examples
Amgen Q3 2026 Earnings Presentation: the 28-slide deck Amgen (NASDAQ: AMGN) used on its Q3 2026 earnings call on November 3, 2026, published on investors.amgen.com. It covers $10.4B in total revenues (+8% YoY), non-GAAP EPS of $6.45 (+14%), a 47% non-GAAP operating margin, six key growth drivers that grew 27% and made up more than 70% of product sales, the Phase 3 pipeline across four therapeutic areas, Q3 clinical readouts, raised 2026 guidance, and full GAAP to non-GAAP reconciliations.
Uses this deck’s cover as a style reference for slides made from your own content. Or pick any page below to use its layout as the reference.
Quick Navigation
Tags
Share the slides
Amgen Q3 2026 Earnings Presentation: the 28-slide deck Amgen (NASDAQ: AMGN) used on its Q3 2026 earnings call on November 3, 2026, published on investors.amgen.com. It covers $10.4B in total revenues (+8% YoY), non-GAAP EPS of $6.45 (+14%), a 47% non-GAAP operating margin, six key growth drivers that grew 27% and made up more than 70% of product sales, the Phase 3 pipeline across four therapeutic areas, Q3 clinical readouts, raised 2026 guidance, and full GAAP to non-GAAP reconciliations.
Detailed view of each slide page, including layout, key content and visual elements.
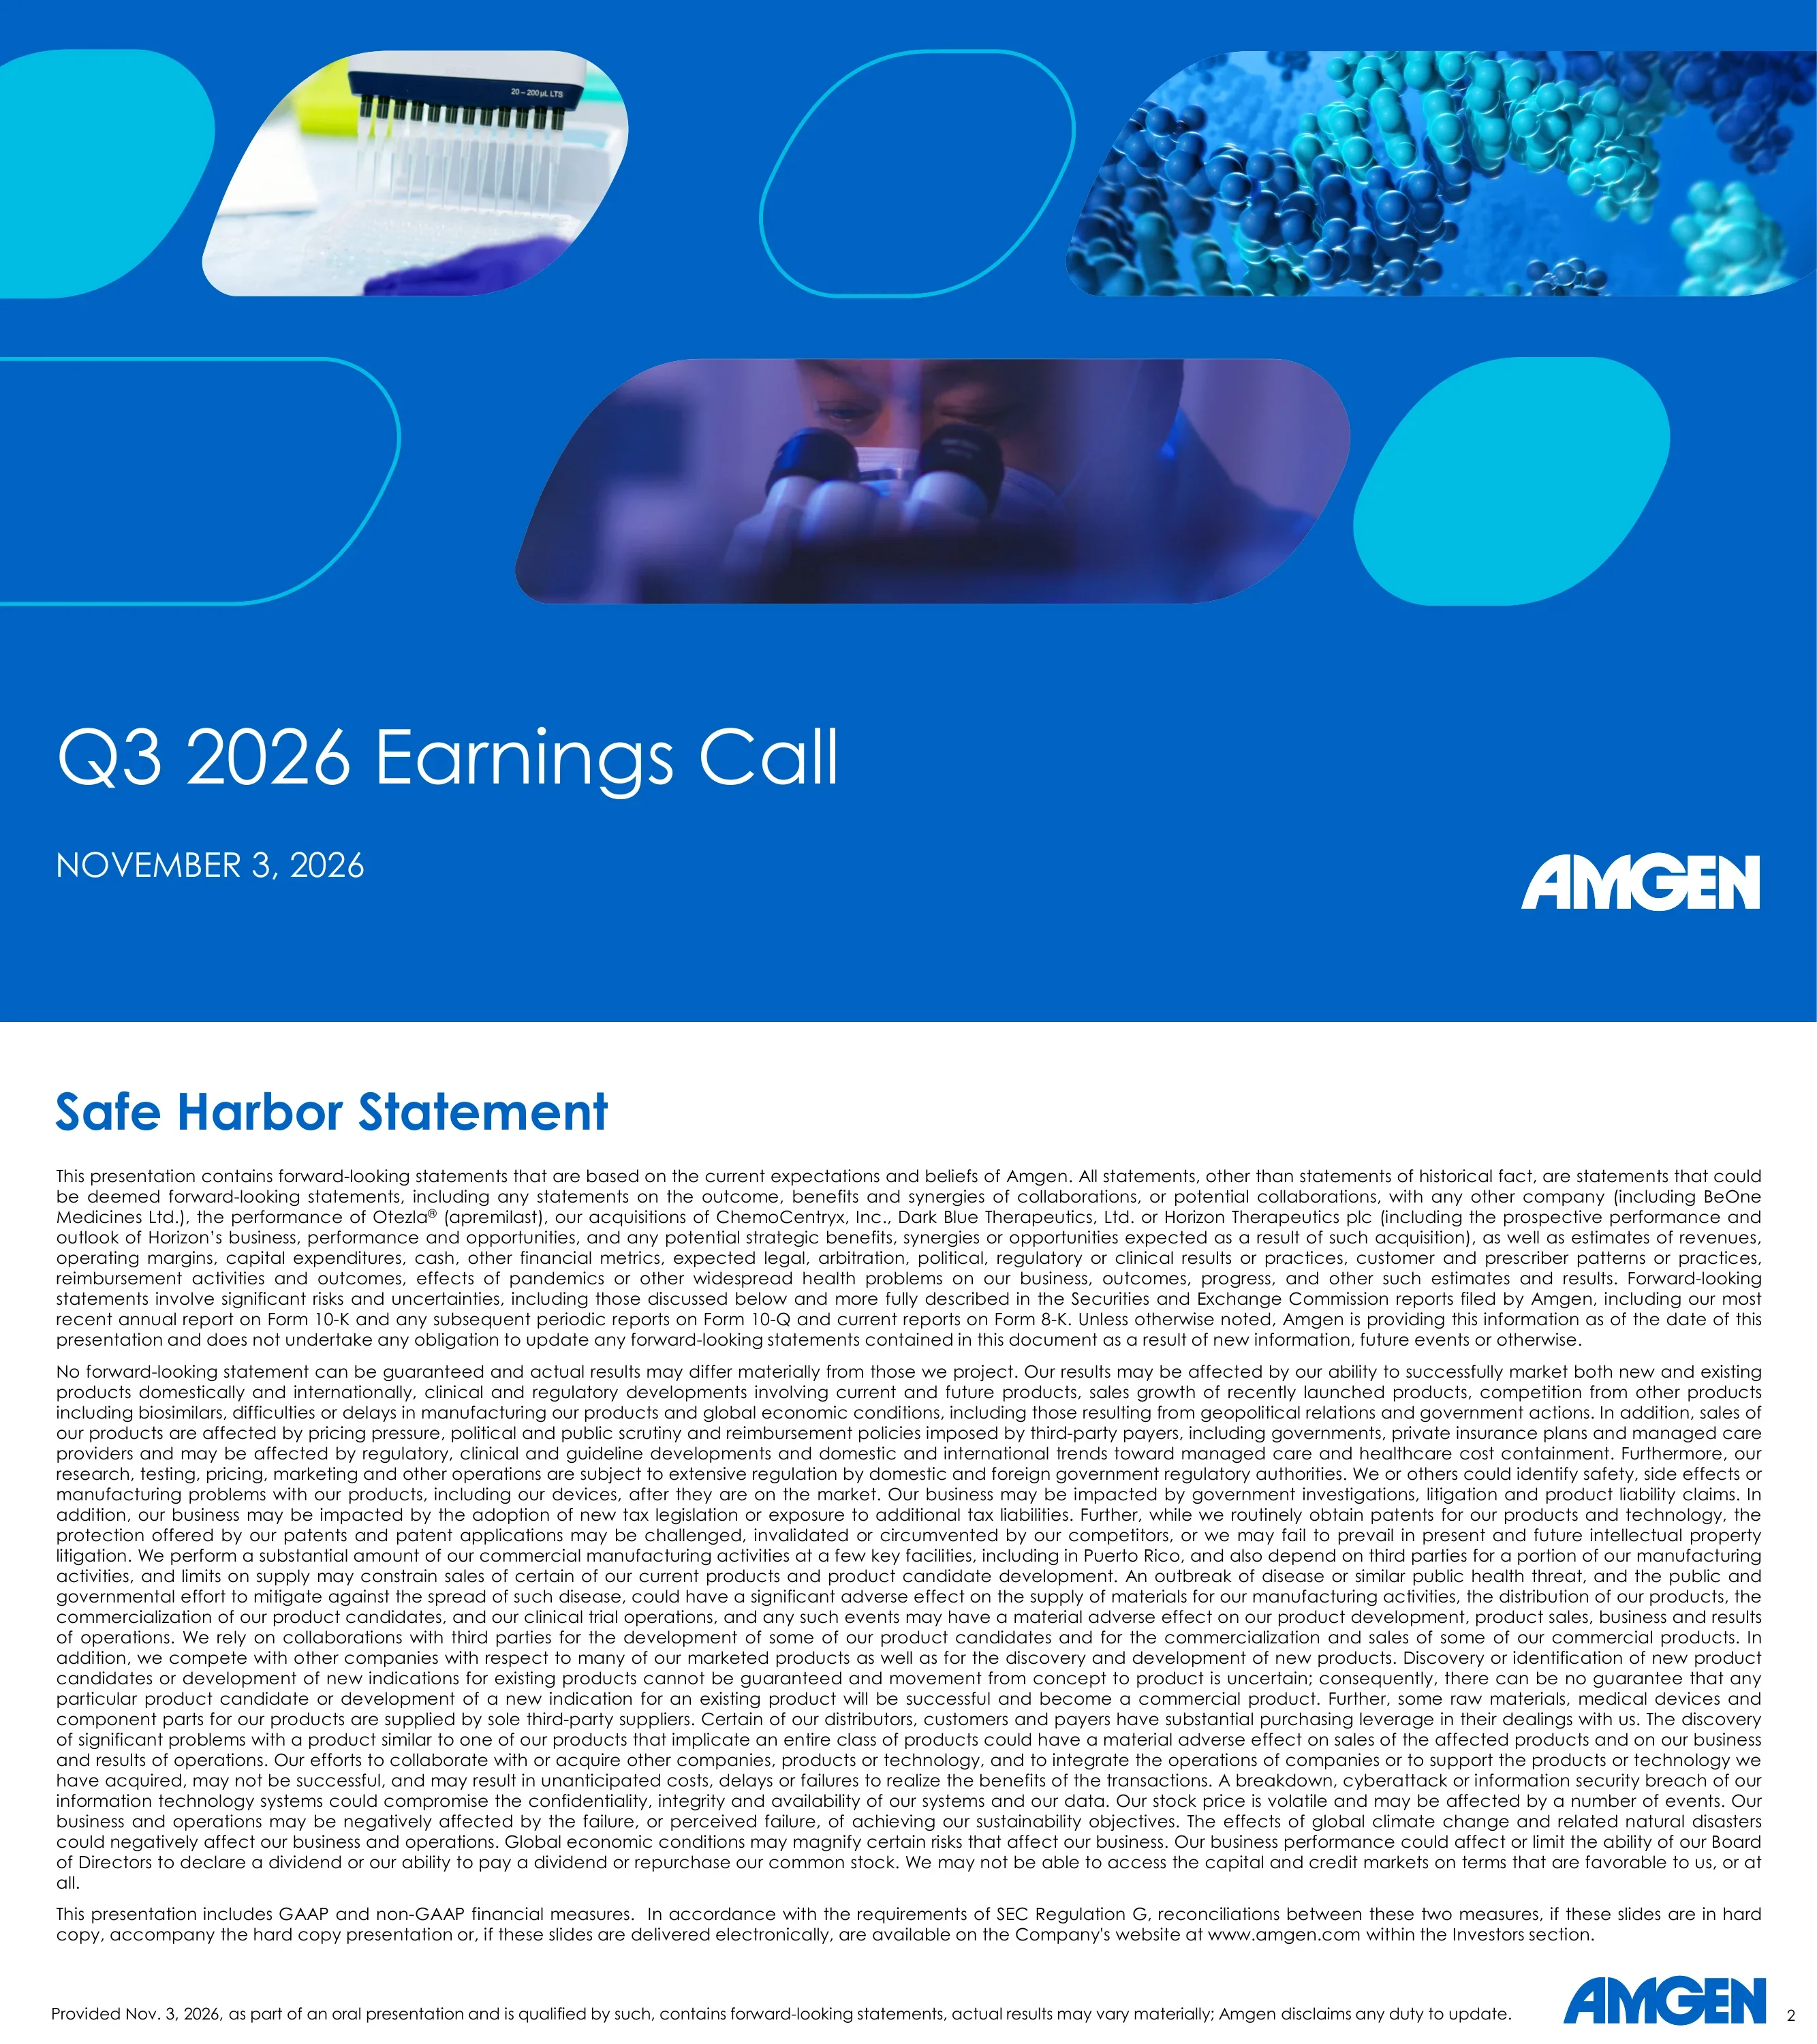
Cover slide titled Q3 2026 Earnings Call, dated November 3, 2026, with the Amgen logo.
Full-bleed royal blue background with rounded parallelogram photo windows across the top half (lab pipette, molecular structure, scientist at a microscope); title and date bottom left, white logo bottom right.
Forward-looking statements disclaimer covering collaborations (including BeOne Medicines), Otezla, the ChemoCentryx, Dark Blue Therapeutics and Horizon acquisitions, and risks such as biosimilar competition, pricing pressure, manufacturing concentration in Puerto Rico and IT security; notes that GAAP to non-GAAP reconciliations are available in the Investors section of amgen.com per SEC Regulation G.
Bold blue title at top followed by three dense justified paragraphs of body text filling the slide; standard footer disclaimer and logo.
Quote from Chairman and CEO Robert A. Bradway on another strong quarter; financial highlights of total revenues $10.4B (+8% YoY), non-GAAP EPS $6.45 (+14%), non-GAAP R&D expense $2.1B (+11%) and 47% operating margin; six growth drivers with Q3 YoY growth (Repatha +37%, EVENITY +39%, TEZSPIRE +43%, Rare Disease +21%, Innovative Oncology +21%, Biosimilars +26%); R&D highlights for IMDELLTRA (positive overall survival in DeLLphi-305, reduced monitoring approval in the U.S.), dazodalibep (positive Ph3 OASIZ 301 in systemic Sjogren's), TEZSPIRE (positive Ph3 CROSSING in EoE), daxdilimab (positive Ph2 in DLE) and UPLIZNA (new Ph3 in PMN).
Quote banner with CEO headshot across the top; three panels below: a blue gradient KPI column on the left, a grey panel with a 2x3 grid of product badges and growth percentages in the middle, and an outlined R&D highlights list with checkmarks and color-coded therapeutic-area markers on the right.
Section divider introducing the commercial update.
Blue-to-cyan gradient background with a wide rounded molecular image banner in the upper half and a large thin white section title lower left.
Total revenues rose from $8.5B in Q3 2024 to $9.6B in Q3 2025 and $10.4B in Q3 2026; 8% total revenue growth, 17 products with at least double-digit sales growth, and 17 products annualizing at $1B+ based on Q3 sales.
Left half: blue gradient card with a three-bar column chart; right half: three stacked big-number statements separated by thin cyan rules.
Q3 2026 product sales of $9.9B (+8% YoY); the six growth drivers contributed Repatha $1.1B, EVENITY $0.8B, TEZSPIRE $0.5B, Rare Disease $1.6B, Innovative Oncology $2.1B (Blincyto, Imdelltra, Kyprolis, Lumakras, Nplate, Vectibix) and Biosimilars $1.0B.
Donut chart on the left showing the growth-driver share of product sales with the total in the center, connected by a line to a rounded card holding a 2x3 grid of product logos and dollar values.
Q3 YoY growth of +37% for Repatha (reaching more patients in primary care and cardiology; about 100M patients not at LDL-C goal), +39% for EVENITY (bone-building-first approach to fracture risk, partnered with UCB and Astellas in Japan) and +43% for TEZSPIRE (severe asthma and CRSwNP, partnered with AstraZeneca).
Three equal columns separated by thin vertical rules, each with a rounded product logo badge, a large blue growth percentage and a short centered description.
Q3 YoY growth of +21% for Rare Disease (UPLIZNA in NMOSD, IgG4-RD and gMG), +21% for Innovative Oncology (IMDELLTRA overall survival benefit in first-line maintenance SCLC and reduced monitoring) and +26% for Biosimilars (PAVBLU adoption among retina specialists).
Mirrors page 7: three columns with colored category pills (teal, blue, slate) holding icons, big growth figures and centered descriptions.
Section divider introducing the research and development update.
Same gradient and molecular image banner as the other section dividers, with the section title lower left.
Amgen's R&D framework in three pillars: therapeutic areas (General Medicine, Rare Disease, Inflammation, Oncology), modalities (small molecules, siRNA, biologics) and AI and data (accelerating discovery and development with AI at scale).
Three equal photo tiles across the slide (scientist in lab, protein structures, glowing AI chip), each with a blue caption band underneath holding an uppercase heading and subtext.
Phase 3 programs by area: General Medicine (MariTide in chronic weight management, maintenance extensions, switching from weekly GLP-1s, ASCVD, heart failure, obstructive sleep apnea and type 2 diabetes; olpasiran in ASCVD, primary prevention and plaque changes); Rare Disease (UPLIZNA in autoimmune hepatitis, PMN and CIDP; TEPEZZA thyroid eye disease; TAVNEOS pediatric ANCA vasculitis; dazodalibep in systemic and symptomatic Sjogren's); Inflammation (TEZSPIRE in EoE and COPD); Oncology (BLINCYTO B-ALL, IMDELLTRA in four SCLC settings, xaluritamig in mCRPC, LUMAKRAS 1L CRC and NSCLC, Nplate CIT and ITP); Biosimilars (ABP 206 to OPDIVO, ABP 234 to KEYTRUDA, ABP 692 to OCREVUS, ABP 938 8 mg to EYLEA HD). Daggers mark programs with Phase 3 data reported in Q3 2026.
Blue gradient banner subtitle, then four tinted columns with colored left rules listing program and indication pairs, plus a color legend for the five areas and dense abbreviation footnotes.
43K patients on study and 297 clinical trials (including pipeline and real-world evidence trials, snapshot as of September 30, 2026); Q3 2026 events: IMDELLTRA overall survival in DeLLphi-305 at ESMO and U.S. approval for reduced monitoring of 6-8 hours for the first two doses; dazodalibep positive OASIZ 301 results with a late-breaking presentation at ACR Convergence in November; TEZSPIRE CROSSING EoE data at ACG and UEGW; daxdilimab Phase 2 DLE data at EADV; Repatha VESALIUS-CV analyses at ESC; UPLIZNA new Phase 3 in PMN and 1-year MINT open-label data in gMG at AANEM.
Left blue gradient card with two oversized stats and icons; right outlined panel with a checkmark list of drug-by-drug Q3 events, color-coded by therapeutic area.
Three columns tracking 2026 milestones with checkmarks for completed items. Study initiations: MariTide switching from weekly GLP-1s, CWM maintenance extensions (2 studies), type 2 diabetes (1 of 3 started, 2 more in Q4 2026); UPLIZNA AIH and PMN done, CIDP in H2 2026 to H1 2027. Study completions: TEPEZZA on-body injector, dazodalibep systemic Sjogren's, TEZSPIRE EoE and Sunakiment Phase 2 asthma done; dazodalibep symptomatic Sjogren's in Q4. Major approvals: UPLIZNA gMG in EU, IMDELLTRA approvals and label updates in the EU, China and Japan, and IMDELLTRA reduced monitoring in the U.S.
Three black rounded header pills (Study Initiations, Study Completions, Major Approvals) above checklists with large green checkmarks and colored area markers; legend at the bottom.
IMDELLTRA (tarlatamab) data: Phase 3 DeLLphi-305 primary analysis in 1L maintenance ES-SCLC with durvalumab, presented at ESMO 2026 and published in the New England Journal of Medicine; Phase 1b DeLLphi-303 long-term follow-up poster in 1L maintenance; Phase 3 DeLLphi-304 extended overall survival follow-up in 2L ES-SCLC with an Annals of Oncology brief trial update. QR codes link to the presentations and publications.
Three outlined cards with blue gradient tab headers: one large card on the left with overlapping congress title slide and journal page thumbnails, two stacked cards on the right with poster thumbnails; QR codes with captions in each card.
TEZSPIRE (tezepelumab) Phase 3 CROSSING results in adults and adolescents with eosinophilic esophagitis, presented at ACG 2026 and as 52-week data at UEG Week in Barcelona; daxdilimab Phase 2 randomized, placebo-controlled trial in moderate-to-severe discoid lupus erythematosus, presented at the EADV Congress in Vienna (30 Sep to 3 Oct 2026). Materials are linked via congressdata.amgenmedinfo.com and a QR code.
Two side-by-side outlined cards with gradient tab headers; left card shows overlapping ACG and UEG title slides, right card shows a large crimson EADV title slide; link and QR code beneath.
Section divider introducing the financial update.
Gradient background with the recurring molecular image banner and the section title lower left.
Six KPIs: total revenues $10.4B (+8%), non-GAAP R&D investment $2.1B (+11%), non-GAAP EPS $6.45 (+14%), non-GAAP operating margin 47% of product sales, free cash flow $3.7B and capital expenditures $0.6B; a banner restates R&D growth of 11% with a 47% operating margin.
2x3 grid of KPI blocks with cyan top rules, bold labels and large blue figures, above a full-width blue banner with a one-line takeaway.
Q3 2026 vs Q3 2025 in $ billions: revenues $10.4 vs $9.6 (+8%); product sales $9.9 vs $9.1 (+8%); other revenues 0.5 vs 0.4 (+15%); non-GAAP operating expenses 5.7 vs 5.3 (+8%); non-GAAP operating income 4.7 vs 4.3 (+9%), at 47.3% vs 47.1% of product sales; non-GAAP net income 3.5 vs 3.1 (+15%); non-GAAP EPS $6.45 vs $5.64 (+14%).
Three-column comparison table with black rounded column headers (Q3 '26, Q3 '25, % Inc/(Decr)), blue row labels and cyan row dividers.
Cash flow data Q3 '26 vs Q3 '25 ($B): capital expenditures $0.6 vs $0.4, depreciation $0.2 vs $0.2, intangible asset amortization $0.9 vs $1.1, free cash flow $3.7 vs $4.2, share repurchases $0.0 vs $0.0, YoY dividend increase 6% vs 6%, dividends paid per share $2.52 vs $2.38. Balance sheet: cash and cash equivalents $13.2B at 9/30/26 vs $9.1B at 12/31/25; debt outstanding $54.0B vs $54.6B.
Two stacked two-column tables (Cash Flow Data and Balance Sheet Data) with black pill period headers and cyan row rules.
Raised full-year 2026 guidance: revenues $38.9B to $39.7B (previously $38.2B to $39.4B); non-GAAP EPS $22.90 to $23.70 (previously $22.30 to $23.50); non-GAAP tax rate unchanged at 15.0% to 16.5%; capital expenditures unchanged at about $2.6B.
Rounded outline card holding a two-column table comparing Current Guidance (black text) with Previous Guidance (greyed text) under black pill headers.
Divider slide opening the question-and-answer session.
Solid blue background with a large cyan outlined rounded shape framing the Q&A title and faded pill shapes along the bottom.
Divider slide introducing the appendix of GAAP to non-GAAP reconciliations.
Same blue framed design as the Q&A slide with the title Reconciliations.
Unaudited GAAP income statement in $ millions. Q3 2026 vs Q3 2025: product sales 9,883 vs 9,137; other revenues 482 vs 420; total revenues 10,365 vs 9,557; cost of sales 2,788 vs 3,082; R&D 2,111 vs 1,900; SG&A 1,680 vs 1,720; operating income 3,710 vs 2,526; net income 3,864 vs 3,216; diluted EPS $7.08 vs $5.93. Nine months: total revenues 29,037 vs 26,885; net income 8,058 vs 6,378; diluted EPS $14.79 vs $11.77.
Traditional financial statement layout: left-aligned title block, line items in the center, four numeric columns for three-month and nine-month periods with underlined subtotals.
Balance sheet in $ millions at September 30, 2026 (unaudited) vs December 31, 2025: cash and cash equivalents 13,190 vs 9,129; trade receivables 10,353 vs 9,570; inventories 6,389 vs 6,225; total current assets 34,363 vs 29,057; intangible assets 19,536 vs 22,276; goodwill 18,664 vs 18,680; total assets 96,048 vs 90,586; current portion of long-term debt 2,398 vs 4,599; long-term debt 51,609 vs 50,005; total stockholders' equity 14,352 vs 8,658; shares outstanding 541 vs 539 million.
Two-column accounting table with assets above liabilities and stockholders' equity, bold section labels and double-underlined totals.
Line-by-line reconciliation of cost of sales, R&D, SG&A, operating expenses, operating income, other income, income before taxes, tax provision and net income. Key Q3 2026 figures: acquisition-related cost of sales adjustment of (881); non-GAAP operating expenses 5,689 vs 5,252; non-GAAP operating income 4,676 vs 4,305 (47.3% vs 47.1% of product sales); net gains from equity investments of (1,465) removed from other income; non-GAAP tax rate 15.9% vs 18.2%; non-GAAP net income 3,520 vs 3,055. Small print is dense but legible at full resolution.
Two side-by-side dense reconciliation tables with dotted leader lines, each with three-month and nine-month columns; note that numbers may not add due to rounding.
Diluted EPS computation: Q3 2026 GAAP net income $3,864M and non-GAAP $3,520M on 546M shares, giving GAAP EPS $7.08 and non-GAAP EPS $6.45 (Q3 2025: $5.93 and $5.64 on 542M shares); nine months 2026 GAAP $14.79 and non-GAAP $17.88 (2025: $11.77 and $16.54). Footnotes a to f explain acquisition-related amortization, Horizon-related expenses, the prior-year Otezla intangible impairment, contingent consideration and legal items, and the tax effect of adjustments (25.9% and 13.1% for the 2026 three and nine months vs 44.0% and 16.9% a year earlier).
Four-column GAAP vs non-GAAP EPS table in two stacked blocks, followed by lettered footnotes across the lower third.
Cash flow in $ millions: Q3 2026 net cash from operating activities 4,241 vs 4,684; investing (649) vs (414); financing (4,391) vs (2,853); cash at end of period 13,190 vs 9,445. Free cash flow equals operating cash flow less capital expenditures of (587) vs (436): 3,654 vs 4,248 for the quarter and 8,620 vs 7,139 for the nine months.
Two stacked accounting tables (cash flow summary and free cash flow reconciliation), each with three-month and nine-month columns.
Full-year 2026 GAAP diluted EPS guidance of $18.34 to $19.28 plus acquisition-related expenses of $5.99 to $6.13, net gains from equity investments of ($1.70) and other $0.13 gives non-GAAP EPS guidance of $22.90 to $23.70; adjustments are net of about $0.70 per share of tax. GAAP tax rate guidance of 14.5% to 16.0% plus 0.5% gives a non-GAAP tax rate of 15.0% to 16.5%. GAAP guidance excludes future acquisitions, impairments, litigation and fair value changes.
Two reconciliation blocks (EPS guidance and tax rate guidance) with low-high range columns and explanatory notes between them.
Common questions about this slide and the underlying presentation content.
Amgen reported Q3 2026 total revenues of $10.4B, up 8% year over year, with product sales of $9.9B. Non-GAAP EPS was $6.45 (up 14%) and GAAP diluted EPS was $7.08. The non-GAAP operating margin was 47.3% of product sales, and free cash flow was $3.7B.
Yes. Slide 20 raises 2026 revenue guidance to $38.9B to $39.7B (from $38.2B to $39.4B) and non-GAAP EPS guidance to $22.90 to $23.70 (from $22.30 to $23.50). The non-GAAP tax rate (15.0% to 16.5%) and capital expenditures (about $2.6B) stayed the same.
The six key growth drivers grew 27% combined and made up more than 70% of product sales: TEZSPIRE +43%, EVENITY +39%, Repatha +37%, Biosimilars +26%, Rare Disease +21% and Innovative Oncology +21%. Amgen also says 17 products grew at least double digits.
Highlights include IMDELLTRA's overall survival benefit in first-line maintenance ES-SCLC (DeLLphi-305) and its U.S. approval for reduced monitoring, positive Phase 3 OASIZ 301 results for dazodalibep in Sjogren's disease, positive Phase 3 CROSSING results for TEZSPIRE in eosinophilic esophagitis, Phase 2 daxdilimab data in discoid lupus, and a new UPLIZNA Phase 3 in primary membranous nephropathy. Slide 11 maps the full Phase 3 pipeline, including MariTide.
It is the slide deck Amgen Inc. (NASDAQ: AMGN) presented on its Q3 2026 earnings call on November 3, 2026, published in the Investors section at investors.amgen.com. Amgen notes it contains forward-looking statements and that it does not undertake to update them.
Yes. Slides 22 to 28 contain the GAAP income statement, balance sheet, a line-by-line GAAP to non-GAAP reconciliation, the diluted EPS computation, the free cash flow reconciliation and the reconciliation of 2026 EPS and tax rate guidance.
Yes. The original 28-page PDF can be downloaded free from this page, and every slide is described above so you can find specific figures without opening the file.
It is a good structural reference: a cover, a one-slide summary, then commercial, R&D and financial sections, guidance, Q&A and a reconciliations appendix. The slides and brands belong to Amgen, so use the layout as inspiration and build your own version, for example with 2Slides.
Official source for Amgen earnings releases, presentations and SEC filings

Create Your Own Slides
Turn your ideas into professional presentations in seconds with 2slides AI.
Reference professional designs, choose your style, and generate slides with perfect text rendering. Powered by Nano Banana—start creating your presentation now.
Your AI Agent for slides. Save time, shine faster with intelligent presentation creation.


© 2026 2slides. All rights reserved.