
Part of Investor presentation examples · Australian investor presentation examples
Alkane Resources Investor Presentation November 2026 - a 39-slide deck from Alkane Resources (ASX:ALK, TSX:ALK, OTCQX:ALKRY), a gold and antimony miner, presented by Managing Director & CEO Nic Earner at the Swiss Mining Institute conference. It was lodged with the ASX (Australian Securities Exchange) as a company announcement. The deck covers the company's three producing mines (Tomingley and Costerfield in Australia, Björkdal in Sweden), FY2027 guidance (A$ figures are Australian dollars), the FY2027 Q1 actual results, exploration programs, the annual Mineral Resource and Ore Reserve update, Lupin reclamation, the Boda-Kaiser gold-copper project, and appendix reserve and resource tables.
Uses this deck’s cover as a style reference for slides made from your own content. Or pick any page below to use its layout as the reference.
Quick Navigation
Tags
Share the slides
Alkane Resources Investor Presentation November 2026 - a 39-slide deck from Alkane Resources (ASX:ALK, TSX:ALK, OTCQX:ALKRY), a gold and antimony miner, presented by Managing Director & CEO Nic Earner at the Swiss Mining Institute conference. It was lodged with the ASX (Australian Securities Exchange) as a company announcement. The deck covers the company's three producing mines (Tomingley and Costerfield in Australia, Björkdal in Sweden), FY2027 guidance (A$ figures are Australian dollars), the FY2027 Q1 actual results, exploration programs, the annual Mineral Resource and Ore Reserve update, Lupin reclamation, the Boda-Kaiser gold-copper project, and appendix reserve and resource tables.
Detailed view of each slide page, including layout, key content and visual elements.
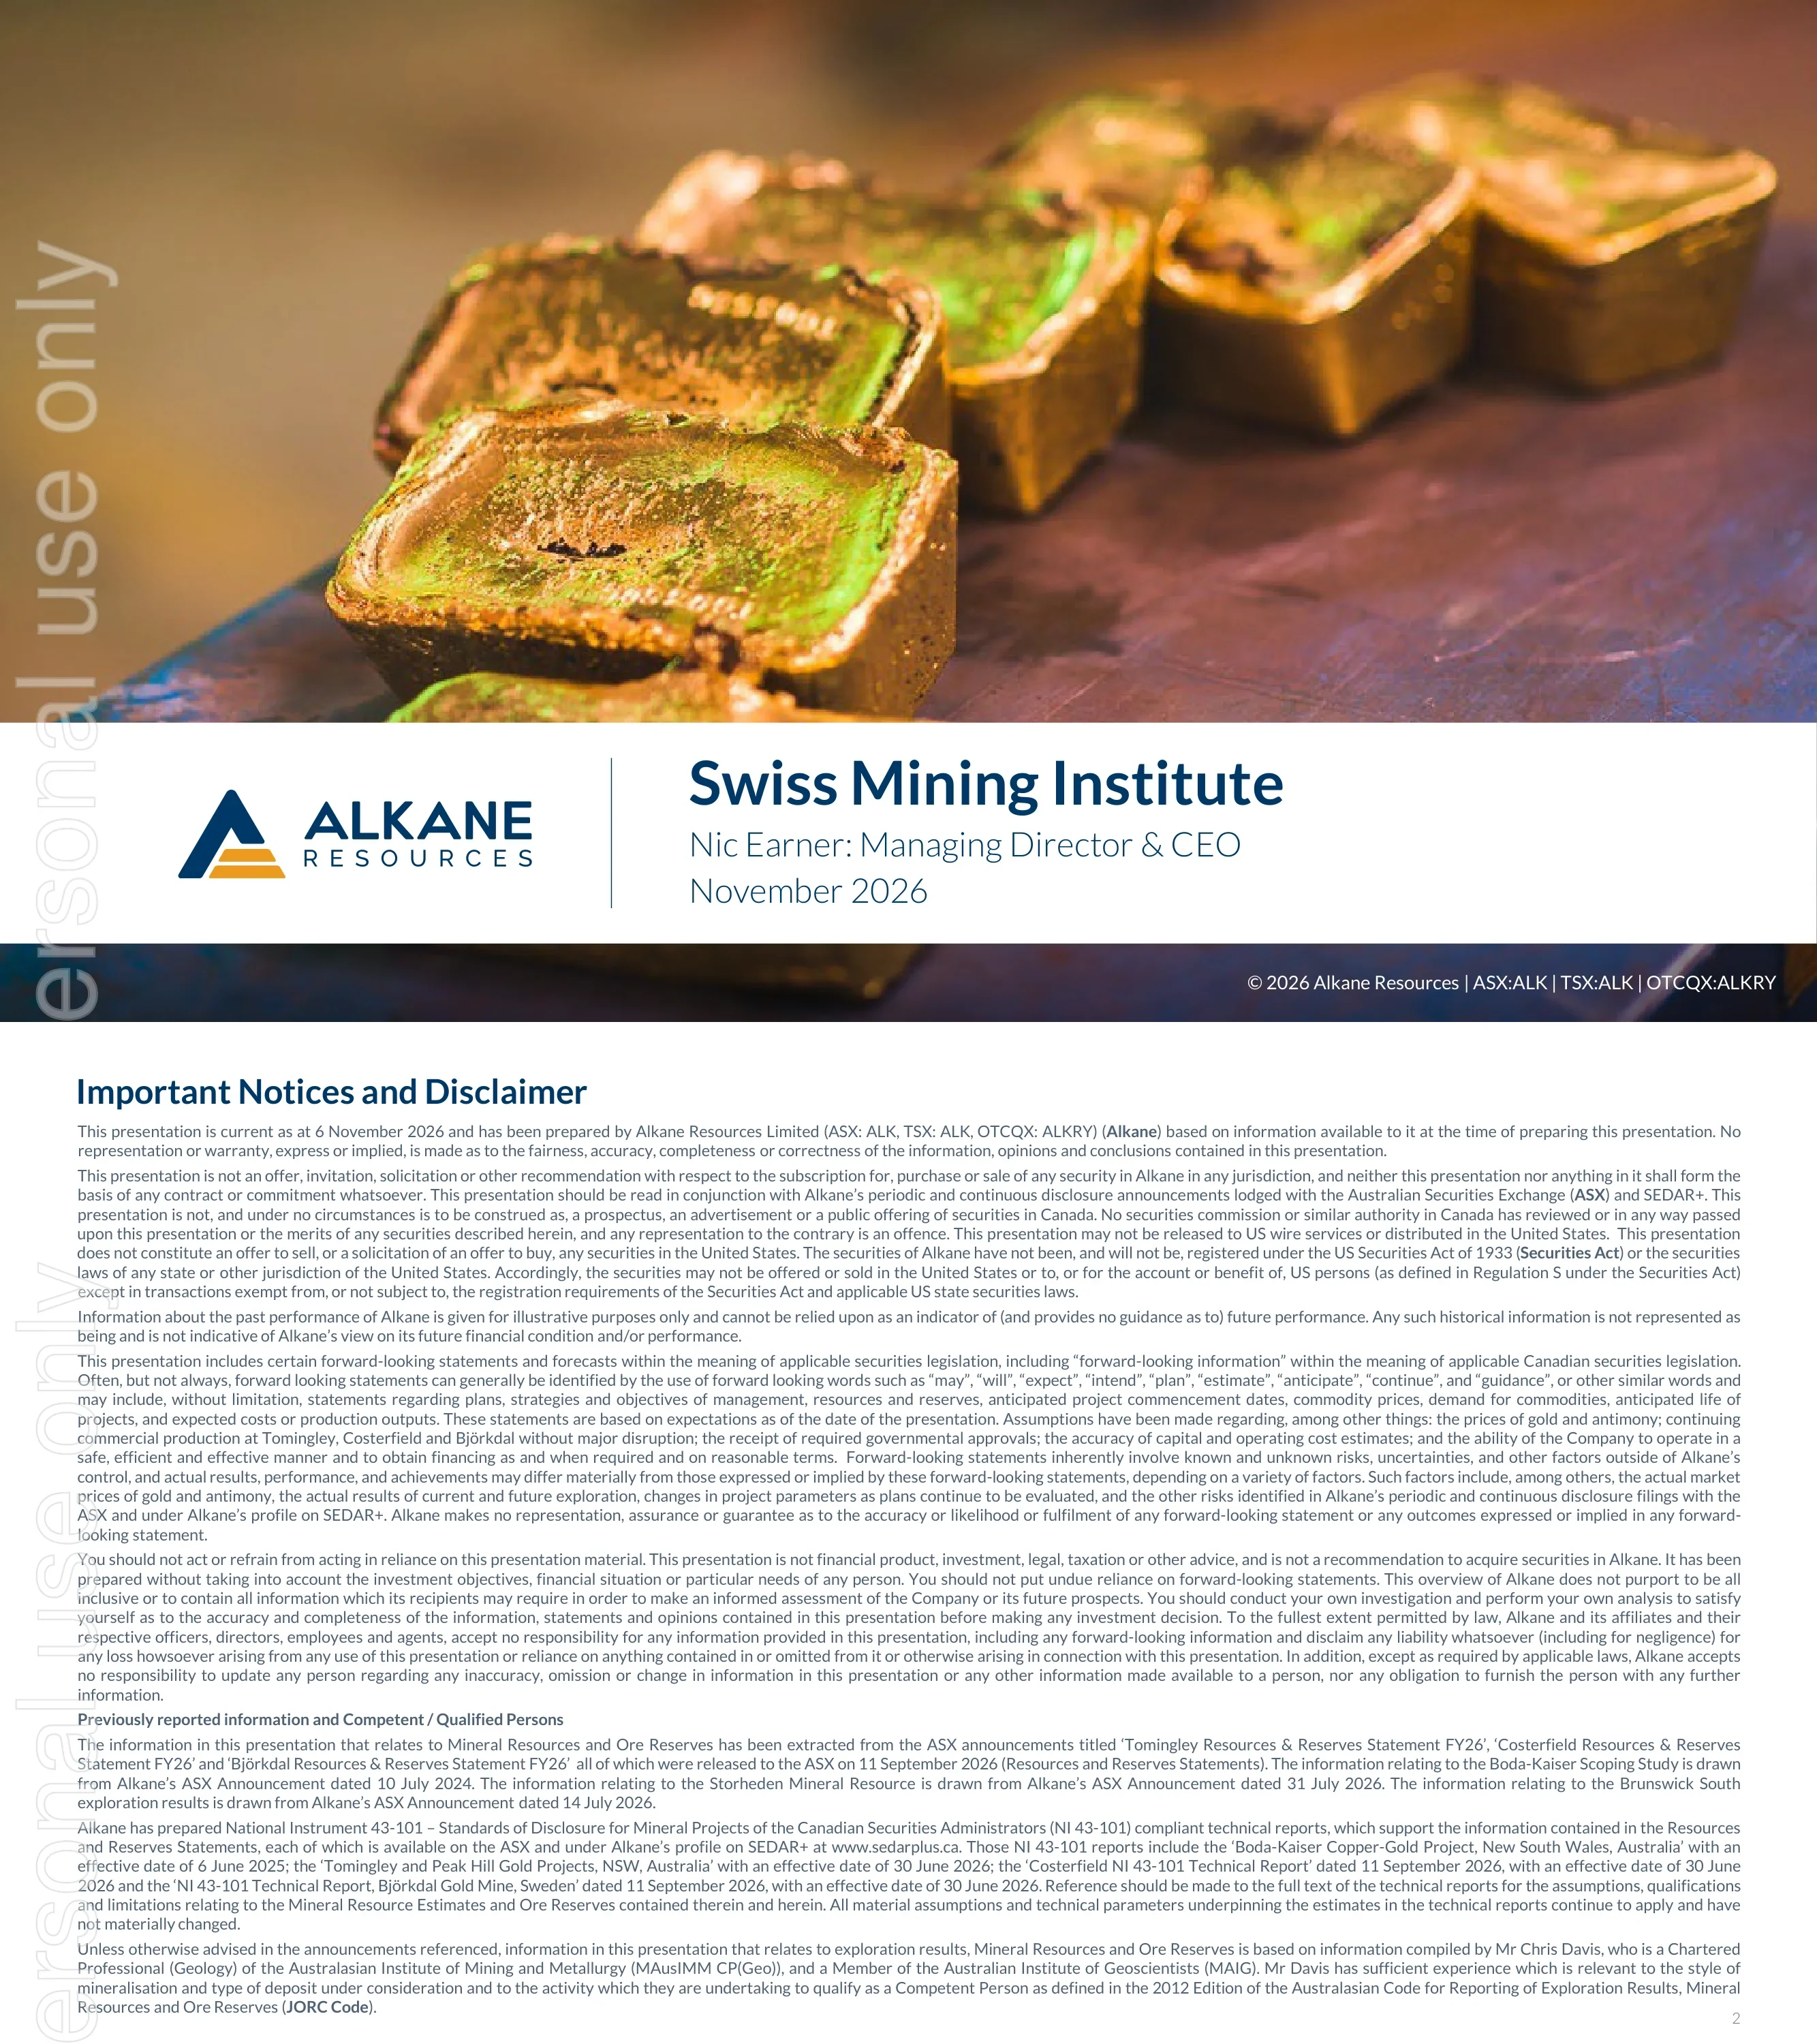
Title slide for the Swiss Mining Institute presentation by Nic Earner, Managing Director & CEO of Alkane Resources, dated November 2026. The footer shows the tickers ASX:ALK, TSX:ALK and OTCQX:ALKRY.
Full-bleed photo of gold bars with a white banner holding the Alkane logo on the left and the title, presenter and date on the right.
States the presentation is current as at 6 November 2026, is not an offer of securities, includes forward-looking statements and is not financial advice. Also sets out previously reported information sources (ASX announcements of 11 September 2026 for the Resources & Reserves Statements, 10 July 2024 for Boda-Kaiser, 31 July 2026 for Storheden, 14 July 2026 for Brunswick South) and names Mr Chris Davis as Competent Person.
Single dense text page with a bold heading and justified paragraphs; no graphics.
Continues the disclaimer with the NI 43-101 qualified person statement, non-IFRS measures (all-in sustaining costs), the gold equivalent (AuEq) formula using a 70% antimony payability, Mineral Resources and Ore Reserves cautions, the Boda-Kaiser Scoping Study caution, Canadian continuous disclosure, third party information, and a currency note that dollar figures are Australian dollars (A$) unless otherwise stated.
Single dense text page with bold sub-headings for each disclosure topic.
Company snapshot: FY26 production of 83koz Au at Tomingley, 45koz AuEq at Costerfield and 41koz Au at Björkdal, plus Boda-Kaiser M&I Resources of ~9.8Moz AuEq. Capital structure at 6 November 2026 shows 1,366.2 million shares, A$1.73 / US$1.21 share price, A$2,364m market cap, ~A$440m cash and gold bullion, A$110m undrawn revolving facility, ~A$550m total liquidity and ~A$1,940m enterprise value. Broker coverage logos are listed.
Left: two maps (New South Wales/Victoria and Sweden) with mine call-out boxes. Right: capital structure table above a grid of broker logos. Numbered footnotes at the bottom.
Consolidated FY2027 guidance: gold produced 156-168 koz, antimony produced 1,200-1,500 tonnes (Costerfield only), gold equivalent produced 163-177 koz. All-in sustaining costs A$2,900-3,200/AuEq oz (US$2,030-2,240), growth capital A$160-190 million, exploration A$45-53 million, Boda/Kaiser & other exploration A$10-12 million, total A$215-255 million (US$151-179 million). Per-site columns are given for Tomingley, Costerfield and Björkdal.
Two stacked tables (production, then costs and capital) with site columns and a consolidated column, plus two photos at right and footnotes below.
September-quarter actuals: consolidated gold produced 39.8 koz, antimony 396 tonnes, gold equivalent 40.7 koz; all-in sustaining cost A$2,805/AuEq oz (US$1,964). Growth capital A$37 million, exploration A$9 million, Boda/Kaiser & other exploration A$4 million, total A$50 million (US$35 million). Per-site AISC in A$ is Tomingley 2,340, Costerfield 3,194 and Björkdal 3,012.
Same layout as the guidance slide, with actual figures in place of ranges.
Section divider titled 'Tomingley (Australia)' with the tagline 'High-performing gold mine positioned for growth'.
Full-bleed aerial photo with a white title banner across the lower third.
Underground mining at Roswell and Caloma 1 and 2 with a future open pit at San Antonio; 1M tpa plant with run-rate at +1.3M tpa; saleable product is gold doré. Reserves P&P 0.641 Moz (11.40 Mt @ 1.7 g/t Au); Resources M&I 1.184 Moz (17.30 Mt @ 2.1 g/t) and Inferred 0.304 Moz (4.55 Mt @ 2.1 g/t). Production: FY2025 70.1 koz Au, FY2026 83.0 koz Au, FY2027 guidance 78 to 84 koz Au.
Left: fact table and four bullets (owner operator, deposits open at depth, highway underway, regional targets). Right: site map with legend and scale bar. Footnotes at bottom.
A 3D view of Tomingley orebodies with seven numbered targets: Macleans Extension, Roswell Extensions (mining dependent on gold price), SAR Drilling (drill program completed, interpreting results), Roswell Western Monzodiorite (infill drilling Q3), Caloma North-East (drilling Q4), Wyoming 3 and San Antonio Grade Control (drilling campaign Q3).
Top: wide 3D orebody image over satellite imagery with numbered markers. Bottom: seven-item legend in two panels.
Six numbered targets: Tomingley One and Two (drilling completed, interpreting results), El Paso (~5,400 m diamond program completed, assays pending), Peak Hill (1.65 km hole results released, preparation for 6,600 m follow-up drilling), Glen Isla (drilling completed; extensive AC program being prepared), Patons (RC drilling in Q1) and 2D seismic (completion planned in current quarter).
Left: numbered text list. Right: colour-coded geological map with numbered markers and an ML boundary outline.
Photo slide showing realigned Newell Highway road works and a bridge under construction, with the headline forecast of April 2027 completion. No numeric data besides the date.
Three-photo collage: two stacked aerial road photos on the left, one large bridge construction photo on the right.
Opportunity box: 108 koz Inferred Resource (1.02 Mt at 3.29 g/t, 2 g/t cut-off); concept work at lower cut-offs suggests a larger bulk target (conceptual only); deep drilling shows the system extends ~1 km below the pit. Timeline: Q4 2026 start 6-hole ~6,600m follow-up drilling and scoping study; Q1 2027 scoping study complete; 2027+ if scoping supports, resource update, studies and pre-feasibility scope.
Top: navy callout box and pit photo. Middle: three-point timeline. Bottom: three grey content cards.
Section divider for Costerfield with the tagline 'One of the world's highest-grade gold and antimony mines'.
Full-bleed aerial photo with a white title banner.
Underground at Youle and Shepherd; gold gravity and gold-antimony concentrate; 150,000 tpa processing. Reserves 0.170 Moz Au | 15 kt Sb | 0.276 Moz AuEq (0.960 Mt @ 5.5 g/t Au and 1.6% Sb); Resources (MI) 0.387 Moz Au | 42 kt Sb | 0.664 Moz AuEq (1.993 Mt @ 6.0 g/t Au and 2.1% Sb). Production: FY2025 49.4 koz AuEq, FY2026 44.5 koz AuEq, FY2027 guidance 44 to 48 koz AuEq. Earn-in JV with Nagambie, 40km ENE of Costerfield.
Left: fact table and bullets. Right: licence map with corridors, legend and scale. Long footnotes at bottom.
3D view of Costerfield orebodies and workings with three highlighted areas: Brunswick South (potential western structure, further drilling underway), Cuffley-Augusta (potential for small ore Reserve extensions) and Kendall (southern upper extension complete, northern extension to commence in Q3). A potential underground access to True Blue is shown.
Large 3D model graphic on top, three numbered text panels along the bottom.
Targeted regional testing has ramped up with improved ground conditions: Northern Dykes, Browns Corridor and Margarets (drilling underway) and True Blue Step-out (drilling to commence in Q2 along the 4km target). Callouts note 4+km of shallow workings at True Blue, 2.5km at Brown's, 6km at the Central Corridor and 4km at Antimony Creek.
Left: four numbered items. Right: satellite map with dashed corridor outlines and callout boxes.
High-grade zones largely confirmed with additional wider zones, depth and strike extensions confirmed on C2, additional trend to the west (C3), and two rigs on site. October release highlights include 3.3g/t gold and 0.7% antimony over 10.6m in ADD001, and 0.6g/t gold and 0.8% antimony over 22.6m in ADD013.
Left: bullets and an assay highlights panel. Right: long-section style 3D drill image with many intercept labels (very small text).
Section divider for Björkdal with the tagline 'Long life underground and open cut gold mine'.
Full-bleed aerial photo of the open cut with a white title banner.
Underground and open pit mining, gold concentrate product, 1.4M tpa processing. Reserves 0.56 Moz Au (13.1 Mt @ 1.33 g/t Au); Resources (MI) 1.50 Moz Au (22.5 Mt @ 2.07 g/t Au). Production: FY2025 41.4 koz, FY2026 40.8 koz, FY2027 guidance 41 to 45 koz Au. Open cut commenced at Nylunds; resource expansion at Storheden (~700m from main system).
Left: fact table and four bullets. Right: licence map with legend (mining concessions, resources, prospects, exploration permit).
Four numbered work areas: Eastern Extension (drilling covered the planned ramp position), North Zone (focus on upper limits below the marble horizon; new drill sites), Skarn (test down plunge extension of the recently discovered workshop Skarn) and Storheden Drilling (commenced in Q2 after the FY26 resource extension). A colour scale for gold grade (0.5 to 5 g/t) is shown.
Left: numbered text plus a small cross-section A-A'. Right: large 3D long projection of orebodies with a grade legend.
Regional drilling is planned to start in early 2027, after Storheden Extension and Infill drilling. Six targets: Norrberget, Storheden North, Lillträskbäcken, Rönnberget, Sandliden and Aspliden.
Left: headline and six numbered target descriptions. Right: oblique geological map with numbered markers and scale bar.
Photo slide of the tailings dam and the Storheden site, including a tunnel portal. No numeric data.
Three-photo collage: two stacked photos at left, one large photo at right.
Section divider titled 'Reserve Growth' with the tagline 'Growth all round'.
Full-bleed sunset photo of a processing plant with a white title banner.
Group Ore Reserves up 6.2% net of depletion (P&P = 1.37 Moz Au + 15 kt Sb); Group Mineral Resources up 7.8% net of depletion for producing assets (M&I = 8.64 Moz Au + 1.01 Mt Cu + 42.0 kt Sb; Inferred = 3.76 Moz Au + 0.45 Mt Cu + 12.9 kt Sb). The Ore Reserve Growth waterfall (AuEq koz) runs from 543 + 620 + 232 at June 30 2025, minus 192 depleted, plus 65 (Björkdal), 116 (Tomingley) and 96 (Costerfield), to 563 + 641 + 276 at June 30 2026.
Left: two headline sections with orange arrow callouts and bullets. Right: stacked waterfall bar chart with value labels, footnotes below.
Section divider for the Lupin Gold Mine with the tagline 'Reclamation & opportunity'.
Full-bleed arctic landscape photo with a white title banner.
Located in the Kitikmeot Region, Nunavut; nearest community is Kugluktuk, ~285km to the NW; nearest all-season road and airstrip is at Yellowknife; access is fly-in year-round and a winter road for heavy haul.
Left: four bullets. Centre: regional map with Canada inset. Right: two winter road photos.
Reclamation spend: ~$30m spent to date (through 2026), ~$7m forecast for 2027 (on-site works and indirects) and ~$11m forecast for 2028 (includes winter road and demob). Before (September 20, 2025) and after (October 4, 2026) aerial photos are compared. Currency is shown as $ on the slide; the deck's currency note says dollars are A$ unless stated.
Top: three stat cards. Bottom: two large before/after photos with date captions.
Section divider for Boda-Kaiser with the tagline 'Large-scale development project'.
Full-bleed photo of drill rig workers with a white title banner.
14.7 Moz AuEq in Resources, ~65% in Indicated category. July 2024 Scoping Study (Au = A$3,500/oz, Cu = A$15,000/t): 20 Mtpa throughput, 17+ years life of mine, 35 kt/annum copper and ~159 koz Au/annum in the first 5 years, A$4.3B 10-year pre-tax free cash flow, ~A$630/oz Au AISC (including Cu by-product), A$1.8B pre-production capex and 24% IRR. Over LOM: 2,057,000 oz gold and 413,000 tonnes copper. States that current gold and copper prices are much higher.
Left: header banner and a 2-column grid of eight icon metric tiles. Right: grey panel with bullets. Footnotes at the bottom.
Gantt-style timeline from 2025 to 2033: stakeholder consultation, environmental studies, property negotiations, site selection and infrastructure negotiations run from 2025 into 2027; pre-feasibility study at the end of that period; project approvals about 2027-2029; bankable feasibility study and financing & final investment decision about 2029-2031; construction & commissioning about 2031-2033. Footnote: indicative only, subject to outcomes, approvals, funding and a Final Investment Decision.
Nine year columns with horizontal navy bars over a faded field photo.
Seven management objectives: deliver on production; seek to expand Mineral Resources at all three mine sites; complete the Newell Highway project; progress the Storheden development; complete a pre-feasibility study for Boda-Kaiser; continue to evaluate sensible and accretive corporate investment; position for continued shareholder capital returns. A footnote says these are objectives, not forecasts, and capital returns remain subject to Board determination.
Seven large bullets with bold key phrases and an italic disclaimer footnote.
Closing slide listing ASX: ALK, TSX: ALK and OTCQX: ALKRY, with investor contact details (Corporate Communications Manager), the website alkres.com and social handles on LinkedIn and X.
Drill core photo background with a white panel: tickers on the left, contact block on the right.
Appendix section divider introducing the reserves and resources statements.
Full-bleed photo of a geologist's hammer with a white title banner.
Tomingley Mineral Resources at 30 June 2026 by deposit with Measured, Indicated, Total M&I and Inferred columns. Total M&I is 17,302 kt at 2.1 g/t for 1,184 koz; Inferred is 3,539 kt at 1.7 g/t for 196 koz. San Antonio open pit is 347 koz M&I; Roswell is 444 koz M&I.
Wide resource table grouped by cut-off (open pit 0.4 g/t, underground 1.3 and 0.9 g/t) with subtotals and a navy total row; numbered notes to the right.
Tomingley Ore Reserves at 30 June 2026: total 11,401 kt at 1.7 g/t for 641 koz (Proved 3,827 kt, Probable 7,573 kt). San Antonio open pit is 214 koz and Roswell is 333 koz. Peak Hill Mineral Resource is Inferred, 1.02 Mt at 3.29 g/t Au for 108 koz with 0.15% copper.
Two stacked tables (Ore Reserves; Peak Hill Mineral Resources) with notes to the right.
Costerfield Mineral Resources at 30 June 2026: Measured + Indicated 1,993 kt at 6.0 g/t Au and 2.1% Sb for 387 koz gold and 42.0 kt antimony; Inferred 969 kt, 111 koz and 12.9 kt. Ore Reserves: Proved + Probable 960 kt at 5.5 g/t Au and 1.6% Sb for 170 koz and 15.0 kt antimony.
Two stacked tables with detailed notes for resources and reserves at right.
Björkdal Mineral Resources at 30 June 2026: total Measured + Indicated 22,474 kt at 2.07 g/t for 1,497 koz; Inferred 12,096 kt at 1.57 g/t for 611 koz. Indicated Björkdal underground is 1,058 koz and Storheden underground is 87 koz indicated and 125 koz inferred.
Single table by category and area with subtotals; 17 notes at right.
Björkdal Ore Reserves at 30 June 2026: Proven 1,155 kt at 1.63 g/t for 61 koz; Probable 11,966 kt at 1.30 g/t for 502 koz; Total Proven + Probable 13,121 kt at 1.33 g/t for 563 koz.
Single table by Proven/Probable with notes at the right and white space below.
Boda-Kaiser Mineral Resources: total 796 Mt at 0.58 g/t AuEq (0.33 g/t Au, 0.18% Cu) containing 14.7 Moz AuEq, 8.28 Moz Au and 1.46 Mt Cu. Open pittable sub-total is 7.59 Moz AuEq (0.3 g/t AuEq cut-off) and underground sub-total is 7.09 Moz AuEq (0.4 g/t AuEq cut-off).
Wide table with Indicated, Inferred, Total and Metal column groups, by Boda and Kaiser, with a footnote on the AuEq formula.
Common questions about this slide and the underlying presentation content.
It is a 39-slide investor deck presented by Managing Director & CEO Nic Earner at the Swiss Mining Institute conference in November 2026. Alkane Resources (ASX:ALK, TSX:ALK, OTCQX:ALKRY) lodged it with the ASX (Australian Securities Exchange) as a company announcement. The ASX cover letter has been removed from this version, and the disclaimer states the information is current as at 6 November 2026.
Slide 5 gives consolidated FY2027 guidance of 156-168 koz gold produced, 1,200-1,500 tonnes antimony produced (Costerfield only) and 163-177 koz gold equivalent produced. By site, gold is 78-84 koz at Tomingley, 37-39 koz at Costerfield and 41-45 koz at Björkdal. All-in sustaining cost guidance is A$2,900-3,200 per AuEq oz (A$ means Australian dollars), or US$2,030-2,240.
Slide 6 reports September-quarter actuals of 39.8 koz gold, 396 tonnes antimony and 40.7 koz gold equivalent, with a consolidated all-in sustaining cost of A$2,805 per AuEq oz (US$1,964). Growth capital was A$37 million, exploration A$9 million and Boda/Kaiser & other exploration A$4 million, for a total of A$50 million (US$35 million).
The deck covers three producing mines: Tomingley in New South Wales (gold doré, 1M tpa plant), Costerfield in Victoria (gold and antimony, 150,000 tpa processing) and Björkdal in Sweden (gold concentrate, 1.4M tpa processing). It also covers the Lupin gold mine in Nunavut, Canada (reclamation) and the Boda-Kaiser gold-copper project in New South Wales (development).
Slide 29 shows 14.7 Moz AuEq in Resources, about 65% in the Indicated category, and the July 2024 Scoping Study metrics: 20 Mtpa throughput, 17+ years life of mine, A$4.3B 10-year pre-tax free cash flow, A$1.8B pre-production capex and 24% IRR, based on gold at A$3,500/oz and copper at A$15,000/t. The deck notes the Scoping Study is preliminary and that funding has not been secured. Slide 31 lists completing a pre-feasibility study as a next-12-months objective.
Australia's financial year runs from July to June, so FY26 covers July 2025 to June 2026 and FY2027 covers July 2026 to June 2027. That is why the 'FY2027 Q1 Actual' slide reports the September 2026 quarter, and why the resource and reserve statements are dated 30 June 2026.
Slide 24 states Group Ore Reserves grew 6.2% net of depletion and Group Mineral Resources grew 7.8% net of depletion for producing assets. The Ore Reserve chart (AuEq, koz) shows 543, 620 and 232 koz for Björkdal, Tomingley and Costerfield at June 30 2025, 192 koz depleted through production, additions of 65, 116 and 96 koz, and 563, 641 and 276 koz at June 30 2026. Detailed statements by site are in the appendix, slides 34-39.
Yes as a layout reference. It shows a typical resource-company structure: title slide, two-page disclaimer, company snapshot with capital structure, guidance and actuals tables, per-asset fact sheets with maps, exploration diagrams, a reserve growth chart, a development project summary, an objectives slide and appendix resource tables. Use it for structure only, as the content and figures belong to Alkane and the deck carries its own disclaimers.

Create Your Own Slides
Turn your ideas into professional presentations in seconds with 2slides AI.
Reference professional designs, choose your style, and generate slides with perfect text rendering. Powered by Nano Banana—start creating your presentation now.
Your AI Agent for slides. Save time, shine faster with intelligent presentation creation.


© 2026 2slides. All rights reserved.