
2025 State of Crypto Holders Report - Comprehensive Survey of U.S. Cryptocurrency Owners
Quick Navigation
Tags
Share the slides
2025 State of Crypto Holders Report - Comprehensive Survey of U.S. Cryptocurrency Owners
Detailed view of each slide page, including layout, key content and visual elements.
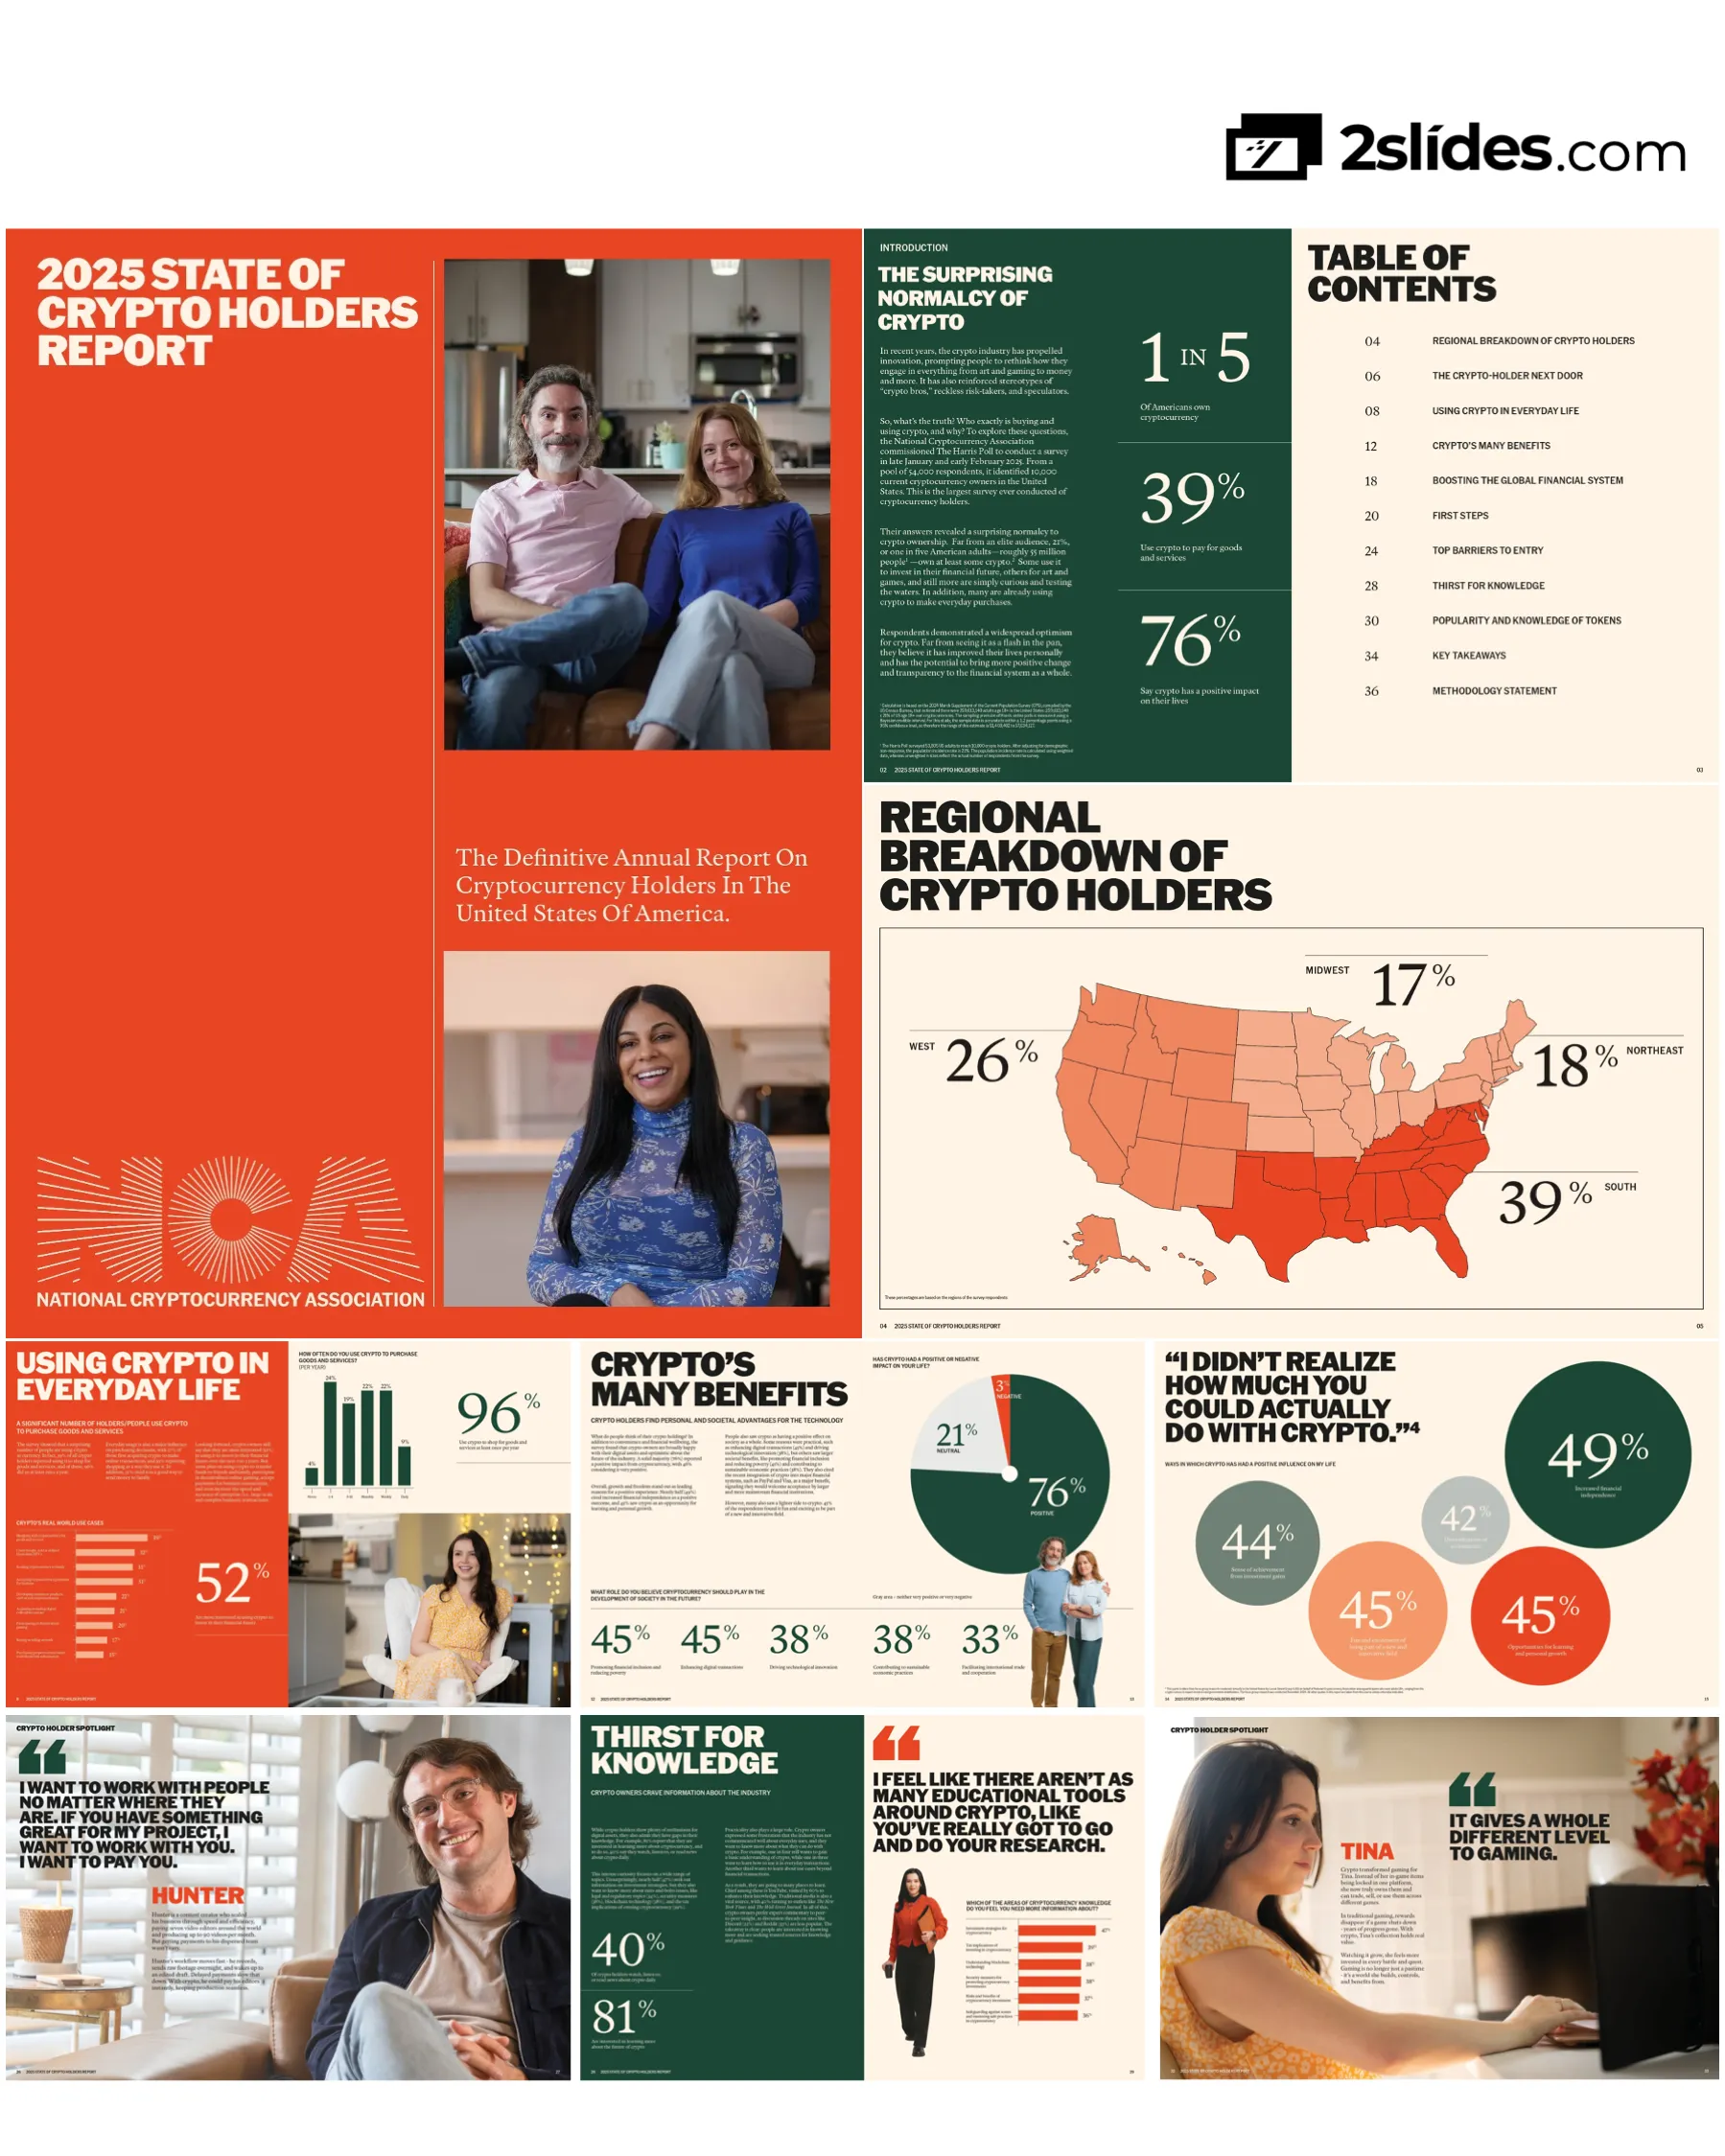
Title page featuring report name and subtitle describing it as 'The Definitive Annual Report On Cryptocurrency Holders In The United States Of America' with lifestyle photography
Bold orange title block on left side, two lifestyle photos on right showing diverse crypto holders in home settings
Executive summary revealing 21% (1 in 5) American adults own crypto, challenging stereotypes. Survey of 10,000 holders shows surprising normalcy, with 39% using crypto for purchases and 76% reporting positive life impact
Two-page spread with introduction on left (dark green background) and table of contents on right (cream background), featuring key statistics in large typography
Geographic distribution showing South leads with 39%, West 26%, Northeast 18%, Midwest 17%
Full-page heat map of United States with regional percentages overlaid, darker shading indicates higher concentration
Detailed demographic breakdown showing diversity: 67% male, 31% female; 67% under 45 but 15% over 55; 26% earn under $75K annually; 55% hold less than $10K in crypto. Top industries: Technology 14%, Construction 12%, Finance 7%
Multi-panel layout with pie charts showing age, income, crypto holdings value, and gender distribution, plus text explanation and industry breakdown
39% use crypto to purchase goods/services, 96% of those do so at least once yearly. Other uses: shopping (39%), NFTs (32%), sending to family (31%), business payments (31%). 52% most interested in investing for financial future
Left side features text and bar chart of use cases; right side shows frequency chart and lifestyle photo of woman using laptop at home
Personal story of parents exploring crypto as accessible way to diversify and prepare for future, fascinated by global spending/saving applications
Full-page lifestyle photo with family on left, large pull quote on right with narrative text below
76% report positive impact (46% very positive), with 49% citing financial independence and 45% personal growth. Societal benefits: financial inclusion (45%), digital transactions (45%), technological innovation (38%), sustainability (38%)
Two-page spread with narrative text on left and large pie chart on right showing 76% positive, 21% neutral, 3% negative sentiment
Detailed breakdown showing 49% increased financial independence, 45% learning opportunities and fun/excitement, 44% sense of achievement, 42% diversification. Focus group quote about discovering crypto's versatility
Large pull quote at top, circular bubble chart showing five key benefits with varying sizes
Artist's story about using blockchain for permanent ownership records, automatic earnings splits for collaborators, and lasting impact beyond lifetime
Full-page lifestyle photo of artist in studio on left, large quote and narrative text on right
76% trust crypto equal to or more than traditional banking. Benefits: reduce costs/fees (45%), enhance transparency/security (44%), increase transaction speed (44%). 73% want U.S. to lead globally, 64% support regulation, 67% concerned about over-regulation
Text narrative with embedded statistics on left, large percentage callouts (73%, 64%, 67%) and horizontal bar chart on right
Top motivations: investment (60%), curiosity (50%), recommendations (36%). Triggers for first purchase: family/friends (43%), blockchain interest (38%), financial news (36%). 56% acquired crypto between 2020-2025
Bar chart showing acquisition reasons on left, detailed trigger factors listed with percentages on right, large percentage callouts at bottom
Nonprofit fundraiser using crypto for Movember to access new donors, improve transparency and accessibility, tap into blockchain movement of crypto donors
Large quote at top, narrative text on left, professional portrait on right
While 75% concerned about security, only 3% experienced negative effects. Main barriers: lack of funds (15%), volatility fears (15%), security concerns (13%). Of negative experiences: 48% market losses, 32% understanding difficulty and fraud
Text explanation with horizontal bar charts showing obstacles and concerns, lifestyle photo on right
Content creator using crypto to instantly pay seven global video editors, enabling 90 videos/month production with seamless workflow
Large quote on left, photo on right, narrative text below quote
81% interested in learning more, 40% consume crypto news daily. Top learning needs: investment strategies (47%), tax implications (39%), blockchain technology (38%), security measures (38%). Primary sources: YouTube (60%), traditional media (40%)
Two-page spread with large statistics and quote on left, bar chart of knowledge needs on right
Token awareness and usage: BTC (99% aware, 85% used), ETH (91%/58%), DOGE (91%/48%), USDC (87%/44%), SOL (74%/28%), XRP (67%/23%). Includes descriptions of each token's purpose
Side-by-side bar charts comparing awareness vs. acquisition/use, with token descriptions in colored boxes
Gamer explaining how crypto enables true ownership of in-game items, cross-platform trading, and lasting value even if games shut down
Large photo of gamer on left, quote and narrative on right
Six main findings: (1) Wide demographic adoption - 1 in 5 Americans; (2) Everyday use tool - 39% shopping; (3) Positive future outlook; (4) Low actual security incidents; (5) Strong learning desire; (6) Overall positive experience
Six numbered sections in grid layout with orange background, professional portrait on right
Research conducted by Harris Poll, January 22-February 3, 2025, among 10,000 crypto holders. Data weighted by demographics. Sampling precision ±1.2 percentage points at 95% confidence level. Quotes from LSG focus groups November 2024
Two-page spread with methodology details on left, large stylized '10,000' text on right
Blank page
Empty page
Common questions about this slide and the underlying presentation content.
This is the largest survey ever conducted of cryptocurrency holders, with 10,000 current crypto owners identified from a pool of 54,000 respondents. The research was conducted by The Harris Poll in January-February 2025 with a sampling precision of ±1.2 percentage points at 95% confidence level, making it the most comprehensive and statistically robust study of U.S. crypto holders available.
The report reveals surprising diversity: 21% (1 in 5) of American adults own crypto, representing roughly 55 million people. Demographics span all ages (though 67% are under 45, 15% are over 55), income levels (26% earn under $75K annually), and industries (14% technology, 12% construction, 7% finance). Gender split is 67% male, 31% female. Most holders (55%) own less than $10,000 worth, challenging elite investor stereotypes.
Yes, 39% of crypto holders use it to purchase goods and services, with 96% of those doing so at least once per year. Beyond shopping, users send money to family (31%), accept business payments (31%), trade NFTs (32%), and participate in gaming. Looking forward, 52% are most interested in using crypto to invest in their financial future, but significant percentages plan to use it for transfers, gaming, and business transactions.
While 75% express concern about scams and security (with 13% citing it as the top barrier to acquiring more), only 3% of crypto owners reported any negative experiences. Of those few negative experiences, 32% involved fraud or security breaches personally. Meanwhile, 35% listed the security of having decentralized assets as a positive impact on their lives, suggesting concern doesn't match reality.
Overwhelmingly positive: 76% report cryptocurrency has had a positive impact on their lives (46% very positive), with only 3% negative and 21% neutral. Key benefits include increased financial independence (49%), learning opportunities (45%), fun and excitement (45%), sense of achievement (44%), and investment diversification (42%).
81% are interested in learning more about cryptocurrency, with 40% consuming crypto news daily. Top learning priorities include investment strategies (47%), tax implications (39%), blockchain technology (38%), and security measures (38%). They prefer trusted expert sources like YouTube (60%) and traditional media outlets like NYT and WSJ (40%) over peer forums like Reddit (33%) or Discord (22%).
No single barrier dominates. Top obstacles include lack of funds to acquire more (15%), fear of volatility (15%), security concerns (13%), uncertainty about tax implications (10%), lack of businesses accepting crypto (9%), and lack of public understanding (8%). This suggests a broad range of practical concerns rather than one major dealbreaker.
Strong support for balanced approach: 73% want the U.S. to become the global leader in crypto, and 64% believe government regulation is important. However, 67% are concerned about regulations threatening innovation. Holders trust crypto equal to or more than traditional banking (76%) and see it as a way to reduce costs (45%), enhance transparency (44%), and increase transaction speed (44%).

Create Your Own Slides
Turn your ideas into professional presentations in seconds with 2slides AI.
Reference professional designs, choose your style, and generate slides with perfect text rendering. Powered by Nano Banana—start creating your presentation now.
Your AI Agent for slides. Save time, shine faster with intelligent presentation creation.




© 2026 2slides. All rights reserved.