
Part of Investor presentation examples
UBS Group third quarter 2026 (3Q26) financial results investor presentation, 28 October 2026, filed with the SEC as an exhibit to Form 6-K
Uses this deck’s cover as a style reference for slides made from your own content. Or pick any page below to use its layout as the reference.
Quick Navigation
Tags
Share the slides
UBS Group third quarter 2026 (3Q26) financial results investor presentation, 28 October 2026, filed with the SEC as an exhibit to Form 6-K
Detailed view of each slide page, including layout, key content and visual elements.
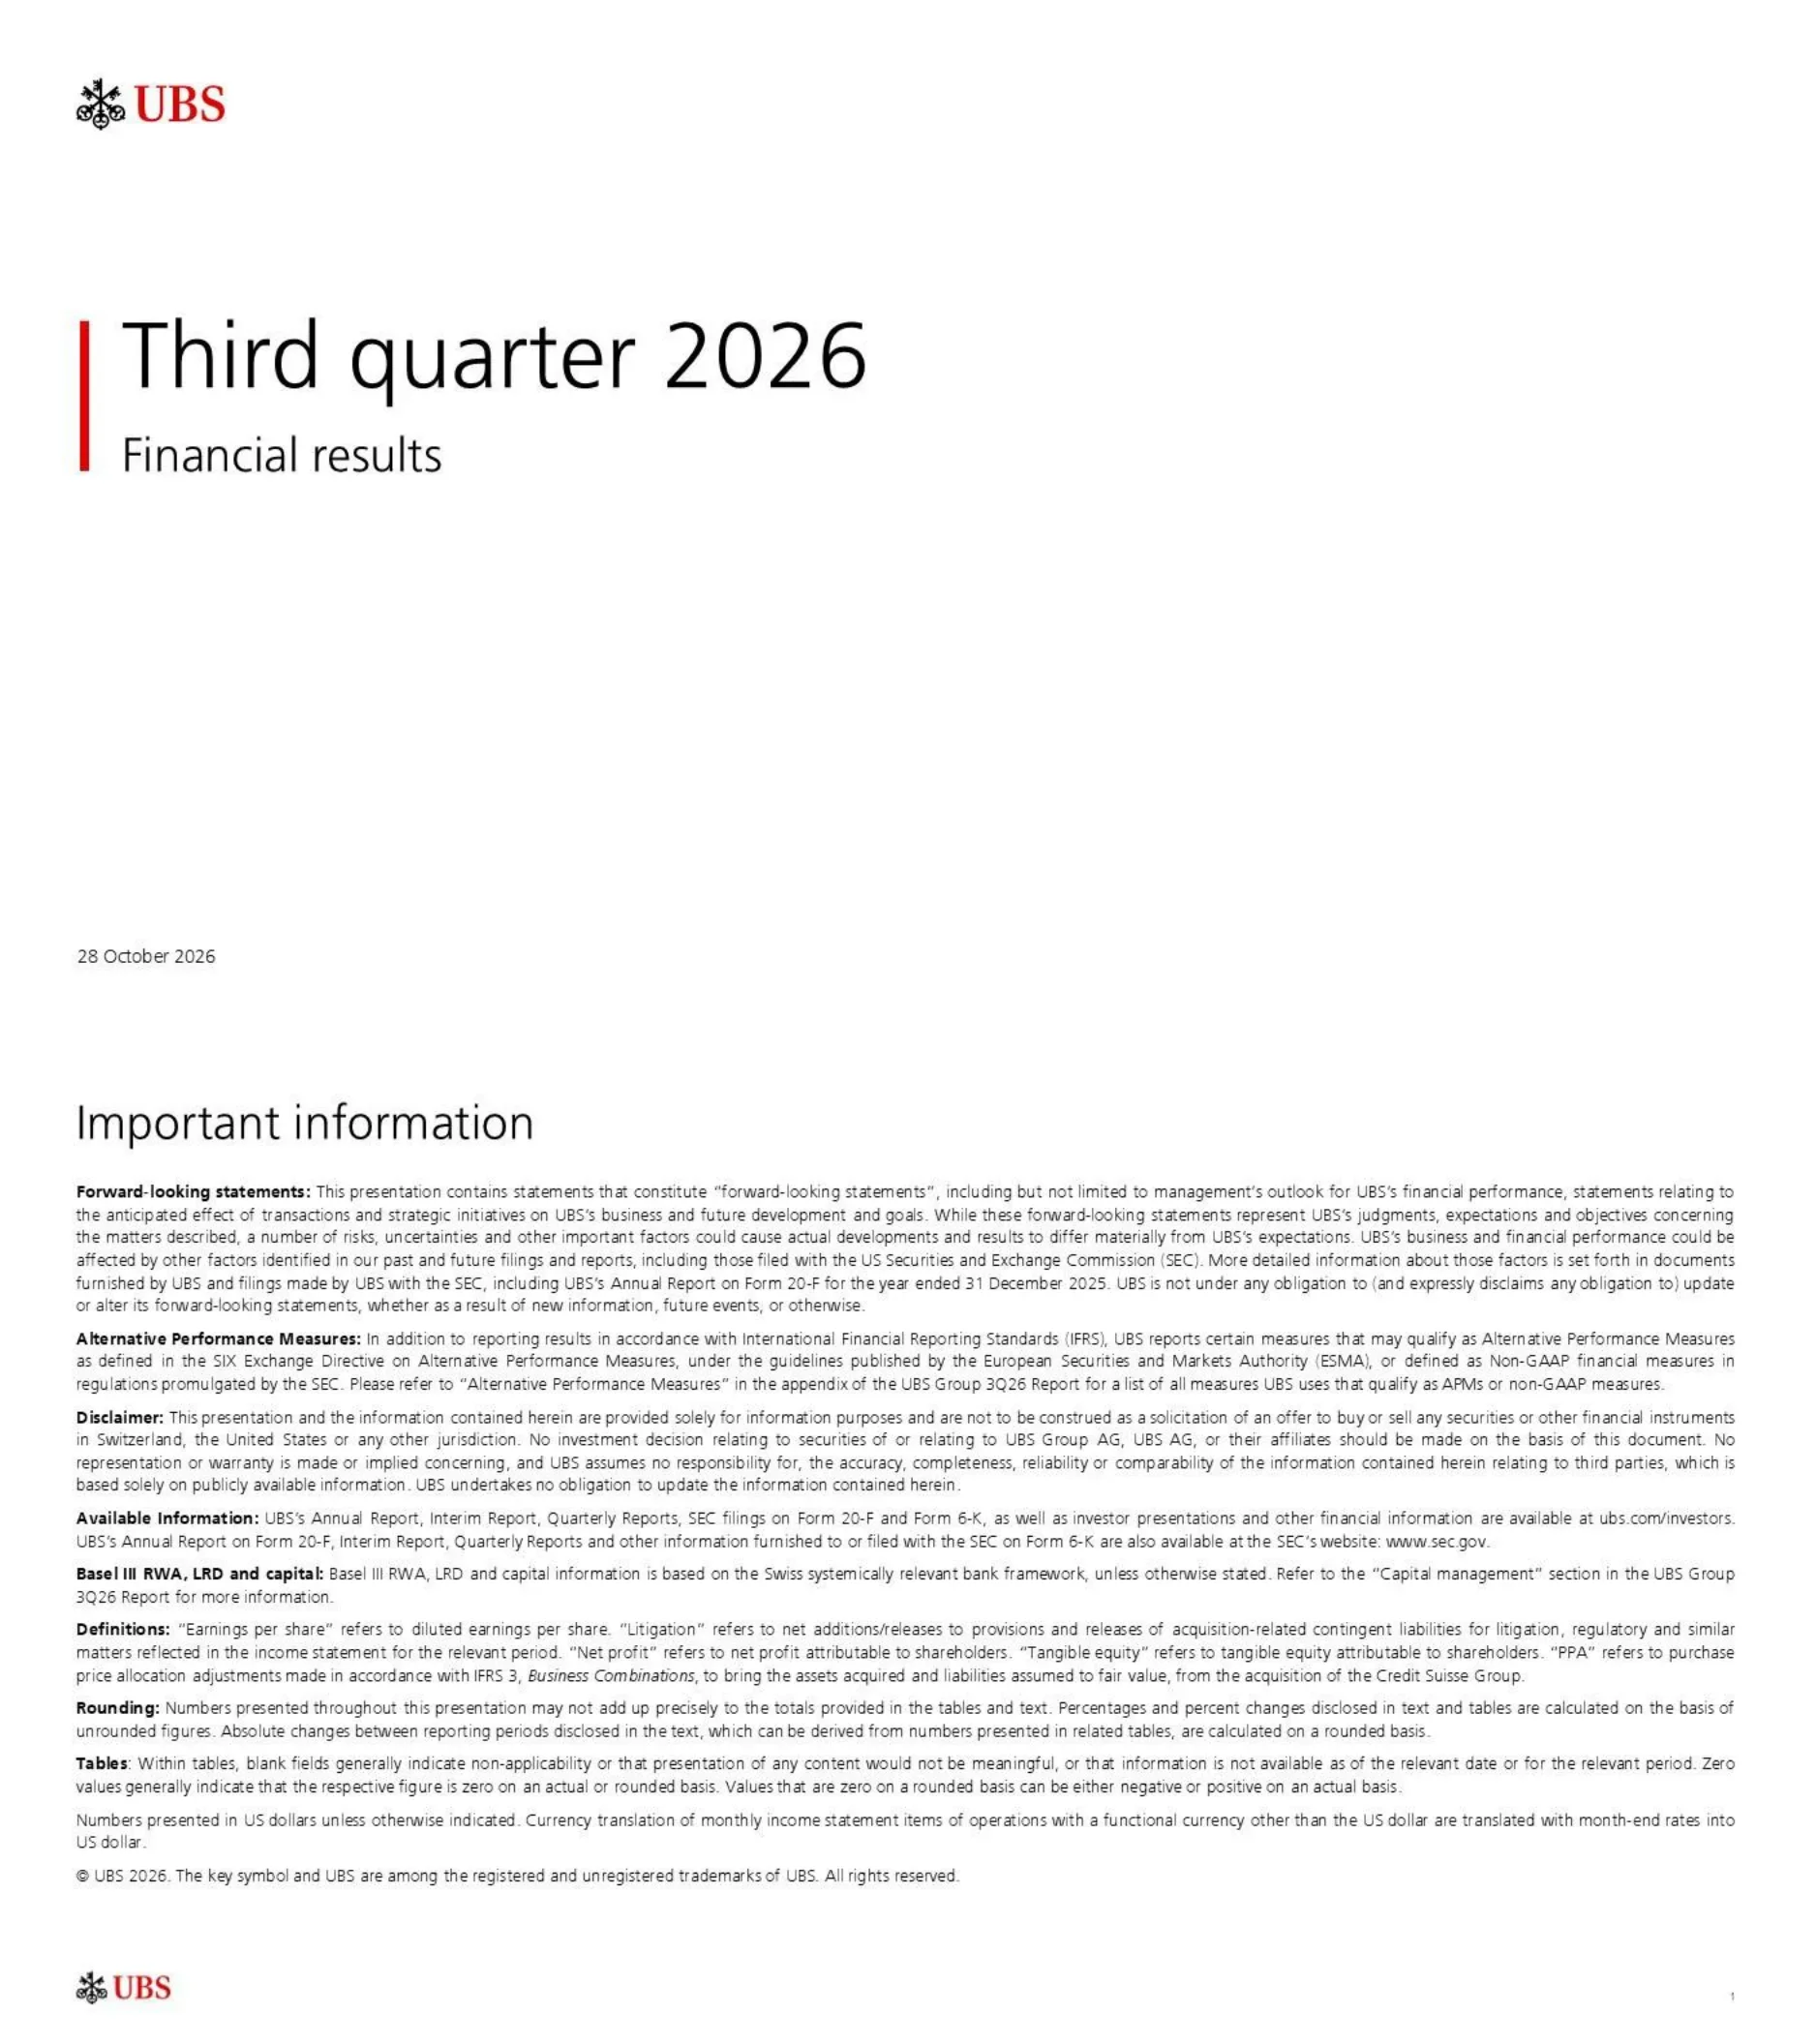
UBS logo top left, title 'Third quarter 2026' with subtitle 'Financial results', dated 28 October 2026.
Left-aligned title and subtitle with a red vertical bar on a white background
Text-only legal slide: forward-looking statements, Alternative Performance Measures (APMs) under IFRS, disclaimer, available information (ubs.com/investors, Form 20-F and Form 6-K on sec.gov), Basel III RWA/LRD/capital basis, definitions, rounding, table conventions, and a note that numbers are in US dollars unless indicated. Small print is dense.
Dense full-width paragraphs with bold run-in headings under a slide title
Three sections: Key messages (Sergio P. Ermotti, Group CEO), Financial performance (Todd Tuckner, Group CFO) and Q&A.
Three columns, each with a red vertical bar, large heading and presenter name
Five bullets: strong 3Q26 performance with net profit 2.7bn, underlying RoCET1 16.7% and underlying cost / income ratio 68.7%; client momentum with 7.3trn invested assets, GWM net new assets 55bn, record client commitments in UGA 12.5bn, P&C net new loans CHF 3.3bn, Global Markets underlying revenues +17% YoY; CET1 capital ratio 14.7%, leverage ratio 4.6%, current 3bn buyback expected to complete by 4Q26 results; integration nearing completion with about 90% of legacy applications decommissioned and 13.2bn gross cost saves achieved; commitment to a diversified global franchise.
Five stacked statements, each with a red vertical bar, bold lead-in and plain supporting sentence
Section title 'Financial performance' presented by Todd Tuckner, Group CFO.
Left-aligned title with red vertical bar and presenter line
Underlying, bn, 3Q25 vs 3Q26. Revenues 12.2 to 13.4 (+10%, Core +3%; core 12.2 to 12.6); operating expenses 8.5 to 9.2 (+8%, Core +2%, (1%) excluding litigation; (7%) excluding litigation, variable and FA compensation, and FX; core 8.7 to 8.8); profit before tax 3.6 to 4.1 (+14%, Core +7%, +16% excluding litigation; core 3.5 to 3.7). Side panel, reported: net profit 2.7bn, EPS 0.85; underlying: PBT 4.1bn, RoCET1 16.7%, cost / income 68.7%. NCL means Non-core and Legacy, the run-off portfolio.
Three stacked bar charts (Core in dark grey, NCL in light grey) with growth callouts, plus a KPI table on the right
Waterfall in USD m from 3Q25 PBT 3,590 through GWM +199, P&C +161, AM +17, IB +67, NCL +259 and Group Items (215) to 3Q26 underlying PBT 4,077; then non-underlying revenues (38), non-underlying expenses (452) giving reported PBT 3,587; tax and NCI (897) giving net profit 2,690. Callouts: (346m) from repurchase of legacy CS debt, (887m) tax, about 0.5bn non-underlying expenses expected in 4Q26. Footnotes partly legible.
Horizontal waterfall bridge with dark totals and light-grey deltas, bracket labelled Underlying
Three bar charts in USD bn. Cumulative annualized exit rate gross cost reductions: 10.7 at YE25, 13.2 at 3Q26 (+0.6bn in 3Q26), about 13.7 at YE26e (increased from about 13.5bn). Underlying operating expenses: about 40.6 FY22 combined baseline, 35.6 FY25, 37.3 3Q26 LTM (about 29% / about 9.4bn lower at constant FX). Cumulative integration-related expenses: 13.4 YE25, 15.2 3Q26, about 15.7 YE26e. Footnotes partly legible.
Three side-by-side column charts with callouts and legends at the bottom
Two tables, USD bn, 3Q26 vs 2Q26 and 3Q25 with QoQ and YoY. Balance sheet: total assets 1,655; lending 679; customer deposits 778; total equity 89; tangible book value per share USD 27.00; cost of credit risk 7bps; credit-impaired lending assets 1.0%. Regulatory capital: CET1 capital 73.1, RWA 496.1, LRD 1,591, CET1 capital ratio 14.7%, CET1 leverage ratio 4.6%, liquidity coverage ratio 179%, net stable funding ratio 115%. CET1 is the core equity capital buffer; RWA are risk-weighted assets; LRD is the leverage ratio denominator. Two commentary boxes below, footnotes partly legible.
Two financial tables side by side with two grey commentary boxes underneath
CET1 capital ratio walk from 14.4% at 2Q26 to 14.7% at 3Q26: net profit +0.6%, dividend accrual (0.2%), currency effects 0.0%, RWA excluding currency effects +0.1%, other (0.1%). CET1 capital 72.5bn to 73.1bn. Side bullets: RWA 496bn, (8bn) QoQ; CET1 leverage ratio 4.6%, +20bps QoQ, LRD 1,591bn; 14.5% UBS AG standalone CET1 ratio.
Waterfall chart with number strip on top and grey commentary box on the right
Underlying, USD m, 3Q26: total revenues 6,898 (+8% YoY); net interest income 1,755; recurring net fee income 3,801 (+9%); transaction-based income 1,323 (+4%); operating expenses 4,915; PBT 1,972 (+11% YoY, +25% excluding litigation); cost / income ratio 71%; invested assets 4,977bn; net new assets 55bn.
Left KPI table with quarterly comparison columns, right-hand commentary with red sub-headings
Underlying, CHF m, 3Q26: total revenues 1,787 (+4% YoY); net interest income 942; recurring net fee income 381; transaction-based income 427; credit loss expense 27; operating expenses 947 (5%) YoY; PBT 813 (+22% YoY); cost / income ratio 53%; net new deposits +1.8bn and net new loans +3.3bn.
Left table, right commentary with red headings
Underlying, USD m, 3Q26: total revenues 780 ((7%) YoY); net management fees 767; performance fees 16; operating expenses 480 ((14%) YoY); PBT 300 (+6% YoY); cost / income ratio 62%; invested assets 2,201bn; net new money (5)bn.
Left table, right commentary
Underlying, USD m, 3Q26: total revenues 3,218 (+6% YoY); Global Banking 670 ((21%)); Global Markets 2,548 (+17%) with Execution Services 664, Derivatives & Solutions 997 and Financing 887; operating expenses 2,334; PBT 854 (+9%); cost / income ratio 73%; RWA 116bn; LRD 468bn; return on attributed equity 17.7%.
Left table with indented sub-lines, right commentary by business line
Table (USD m) 3Q26: total revenues 764, operating expenses 366, expenses excluding litigation 91, PBT 360, RWA 27bn, LRD 13bn. Right-hand charts: underlying operating expenses excluding litigation from about 6.1bn (FY22 combined baseline) to 0.5bn (3Q26 LTM), about 0.5bn 2026 exit-rate ambition and about 0.2bn FY28 ambition; risk-weighted assets from 86bn at 2Q23 to 27bn at 3Q26 and about 28bn expected at YE26. Footnotes partly legible.
Left table, right two bar charts with annotations
3Q26 waterfall in USD m: reported PBT (740); LME, PPA effects and other integration items (337); underlying PBT (403); group hedging and own debt (265); underlying PBT excluding group hedging and own debt (138). Bullets: loss driven by liability management exercise (LME) and group hedging; 9.8bn of legacy Credit Suisse debt repurchased, net reported loss 346m; 265m net loss from hedging and own credit.
Waterfall chart on left, three bullets on right
Bar chart of group underlying return on CET1 capital: 17% FY22 reported, 3% 2H23, 9% FY24, 14% FY25, 17% 9M26, with underlying cost / income ratio circles of 72%, 91%, 80%, 74% and 70%. Footnotes partly legible.
Column chart with a row of circled ratios beneath
Section title 'Appendix'.
Left-aligned title with red vertical bar
Six circle badges in three columns. Financial targets: underlying RoCET1 about 15% (2026 exit rate), underlying cost / income ratio below 70% (2026 exit rate). Capital guidance: CET1 capital ratio about 14%, CET1 leverage ratio above 4.0%. 2028 ambitions: reported RoCET1 about 18%, reported cost / income ratio about 67%.
Three columns of two grey circle badges with labels
Reported, USD m, five quarters 3Q25 to 3Q26. 3Q26: total revenues 13,350; credit loss expense 114; operating expenses 9,648; operating profit before tax 3,587; tax expense 887; net profit attributable to shareholders 2,690; diluted EPS USD 0.85; effective tax rate 24.7%; return on CET1 capital 14.8%; cost / income ratio 72.3%; tangible book value per share USD 27.00 (CHF 22.58).
Full-width table, current quarter column shaded
Matrix in USD m across UBS Group, GWM, P&C, AM, IB, NCL and Group Items. Group: reported revenues 13,350, operating expenses 9,648, reported PBT 3,587, underlying PBT 4,077 (4,413 excluding litigation), underlying cost / income ratio 68.7%, underlying RoCET1 16.7%, underlying return on tangible equity 14.9%. Footnotes cover PPA (purchase price allocation) effects and the 346m legacy Credit Suisse debt repurchase loss; text partly small.
Wide reconciliation table with reported vs underlying rows
Three stacked-bar panels for 3Q26: total loss-absorbing capacity 186.7bn (going concern 95.9bn, gone concern 90.8bn, of which CET1 73.1bn); as % of RWA 496.1bn: 37.6% total, 19.3% going concern, 18.3% gone concern, CET1 14.7% vs guidance about 14% and requirements of 10.8% CET1, 15.2% going concern, 26.1% TLAC; as % of LRD 1,591.2bn: 11.7% total, CET1 4.6% vs guidance above 4%, requirements 3.58%, 5.08% and 8.88%.
Three bar panels with dashed level lines and requirement bars on the right
Four regional blocks (Americas, APAC, EMEA, Switzerland), 3Q26 vs 3Q25 and YoY. Underlying revenues USD m: Americas 3,380 (+9%), APAC 1,107 (+7%), EMEA 1,295 (+8%), Switzerland 1,126 (+8%). Underlying PBT: Americas 530, APAC 503, EMEA 474, Switzerland 480. Also net new assets, invested assets (Americas 2,424bn), loans, deposits and advisor headcount. Footnotes partly legible.
Four side-by-side table blocks with red region headings
Two waterfalls in bn. Risk-weighted assets: 503.9 at 2Q26 to 496.1 at 3Q26 ((2%)) with credit and counterparty credit risk (2.3), market risk (0.8) and currency effects (4.7). Leverage ratio denominator: 1,649.8 to 1,591.2 ((4%)) with on-balance sheet exposures (15.2), derivatives (12.5), securities financing transactions (11.1), off-balance sheet items +0.6 and currency effects (20.3).
Two stacked horizontal waterfall charts
Table of accretion of purchase price allocation (PPA) adjustments on financial instruments in USD bn by division (GWM, P&C, IB, Total): opening balance about 9.6 at 12.6.23, recognized 7.7 in 2023-3Q26, remaining about 1.9, expected future P&L releases about 2.1, amortization profile 4Q26 about 0.2, 2027 about 0.6, 2028 about 0.5, 2029+ about 0.8. Second table: elimination of Credit Suisse's prior cash flow hedge about 1.2. Footnotes partly legible.
Two stacked tables with amortization profile columns and a callout
FY22 operating expenses in USD bn: UBS sub-group (IFRS) 24.9; Credit Suisse sub-group (US GAAP) 19.1; UBS exclusions (0.3); Credit Suisse exclusions (2.0); commission expense reclassification (1.1); FY22 combined cost baseline 40.6 (about 34.5bn Core and about 6.1bn Non-core and Legacy; about 32.2bn excluding litigation, variable and FA compensation). Long footnotes partly legible.
Single-column reconciliation table with shaded value column and callout
Illustrative milestone timeline across 1Q26 to 4Q26: client account migrations 85% to 100% migrated; application decommissioning of NCL apps 73%, 78%, 88%, 96% to 100%; infrastructure and legal entities (all legacy CS operating entities decoupled from CS infrastructure; materially complete wind-down by year end); cumulative cost savings 10.7bn, 11.5bn, 12.6bn, 13.2bn to about 13.7bn.
Four horizontal swim-lanes with diamond milestone markers on a quarterly timeline
Full-page legal text on risks that could cause results to differ from forward-looking statements, including integration of Credit Suisse, capital and regulatory requirements, market conditions and litigation. Copyright UBS 2026. Too small to read in full at this resolution.
Single dense text block
Common questions about this slide and the underlying presentation content.
It is UBS Group's third quarter 2026 financial results investor presentation dated 28 October 2026, filed with the SEC as an exhibit to Form 6-K. Its 28 slides cover key messages, group profit and capital, the balance sheet, each business division (Global Wealth Management, Personal & Corporate Banking, Asset Management, Investment Bank, Non-core and Legacy and Group Items), targets, and an appendix.
Net profit was 2.7bn (reported 2,690m) with diluted EPS of USD 0.85. Underlying profit before tax was 4.1bn (+14% YoY), underlying RoCET1 (return on CET1 capital) was 16.7% and the underlying cost / income ratio was 68.7%. The CET1 capital ratio was 14.7% and the CET1 leverage ratio 4.6%.
3Q26 is the third quarter of 2026, compared with 2Q26 (QoQ, quarter on quarter) and 3Q25 (YoY, year on year). Amounts are in US dollars as the deck states; UBS reports in US dollars, and Personal & Corporate Banking is shown in Swiss francs (CHF) where the deck says so.
NCL is Non-core and Legacy, the portfolio being wound down. RWA are risk-weighted assets, a measure of risk used for capital rules. LRD is the leverage ratio denominator, the exposure base for the leverage ratio. CET1 is common equity tier 1, the highest-quality capital, shown as a ratio to RWA or to LRD.
It is UBS Group's own investor presentation in English, filed with the SEC as an exhibit to Form 6-K. UBS publishes related materials, including its Annual Report on Form 20-F and quarterly reports, on ubs.com/investors.
It includes bar and waterfall charts (profit bridge, CET1 ratio walk, RWA and LRD walks), division tables with quarterly comparisons, a capital requirements overview, a reconciliation of underlying to reported results, a milestone timeline for integration synergies, and agenda and section dividers.
The deck is available as a PDF and a PowerPoint (PPTX) file on 2Slides. You can use it as a layout reference for your own results or board presentations; the UBS logo, trademarks and all figures belong to UBS and should not be reused as your own.
UBS reports about 90% of legacy applications fully decommissioned and 13.2bn of cumulative gross cost saves achieved, with about 13.7bn expected by year-end 2026 (raised from about 13.5bn). It also says it expects to complete the current 3bn share buyback program by 4Q26 results.

Create Your Own Slides
Turn your ideas into professional presentations in seconds with 2slides AI.
Reference professional designs, choose your style, and generate slides with perfect text rendering. Powered by Nano Banana—start creating your presentation now.
Your AI Agent for slides. Save time, shine faster with intelligent presentation creation.


© 2026 2slides. All rights reserved.