
Part of Investor presentation examples · Indian investor presentation examples
Tata Capital Q2 FY27 Investor Presentation (27 October 2026): quarterly results deck from India's third-largest diversified NBFC, filed with BSE/NSE, covering the quarter ended 30 September 2026 — Net AUM of ₹ 3,08,030 crore (+26% YoY), PAT of ₹ 1,660 crore (+51% YoY), asset quality, the TCHFL housing subsidiary, the Motor Finance run-down, liabilities, FY28 guidance, AI adoption and ESG.
Uses this deck’s cover as a style reference for slides made from your own content. Or pick any page below to use its layout as the reference.
Quick Navigation
Tags
Share the slides
Tata Capital Q2 FY27 Investor Presentation (27 October 2026): quarterly results deck from India's third-largest diversified NBFC, filed with BSE/NSE, covering the quarter ended 30 September 2026 — Net AUM of ₹ 3,08,030 crore (+26% YoY), PAT of ₹ 1,660 crore (+51% YoY), asset quality, the TCHFL housing subsidiary, the Motor Finance run-down, liabilities, FY28 guidance, AI adoption and ESG.
Detailed view of each slide page, including layout, key content and visual elements.
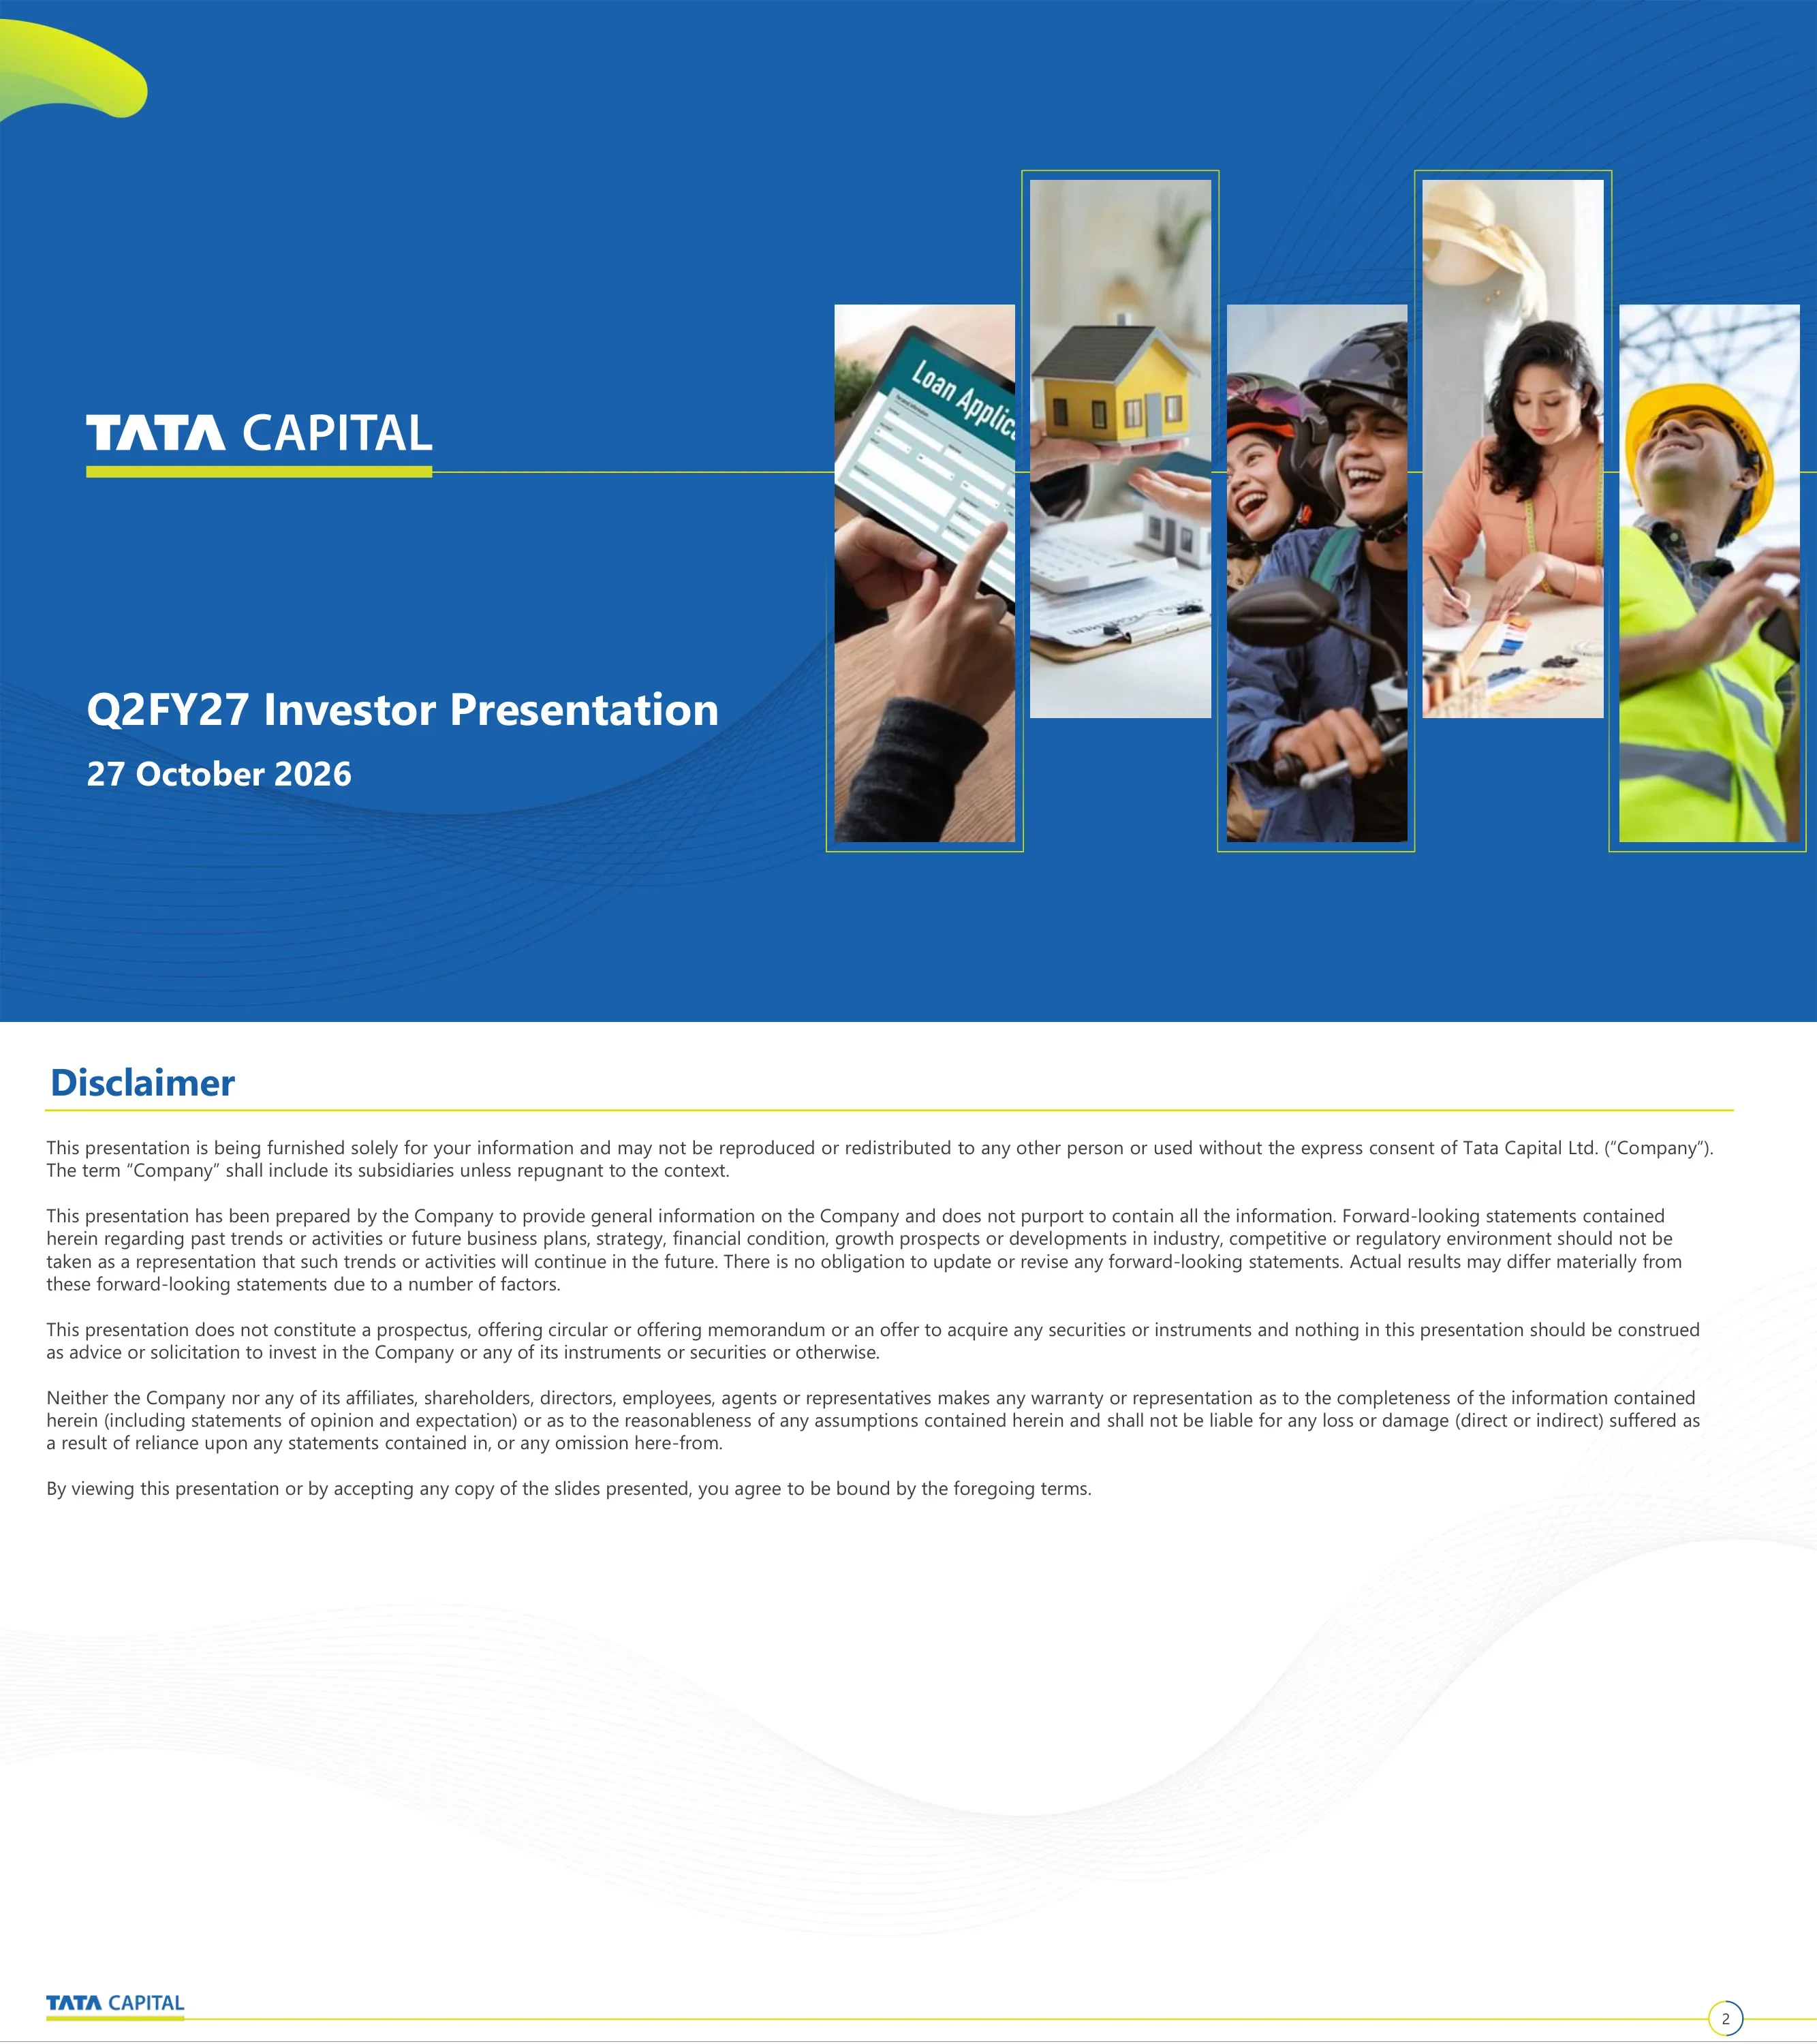
Title slide with the Tata Capital wordmark, 'Q2FY27 Investor Presentation' and the date 27 October 2026.
Full-bleed royal-blue background; logo and title stacked on the left, a row of five vertical photo strips (loan application, home, borrowers, worker in hard hat) on the right with a lime-green swoosh in the top-left corner.
Standard legal disclaimer: the presentation is for information only, forward-looking statements may differ from actual results, and it is not an offer or solicitation to invest in Tata Capital Ltd.
White content slide with blue title and thin yellow rule, five dense paragraphs of small text across the full width, logo footer bottom-left and page number bottom-right.
Key figures: AUM ₹ 3,08,030 Cr (+26.3% YoY, +6.0% QoQ), PAT ₹ 1,660 Cr (+51.3% YoY, +7.3% QoQ), cost-to-income 35.3% (39.7% in Q2FY26), cost to average assets 2.3%, credit cost 0.9% and RoA 2.3%; highlights include the loan book crossing ₹ 3 lakh crore, 9.2mn customers (~0.4mn added), Retail + SME at 85.4% of Net AUM, GNPA 1.9%, NNPA 0.8% and ROE 14.0%.
Two-panel layout: left panel 'Key Figures' with a 2x3 grid of KPI cards (value, label, prior-period comparisons in light blue); right panel 'Q2FY27 Performance Highlights' with a bulleted list and sub-bullets for asset quality.
Scale: AUM ₹ 3,08,030 cr (+26% YoY), ₹ 2,84,439 cr excluding Motor Finance (+32% YoY), net AUM addition ₹ 17,528 cr QoQ, unsecured retail 10.4% of Net AUM. Profitability: PAT ₹ 1,660 cr, ROA 2.3% (2.5% ex-Motor Finance), ROE 14.0%. Asset quality: credit cost 0.9%, GNPA 1.9%, NNPA 0.8%.
Three stacked full-width sections, each with a blue header bar (Scale, Profitability, Asset quality) and bulleted text inside a light rounded box.
Operating efficiency: NII ₹ 3,696 cr (+23% YoY), cost to average assets 2.3%, 31,655 on-roll employees (headcount +6% vs AUM +26%). Distribution: 1,515 branches in 26 states/UTs, 9.2mn customers. Liabilities: total equity ₹ 47,778 cr, borrowings ₹ 2,60,846 cr (5.5x equity), average cost of borrowings 7.3% (+5 bps QoQ), liquidity buffer ₹ 36,398 cr.
Same three-section format as page 4: Operating efficiency, Distribution, and Liability and Networth, each with a blue header bar and bullets.
Section break introducing the company overview.
Blue left half with logo and section title; right half split diagonally into photos of families and a customer meeting, separated by a yellow-edged blue triangle and a central hexagon.
Group structure: Tata Sons holds 78.8% (Tata Group 85.4%) of Tata Capital Limited, which owns 100% of Tata Capital Housing Finance (TCHFL), Tata Securities and Tata Capital Pte (Singapore). Tata Capital is an upper-layer NBFC with ~₹ 3.1tn Net AUM as of 30 Sep 2026, 85.4% Retail & SME; non-lending businesses span private equity, wealth management and insurance/credit-card distribution; the merger with Tata Motors Finance completed in May 2025 (appointed date 1 Apr 2024).
Left: organisation chart from Tata Group to TCL to three subsidiary boxes with descriptions. Right: three callout cards with circular icons covering scale, non-lending businesses (three icons) and the TMFL merger.
Six values arranged around a hexagon cluster: Lead with Trust, Better Together, Futuready, Delivering Delight, Capital & More, and Fast Forward, each with a one-line description.
Centered honeycomb of six icon hexagons in purple, blue and green; value names and descriptions placed left and right of the cluster.
Timeline from commencing lending in 2007 through crossing ₹ 500bn, ₹ 1tn, ₹ 2tn and ₹ 3tn loan-book milestones, S&P/Fitch BBB- ratings, AAA domestic upgrade, mergers (TCFSL/TCCL, TMFL), NSE/BSE listing in Oct-25 and the ~88.6% Yogloans acquisition (gold loans). Net AUM rose from ₹ 1,169bn (Mar-23) to ₹ 3,080bn (Sep-26); 18 years of profitability.
Rising bar chart of Net AUM (₹ bn) with milestone callouts and circular icons connected by leader lines above the bars; blue banner at the bottom with the key takeaway.
Seven strengths: 3rd-largest diversified NBFC in India, prudent risk culture, omni-channel 'Phygital' model, digital/GenAI/analytics, highest credit rating and diversified liabilities, the 'Tata' brand, and an experienced management team with 400+ years of combined experience.
Semicircular fan diagram of colored segments with icons around a central Tata Capital arc; strength labels positioned around the fan; full-width blue banner at the bottom.
Eleven-column table FY18–FY26 (with ex-TMFL columns for FY25 and FY26): Net AUM grew from ₹ 59,480 cr to ₹ 2,77,275 cr and PAT from ₹ 605 cr to ₹ 4,846 cr; ratio block shows cost-to-income, credit cost, GNPA/NNPA, PCR, ROA, ROE and basic EPS by year.
Full-width dense financial table with a blue header row, bolded key rows (Net Total Income, PAT) and a second ratio table beneath; footnote in the footer.
Section break introducing the business overview.
Blue background with logo and white title on the left, photo of a presenter pointing at dashboard charts on the right, framed by a yellow-edged triangle.
1,515 branches in 26 states and UTs across 1,094 locations (2.8x from 539 in Mar-23); 22,189 in-house sales staff and 35K+ DSAs; 173 lakh+ mobile app downloads and 65 lakh+ monthly website traffic.
Left: India map shaded by state with branch counts per state. Right: purple 'Branch network' card with a two-bar chart (539 to 1,515), plus green and yellow cards for sales ecosystem and digital presence.
Net AUM of ₹ 3,08,030 cr split Retail 56.7% : SME 28.7% : Corporate 14.6%; retail breakdown includes home loans 15.6%, LAP 14.2%, personal/business loans 9.1%, motor finance 7.7%. 25+ lending products, high-margin retail ~25% of Net AUM, organic book ~99%, granular book ~99%.
Left: donut chart of AUM mix with labeled segments. Right: six bordered callout boxes in blue, purple and green inside a dashed frame; blue banner across the top.
Six-quarter table (Jun-25 to Sep-26) of Net AUM amounts and % mix by segment: retail ex-Motor Finance ₹ 1,51,077 cr (49.0%), SME ₹ 88,500 cr (28.7%), corporate ₹ 44,862 cr (14.6%), Motor Finance down to ₹ 23,591 cr (7.7% from 12.8%).
Wide table with two grouped header bands — green 'Amount (₹ cr)' and purple '% Mix' — italicized sub-rows for retail products and bold totals.
Eleven retail products with description, Net AUM, share, YoY growth and average ticket size, e.g. home loans ₹ 48,163 cr (+17.2%, ATS ₹ 33.2 lakh), LAP ₹ 43,617 cr (+29.9%), CV loans ₹ 23,131 cr (-15.4%), personal loans ₹ 17,020 cr (+19.4%), loan against securities +40.0%, education loans +79.7%.
Full-width table with icon plus product name in the first column, descriptive text column and four numeric columns; vertical 'Retail products' label on the left edge.
Six SME/corporate products with average ticket sizes: supply chain finance (₹ 2.8 cr), equipment finance (₹ 1.7 cr), leasing (₹ 24.6 cr), term loans (₹ 39.6 cr), developer finance via TCHFL (₹ 80.4 cr, 150 developers in 11 cities) and cleantech/infrastructure finance (₹ 172.7 cr, 500+ projects).
2x3 grid of cards, each with a colored header tab (blue, purple, green) and bullet text in a shadowed box.
Table of disbursal IRR, disbursement growth and AUM growth for high-margin products: personal loans (14–15% IRR, disbursements +68%, AUM +19%), business loans, microfinance (~25% IRR), affordable/micro HL and LAP, two-wheeler and vehicle finance; total disbursements +40% YoY vs AUM +14%. A side bar chart shows AUM growth rising from 5% (Q3FY26) to 14% (Q2FY27).
Left: table with colored column headers. Right: dashed panel with horizontal bars of AUM growth over four quarters. Bottom: four commentary bullets.
Private equity: Growth and Healthcare themes, ₹ 9,239 cr raised across funds, 55 deals in over 15 years, raising Fund III and planning a Decarbonization Fund. Wealth management: ₹ 8,238 cr AUM, 22% CAGR (Mar-23 to Sep-26). Insurance distribution: composite corporate agent licence, 8.8mn+ policies in force.
Three chevron-shaped columns in purple, green and blue gradients, each with a header tab, bullets, icons and highlighted stats.
Q2FY27 vs Q2FY26: NII ₹ 3,696 cr (+23%), net total income ₹ 4,676 cr (+24%), opex ₹ 1,651 cr (+10%), PPOP ₹ 3,025 cr (+33%), loan losses ₹ 645 cr (-17%), PBT ₹ 2,380 cr (+58%), PAT ₹ 1,660 cr (+51%); H1FY27 PAT ₹ 3,207 cr (+54%). Ratios: cost-to-income 35.3%, credit cost 0.9%, ROA 2.3%, ROE 14.0%.
Full-width P&L table with quarterly, half-year and FY26 columns; YoY growth columns highlighted in dark blue and separated by dashed vertical lines; ratio block below.
Five-quarter view (Sep-25 to Sep-26): gross loans ₹ 3,03,739 cr, GS3 ₹ 5,723 cr, total provisions ₹ 5,350 cr; Stage 3 at 1.9% gross and 0.8% net; Stage 3 provision coverage up from 52.8% to 58.6%; Stage 2 down to 1.2%.
Single table with grouped sections (gross loan mix, provision coverage, net loan mix) separated by light shaded sub-headers.
Segment-level GS3, NS3 and provision coverage for five quarters: total GS3 1.9% and NS3 0.8% (Sep-26); excluding Motor Finance GS3 1.3% and PCR 69.2%; Motor Finance GS3 8.7% and NS3 5.6%; corporate PCR 97.9%.
Wide table with three color-banded header groups (blue Gross Stage 3, green Net Stage 3, purple Provision Coverage) and dashed separators.
Monthly collection efficiency Jul-25 to Sep-26 for home loans (~99.8–99.9%), LAP (~99.7–99.8%), personal loans and business loans (~99.1–99.5%), two-wheeler (98.4–99.2%) and used car loans (~99.0–99.3%).
Fifteen-column monthly grid with product rows and a blue header; definition footnote at the bottom.
Section break for Tata Capital Housing Finance Limited.
Blue left panel with logo and title; right photo of a family decorating a new home, framed by a yellow-edged triangle.
AUM and PBT path FY19–H1FY27 (AUM ₹ 26,384 cr to ₹ 95,098 cr; AUM CAGR 31% FY22–H1FY27, PBT CAGR 34% FY22–FY26). Q2FY27: AUM ₹ 95,098 cr (+26% YoY), PAT ₹ 552 cr (+26%), cost-to-income 30.0%, ROA 2.5%, NNPA 0.3%, ROE 18.0%; credit cost 0.1%, GNPA 0.7%, ~370 branches.
Top: horizontal arrow timeline with AUM and PBT rows. Bottom-left: 2x3 KPI card grid; bottom-right: bullet list in a rounded box.
Q2FY27 Net AUM ₹ 95,098 cr split prime and near-prime home loans 40% (₹ 37,797 cr, ATS ₹ 42 lakh), prime LAP 21% (₹ 19,530 cr), developer finance 21% (₹ 19,598 cr, 11 cities, ATS ₹ 80 cr), affordable housing 18% (₹ 16,810 cr, ATS ₹ 18 lakh) and micro housing 1% (₹ 1,363 cr).
Central pie chart in blue, purple and green with callouts, flanked by four product boxes with colored headers.
TCHFL P&L: NII ₹ 852 cr (+22% YoY), net total income ₹ 1,089 cr, PPOP ₹ 762 cr, loan losses ₹ 21 cr, PBT ₹ 741 cr, PAT ₹ 552 cr (+26%); H1FY27 PAT ₹ 1,084 cr (+27%). Ratios: cost-to-income 30.0%, credit cost 0.1%, ROA 2.5%, ROE 18.0%.
Same table design as page 20 with highlighted YoY columns and a ratio block.
Section break for the Motor Finance business.
Blue panel with title; right photo of silhouetted business people in front of a world map, framed by a triangle.
Net AUM ₹ 23,591 cr, Q2FY27 disbursement ₹ 2,383 cr, 2.5mn+ customers, 392 branches, 1,050+ dealer touchpoints, 4,375 employees. Net AUM fell ₹ 9,922 cr between Mar-25 and Sep-26 with quarterly depletion shrinking from ₹ 3,139 cr to ₹ 854 cr; mix is HCV-new 40%, used vehicle 32%, ILMSCV 25%, others 3%.
Three columns: icon list of metrics with blue pill values; purple bar chart of quarterly AUM depletion; donut chart of AUM mix.
Tata Motors Finance acquisition completed 8 May 2025. Key drivers: multi-OEM model (non-Tata OEM share of disbursements 0% to 30%, 597 dealers added in 15 months), product mix shift to used and ILMSCV, all liabilities repriced, over 100 branches rationalized and headcount cut to 4,375 from 6,351, IT integration with TCL completed.
Two-column table layout: blue 'Key Drivers' column and green 'Updates' column with embedded mini tables of quarterly disbursement metrics.
Section break for the liability and asset profile.
Blue panel with title; right photo of a laptop showing spreadsheets and charts, framed by a triangle.
Total borrowings grew from ₹ 69,801 cr (Mar'19) to ₹ 2,60,846 cr (Sep'26), mixing bank loans, NCDs, ECB/MTN, CP/WCDL, Tier II/perpetual and NHB. AAA domestic rating, BBB international rating, first USD bond in Jan'25; average cost of borrowings 7.3% (two-point average) in Q2FY27.
Three icon callouts across the top; 100% stacked column chart of funding mix over 16 periods; line chart of cost of borrowings below.
Quarterly trends Q1FY25–Q2FY27: total CRAR 17.3% and Tier-I 14.7% in Q2FY27 against a 15% regulatory minimum, Tier-II down to 2.6%, and borrowings-to-equity down from 6.8x to 5.5x.
Full-slide multi-line chart with data labels for four series and a dotted regulatory CRAR line; legend at the bottom.
Cumulative inflows vs outflows across ten maturity buckets from 1–7 days to over 5 years, with positive cumulative surplus in most buckets (10–11% in short buckets, a (2)% gap in the 1–3 year bucket).
Clustered columns in grey and blue for each bucket, a row of surplus/gap pills along the top, blue banner header.
Section break for financial guidance.
Blue panel with title; photo of hands passing a small model house, framed by a triangle.
FY28 targets, unchanged from the Q2FY26 presentation: AUM CAGR 23–25% and PAT CAGR above 30% (FY25–28E), cost-to-income 33–34%, credit cost below 1.0%, Net NPA below 1.0%, ROA 2.5–2.7%, ROE 17–18%.
Seven guidance tiles arranged 4 over 3, each with a blue or green corner bracket, large figure and label.
Section break for technology and AI.
Blue panel with title; photo of a hand touching digital interface icons, framed by a triangle.
Three pillars: Digital DNA (digital-first NBFC, technology at the core), AI > Next (AI to reimagine finance and achieve operational excellence) and Customer at the Core (products shaped around customer needs).
Tech-themed banner image across the top; three numbered cards with colored header bars (blue, green, purple) and bullet text.
Digitized loan lifecycle across onboarding, underwriting, collections and customer service: 99% of customers onboarded digitally, 98% of retail disbursements via scorecards/BRE, 99% of collections via digital channels, 98% of queries addressable digitally, 170+ retail services and 180+ digital partnerships.
Four rounded columns with colored outlines listing capabilities as icon rows; a strip of six stat pills along the bottom.
Five AI building blocks: customer engagement, document intelligence, AI-ready workforce (12,000+ employees trained, 9,000+ AI-assisted interviews), AI platform and infrastructure (hybrid cloud, multi-model) and AI-powered analytics; outcomes are faster turnaround, higher productivity, better experience, lower cost to serve and stronger risk monitoring.
Five cards (3 over 2) with colored icon headers, italic descriptions and outcome text; blue banners at the top and bottom.
AI use cases across five stages: customer acquisition and onboarding, underwriting (credit intelligence, CAM generation), operations (agentic workflows, touchless processing), portfolio monitoring and collections, and services (AI agents, email intelligence).
Five vertical columns with blue header tabs, bullet lists and a circular icon at the bottom of each, on a light gradient.
AI in marketing: 85–90% of creatives AI-generated, 60% of video and blogs, 75–80% of campaign communications, interactions in 11 languages. Onboarding: 30 lakh customer connects (Sep-26), ~14% of call-center PL sourcing via AI agents; digital KYC 99% for PL and home loans; 85%+ Account Aggregator penetration.
Four quadrant panels with blue headers; big-number stats in the top two, bullets and a small adoption table in the bottom two.
Credit Intelligence Engine and Credit Decisioning Engine: 95%+ adoption across PL and BL underwriting, 39%+ faster processing TAT, 30% higher SME underwriting productivity, 120+ document formats trained and ~7.8 crore documents processed through AI.
Row of five stat boxes with blue brackets at the top; two green-headed panels with bullets and checkmark benefit lists below.
Agentic operations platform across retail, SME and corporate: 95%+ adoption across BL, TW and MFI, 70% of retail applications processed via AI, ~43% productivity gain, ~40% faster processing TAT and 28%+ lower ops cost per file.
Stat strip on top; left semicircle graphic linking Retail, SME and Corporate; right bullet list and checkmark benefits box.
Agentic voice hub and agentic email workflow: 95% of welcome calls through AI, ~75% lower servicing cost per call, 70%+ of email draft responses by AI agents, 90%+ of email queries resolved the same day.
Four stat boxes on top; two blue-headed panels with bullets and checkmark benefit boxes.
Stock monitoring and collections: 100% adoption across SME stock monitoring, 83% stock-audit TAT reduction, 95%+ pre-delinquency calls via AI-assisted bots, 30% of early-bucket EMI collections through bots, engagement in 11 languages.
Four purple-bracketed stat boxes; two purple-headed panels with bullets and checkmarks; blue banner at the bottom.
Section break for ESG.
Blue panel with title; green photo of a hand holding 'ESG' lettering surrounded by sustainability icons.
Six pillars: board independence and diversity (five of eight directors independent, two female independent directors), data and risk governance, leadership accountability via the Risk Committee, sustainability-focused business, ethical framework (100% trained on the Tata Code of Conduct) and CSR.
Two rows of three icon-topped text blocks on a light grey band.
Environmental, social and governance KPIs: 700+ cleantech projects and 35 GW+ renewable capacity financed, 10% women in workforce, 8 lakh+ women empowered by microfinance, 3.7mn+ lives impacted by CSR, maiden BRSR for FY26, AAA by Crisil/ICRA/CARE and BBB by S&P.
Bold intro statement on top; three columns (green, blue, purple headers) of rounded KPI pills.
Cleantech financing since TCCL was set up with IFC in 2011: 700+ projects, 35 GW+ renewable capacity, ₹ 55,000 Cr+ disbursed; EV financing with 85,000+ live customers, 5,000+ added monthly, ~7% of the two-wheeler portfolio; focus on renewables, e-mobility, energy efficiency, green finance and waste management.
Two rows of stat tiles (blue for cleantech, green for EV); two outlined callouts; purple 'Focus Areas' tab row at the bottom.
Environmental CSR: JalAadhar (410 villages, 8 lakh+ people, 1,000+ water bodies rejuvenated), The Green Switch (solar power for 6,000+ homes in 124 hamlets, ~1.7 MWp) and Vanaropan for Neutrality (41+ ha afforested, 2.5 lakh+ saplings); 10,31,530+ lives impacted.
Three columns, each with an SDG icon, program name, photo and bullets; blue impact banner at the bottom.
Healthcare and education CSR: Aarogyatara (18.67 lakh people screened, 1.96 lakh vision surgeries; 18,67,000+ lives impacted) and Education (40,000+ Pankh scholarships, financial literacy, skilling; 5,24,330+ lives impacted).
Two columns with SDG icon, photo, bullets and a blue impact stat box at the bottom, separated by a dashed divider.
Fourteen awards, including ASSOCHAM Award of Excellence for NBFCs Upper Layer 2026, Bharat NBFC & Fintech Summit awards 2026, Best BFSI Brand 2025 by ET Edge, the Tata Innovista Award for the GenAI-powered CAM project and India Green Energy Award for EV financing.
Two rows of seven trophy photos in bracket frames, with italic captions beneath each.
Closing slide.
Blue panel with logo and 'Thank You'; photo of a woman using a laptop in a field, framed by a yellow-edged triangle.
Section break for annexures.
Blue panel with title; construction-site photo of engineers in hard hats, framed by a triangle.
Mar-26 vs Sep-26: total net loans ₹ 2,68,203 cr to ₹ 2,98,217 cr, total assets ₹ 2,90,583 cr to ₹ 3,19,238 cr, borrowings ₹ 2,35,977 cr to ₹ 2,60,846 cr, networth ₹ 45,861 cr to ₹ 48,981 cr (total equity ₹ 47,778 cr).
Compact three-column table on the left half of the slide with a blue header and shaded total rows.
Glossary defining average cost of borrowings, Tier I, CRAR, cost-to-income, credit cost, fee income, gross/net stage 3 loans and ratios, investment income, net total income, opex ratio, provision coverage, ROA, ROE, total equity, gross and net loans, and Net AUM.
Two-column term/definition table across the full slide with a blue header row.
Common questions about this slide and the underlying presentation content.
For the quarter ended 30 September 2026, Net AUM was ₹ 3,08,030 crore (+26% YoY, +6% QoQ) and PAT was ₹ 1,660 crore (+51% YoY). Annualized ROA was 2.3%, ROE 14.0%, cost-to-income 35.3%, credit cost 0.9%, GNPA 1.9% and NNPA 0.8%.
Indian companies use an April–March fiscal year, so FY27 runs from April 2026 to March 2027 and Q2 FY27 is July–September 2026. The deck is dated 27 October 2026, and H1 FY27 figures cover April–September 2026.
Tata Capital filed it with the stock exchanges (BSE/NSE) alongside its Q2 FY27 results, after listing on NSE and BSE in October 2025. This gallery copy has the exchange cover letter removed and starts at the presentation's cover slide.
Motor Finance is the commercial-vehicle and car lending book acquired through the Tata Motors Finance merger (completed May 2025). It is being consolidated and repositioned, falling to ₹ 23,591 crore (7.7% of Net AUM), so the deck also shows core metrics without it: AUM growth of 32% YoY and ROA of 2.5%.
Slide 36 restates the FY28 guidance from the Q2 FY26 presentation: AUM CAGR of 23–25% and PAT CAGR above 30% over FY25–28E, cost-to-income of 33–34%, credit cost and Net NPA each below 1.0%, ROA of 2.5–2.7% and ROE of 17–18%.
Yes. Along with the PDF, you can download an editable PPTX converted from the PDF. It keeps the slide order and most text, tables and shapes, but it is a machine conversion and not Tata Capital's original source file, so check fonts, charts and alignment before you reuse it.
Slide 3 (six KPI tiles next to highlights), slide 20 (P&L with YoY columns), slides 21–23 (stage-wise asset quality and collection efficiency), slide 32 (funding-mix stacked columns plus cost-of-funds line) and slide 36 (guidance tiles) work well as models for any NBFC or bank quarterly presentation.
Slides 40–46 quantify AI use across the lending chain. Examples: 95%+ adoption in PL and BL underwriting, ~7.8 crore documents processed by AI, 70% of retail applications processed via AI, 95% of welcome calls handled by AI, and 30% of early-bucket EMI collections through AI-assisted bots.

Create Your Own Slides
Turn your ideas into professional presentations in seconds with 2slides AI.
Reference professional designs, choose your style, and generate slides with perfect text rendering. Powered by Nano Banana—start creating your presentation now.
Your AI Agent for slides. Save time, shine faster with intelligent presentation creation.


© 2026 2slides. All rights reserved.