
Part of Investor presentation examples · Semiconductor investor presentation examples
NXP Semiconductors Q3 2026 Earnings Presentation: the 41-slide investor deck NXP published on October 27, 2026 alongside its third-quarter 2026 results. It reports Q3 2026 revenue of $3,786 million (up 8% quarter-on-quarter and 19% year-on-year), non-GAAP gross margin of 58.6%, non-GAAP operating margin of 37.1% and non-GAAP free cash flow of $1,206 million (31.9% of revenue), and guides Q4 2026 revenue to $3,750-$3,950 million with non-GAAP diluted EPS of $4.14-$4.58. Around the quarterly numbers it restates the long-term thesis: intelligent systems at the edge for automotive and industrial markets, the Analyst Day 2024 financial model (6-10% revenue CAGR to ~$16.0B in 2027, 57-63% gross margin, 34-40% operating margin), hybrid manufacturing, capital return, debt, sustainability and full GAAP to non-GAAP reconciliations.
Uses this deck’s cover as a style reference for slides made from your own content. Or pick any page below to use its layout as the reference.
Quick Navigation
Tags
Share the slides
NXP Semiconductors Q3 2026 Earnings Presentation: the 41-slide investor deck NXP published on October 27, 2026 alongside its third-quarter 2026 results. It reports Q3 2026 revenue of $3,786 million (up 8% quarter-on-quarter and 19% year-on-year), non-GAAP gross margin of 58.6%, non-GAAP operating margin of 37.1% and non-GAAP free cash flow of $1,206 million (31.9% of revenue), and guides Q4 2026 revenue to $3,750-$3,950 million with non-GAAP diluted EPS of $4.14-$4.58. Around the quarterly numbers it restates the long-term thesis: intelligent systems at the edge for automotive and industrial markets, the Analyst Day 2024 financial model (6-10% revenue CAGR to ~$16.0B in 2027, 57-63% gross margin, 34-40% operating margin), hybrid manufacturing, capital return, debt, sustainability and full GAAP to non-GAAP reconciliations.
Detailed view of each slide page, including layout, key content and visual elements.
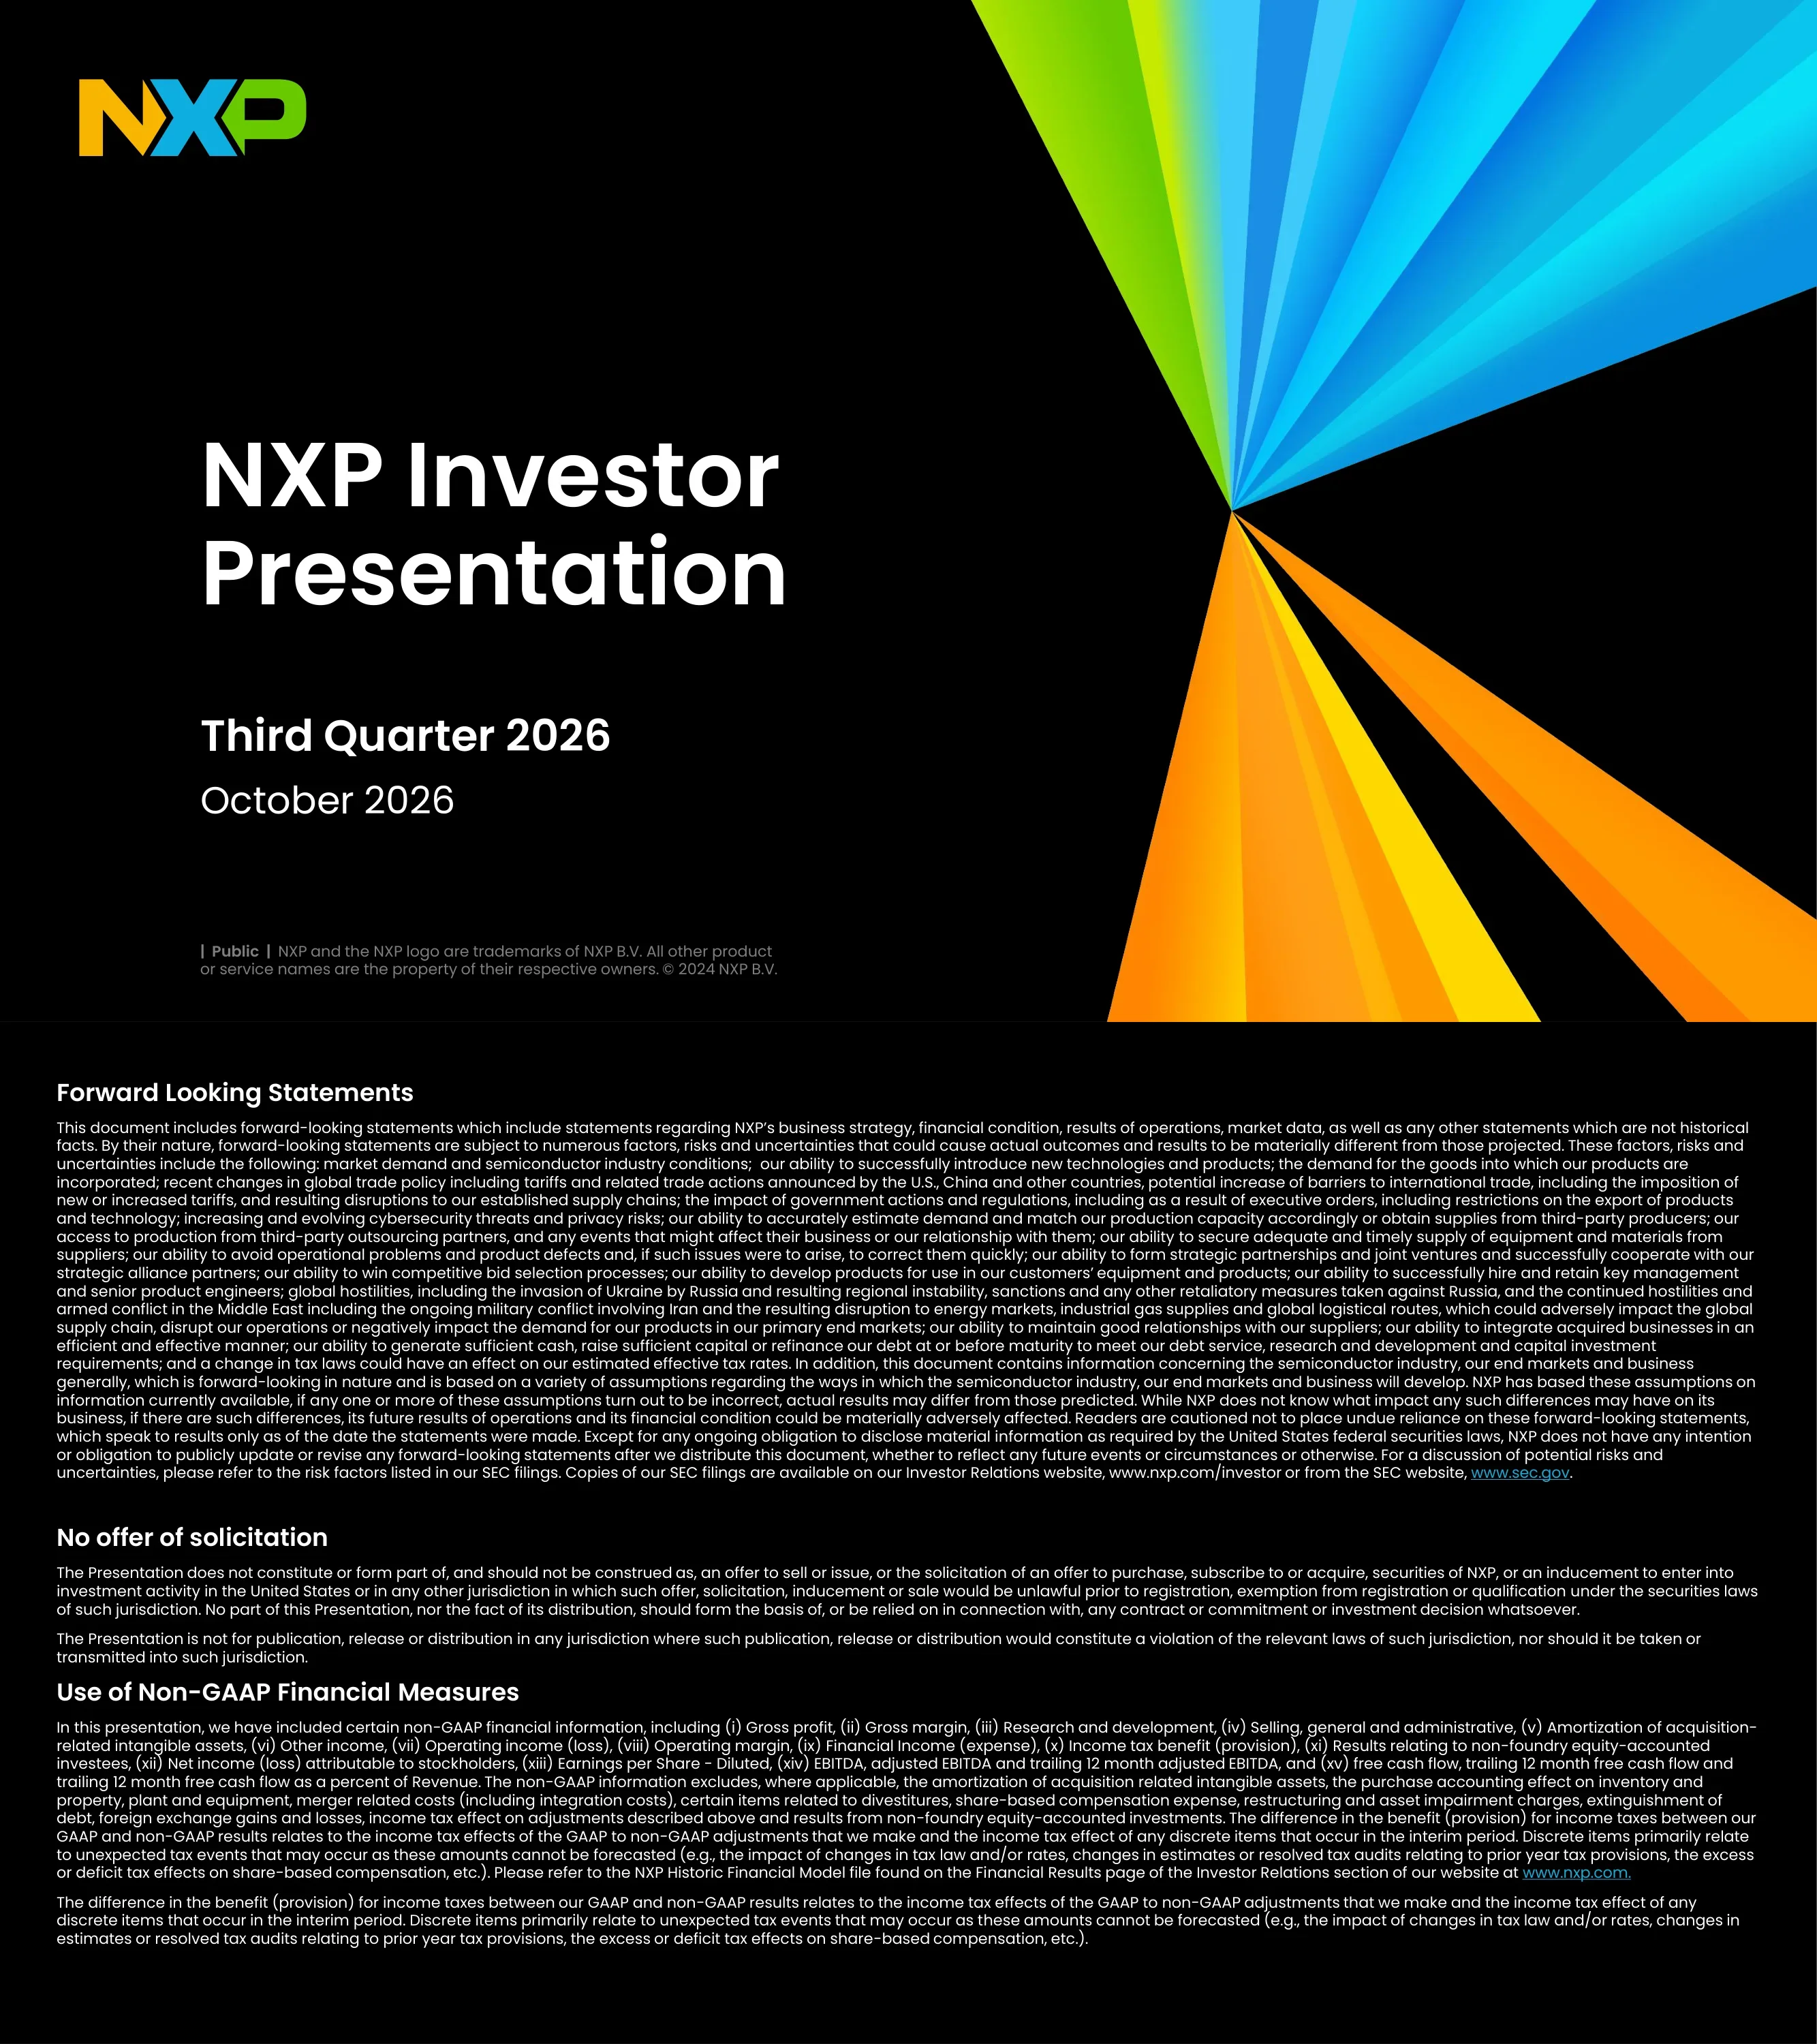
Cover slide titled 'NXP Investor Presentation, Third Quarter 2026, October 2026' with the NXP logo and trademark notice.
Left-aligned white title block on a black background with the NXP logo top-left and a multicolor light-ray burst filling the right half.
Legal disclaimer covering forward-looking statement risks (tariffs and trade policy, export restrictions, supply chain, geopolitical conflicts including Ukraine and the Middle East), a no-offer statement, and the list of non-GAAP measures used with a pointer to the NXP Historic Financial Model file.
Three stacked text sections with bold white headings and dense small body text across the full width.
Three-part value-creation equation: high single digit organic revenue growth (S32 SDV, intelligent systems at the edge) + gross margin expansion above 60% (hybrid manufacturing, mix / NPI) + 100% of excess FCF to owners, adding up to doubling non-GAAP EPS by 2030+ from the 2024 base of $13.09.
Three blue circular icons joined by plus signs, each with a headline and two supporting lines, above a full-width blue result banner.
2010-2025 timeline of annual revenue (from $4.4B in 2010 to a $13.3B peak in 2023 and $12.3B in 2025), non-GAAP operating margin (16.0% to a 36.3% peak in 2022, 33.1% in 2025) and year-end share price ($21 to $217), annotated with the IPO, divestitures, the Freescale merger, the exited Qualcomm deal, Marvell connectivity assets and the TT Tech, Aviva Links and Kinara acquisitions.
Combined chart: blue revenue columns with margin labels, a green share-price line overlaid above, and yellow location-pin milestone callouts; two phase arrows across the top.
Semiconductor market history from 2000 framed as three waves - Analog (PCs, mobiles, consoles), On-demand (smartphones, tablets, data-center servers) and Anticipate & Automate (cloud AI and intelligent edge systems) - heading to a $2 trillion market by 2030E per Omdia.
Bar chart shaded from light to dark blue by era, with a tall hatched arrow to the $2 trillion 2030E figure and application icons on the right.
McKinsey (Nov 2025) view of the semiconductor market growing from $775B in 2024 to ~$1,600B in 2030E (13% CAGR); automotive grows from $75B to $145B (13% CAGR) and industrial from $45B to $85B (11% CAGR). Of the ~$825B growth, Compute & AI contributes 460 (55%), Wireless 150 (18%), Automotive 70 (9%), Wired 70 (9%), Industrial 40 (5%) and Consumer 35 (4%).
Stacked area-to-column chart comparing 2024 and 2030E by vertical, with a separate stacked growth-contribution column on the right.
Maps four industry challenges (ecosystem shifts, increasing complexity, software-defined edge, resilience and sustainability) to NXP's response: complete portfolio (sensing, AI-enabled processing, actuation, connectivity), deep competence (security, functional safety, auto and industrial focus), simplifying (scalable pre-integrated systems) and resilient and sustainable (hybrid manufacturing, carbon neutral by 2035).
Left column of four outlined challenge boxes funneling into a 2x2 grid of navy capability panels with the NXP logo at the center.
Sense-Think-Connect-Act capabilities plus safe and secure, scalable system solutions applied to two focus markets: Automotive (SW-defined vehicle, ADAS, electrification, high-RMS core franchises) and Industrial & IoT (factory automation, building and home, healthcare, power and energy).
Left capability stack in a dark panel; right side has two rows, each a solid colored market tile followed by four outlined application tiles with icons.
R&D investment matrix by relative market share and market growth for 2025-2030: ~15% to sustain leadership, ~40% in high-growth franchises (auto SDV, radar, connectivity), ~40% to build new franchises (intelligent edge and AI NPU processing, auto electrification, software middleware, ASA SerDes) and ~5% de-prioritized; paired with a product-plus-system leadership graphic.
2x2 blue matrix with labeled axes on the left and a circular yin-yang style 'Product Leadership / System Leadership' graphic on the right.
2025 profile: revenue by headquarter region (Americas $3.4B / 27%, EMEA $3.3B / 27%, Asia Pacific ex-China $3.6B / 29%, China $2.0B / 17%); by channel (distribution $7.1B / 57%, direct $5.2B / 43%); front-end sourcing 37% internal / 63% external; back-end sourcing 87% internal / 13% external.
Four blue donut charts arranged in a 2x2 grid with labels outside each segment.
2025 revenue by end market: Automotive 58%, Industrial & IoT 19%, Mobile 13%, Comm Infra 11%. Revenue grows from $11.1B (2021) to $12.6B (2024) and ~$16.0B (2027E), a 6-10% CAGR; accelerated-growth businesses rise from 18% to ~27% to ~38% of revenue (15-25% CAGR) while core businesses grow ~3%.
Large segmented donut with a 'Strategic focus' arc on the left; stacked bar chart for 2021, 2024 and 2027E with CAGR labels on the right.
System complexity is rising (time-to-market 3-5 to 1-2 years, code 100M to 500M lines, in-car data 50 GB to 10 TB, ECU power 30-60W to 50-200W). Unit outlook 2024E to 2027E: LV production 89M to 94M (2% CAGR), SDVs 13M to 42M (48%), ADAS L1-L3 46M to 58M (8%), xEVs 33M to 56M (20%). NXP targets: Auto 8-12%, S32 SDV 20-30%, Radar 15-20%, Electrification 15-20%, Connectivity 10-20% revenue CAGR.
Header row of four metric boxes, a row of unit-CAGR boxes, four stacked China / ROW bar pairs, and outlined NXP revenue-CAGR boxes along the bottom.
Automotive revenue grows from $5.5B (2021) to $7.2B (2024) and ~$9.5B (2027E), an 8-12% CAGR; core businesses fall from 73% to 61% to ~48% of the mix (~3% CAGR) while accelerated drivers (S32 SDV, radar, electrification, connectivity) grow 15-25%. Key assumptions: low single digit SAAR growth and pricing erosion, mid-high single digit content growth, GDP > 2.5% and PMI > 50, manufacturing regionalization, channel inventory at 11 weeks.
Left column of six outlined assumption boxes; right stacked bar chart with a legend and CAGR brackets.
Industrial upgrade-cycle megatrends (productivity, energy efficiency, resilience, everything augmented by AI). Industrial & IoT SAM rises from $36.1B (2024E) to $44.9B (2027E), 7% CAGR overall and 10% in focus segments: factory automation 7.3 to 9.4, home and building 5.5 to 6.9, power and energy 4.6 to 6.8, healthcare 2.5 to 3.2 ($B).
Left flow diagram of three blue benefit tiles, an AI bar and three outlined detail boxes; right stacked column chart with CAGR arrows.
Industrial & IoT revenue moves from $2.4B (2021) to $2.3B (2024) and ~$3.1B (2027E), an 8-12% CAGR; core falls from 78% to 73% to ~61% (~4% CAGR) while accelerated drivers (processing, connectivity, analog and security) grow 20-30%. Assumptions: SAM 7% CAGR, GDP > 2.5% and PMI > 50, regionalization, channel inventory at 11 weeks.
Four outlined assumption boxes on the left and a stacked bar chart with legend and CAGR labels on the right, mirroring page 13.
2024 to 2027E outlook by end market: Automotive $7.2B to ~$9.5B (8-12% CAGR; accelerated ~20%, core ~3%), Industrial & IoT $2.3B to ~$3.1B (8-12%; accelerated ~25%, core ~4%), Mobile $1.5B to ~$1.6B (0-4%), Comm. Infrastructure flat at $1.7B (0%).
Four small two-bar charts in a 2x2 grid, each splitting high-RMS core revenue from accelerated growth drivers, with a shared legend.
Wafer volume (300mm equivalents) grows from ~1.5M (2024) to ~1.9M (2027E) and ~2.3M (2030E), with <=28nm rising from 0.1M to 0.4M. Front-end mix shifts from 38% internal / 62% external (2024) to 20% / 80% by 2030E; back-end internal goes from 86% to 80%. Pillars: 300mm fab investment, 200mm consolidation, internal A&T expansion, geo-risk mitigation via JVs, and advanced node transition.
Three stacked column charts over a faint world-map background, each above an outlined text box describing the strategic benefit.
Top 20 end customers are less than 45% of 2025 revenue, NXP has more than 25,000 customers and no 10% customer; the top 20 are dominated by automotive names, with mobile, industrial and comm-infra customers also present.
Descending bar chart of the top 20 customers, each bar topped by an end-market icon, with a three-line headline and a legend underneath.
2020-2025 annual trends: revenue $8.6B to $12.3B (7% five-year CAGR); non-GAAP gross profit $4.4B to $7.0B (10% CAGR) with margin 51.1% to 56.8%; non-GAAP operating profit $2.2B to $4.1B (13% CAGR) with margin 25.9% to 33.1%; non-GAAP free cash flow $2.1B to $2.4B (3% CAGR), 20% of revenue in 2025.
Four blue bar charts in a 2x2 grid with values inside the bars and margin percentages above.
2020-2025 revenue by end market: Automotive $3.8B to $7.1B (13% five-year CAGR), Industrial & IoT $1.8B to $2.3B (4%), Mobile $1.2B to $1.6B (5%), Communication Infrastructure & Other $1.7B to $1.3B (down 5%).
2x2 grid of blue bar charts drawn to a common scale so relative segment size is visible.
Q3 2025 to Q3 2026: revenue 3,173 / 3,335 / 3,181 / 3,496 / 3,786 $M (Q3 2026 up 8% Q-Q, 19% Y-Y); non-GAAP gross margin 57.0% to 58.6% (gross profit $2,217M); non-GAAP operating margin 33.8% to 37.1% (operating profit $1,406M); non-GAAP free cash flow $509M to $1,206M, a 31.9% FCF margin in Q3 2026.
Four five-quarter bar charts in a 2x2 grid with values in the bars and margins above.
Q3 2026 end-market revenue: Automotive $2,070M (+7% Q-Q, +13% Y-Y), Industrial & IoT $802M (+6% Q-Q, +39% Y-Y), Mobile $411M (+17% Q-Q, -4% Y-Y), Communication Infrastructure & Other $503M (+11% Q-Q, +54% Y-Y), each shown for the five quarters from Q3 2025.
2x2 grid of five-quarter bar charts with growth callouts in the top-right corner of each panel.
Policy: return all excess non-GAAP FCF and target a 25% dividend payout of cash from operations. 2016-2025 cumulative capital return of $22.7B (95% of non-GAAP FCF, 4% 10-year CAGR), including $17.4B of buybacks (77%, 27% reduction in diluted share count) and $5.3B of dividends (23%). Annual return ranged from $0.3B (2017) to $5.1B (2018); 2025 was $1.9B.
Stacked dividend / repurchase bar chart with cumulative-return dots on the left; bulleted policy and statistics on the right.
Maturity ladder of senior unsecured notes and EIB loans from 2027 to 2051. At 3Q26: book debt $10,978M, cash and short-term deposits $3,943M, net debt $7,035M, TTM adjusted EBITDA $5,421M, average cost of debt 3.88%, gross leverage 2.0x, net leverage 1.3x, EBITDA to net interest 16.3x. Q3 net interest expense was $(74)M.
Stacked maturity bar chart by year with a color-coded legend of notes, above a bordered leverage table at bottom-left.
Q3 2025 to Q3 2026: DSO 31 / 29 / 34 / 33 / 30; DPO 58 / 60 / 59 / 60 / 62; DIO 161 / 154 / 165 / 156 / 148; cash conversion cycle 134 / 123 / 140 / 129 / 116 days, with formulas for each ratio.
Four five-quarter bar charts in a 2x2 grid with formula definitions centered beneath.
Compares Investor Day 2021 targets, 2024 actuals and Investor Day 2024 targets: growth +8-12% / 4.5% / +6-10% (3-year CAGR); channel inventory ~11 / 8 / ~11 weeks; non-GAAP gross margin 55-58% / 58.1% / 57-63%; R&D ~16% / 16.3% / ~16%; SG&A ~7% / 7.2% / ~7%; operating margin 32-36% / 34.6% / 34-40%; tax rate 15-18% / 16.8% / 17-18%; ESMC + VSMC equity losses ~$(200)M for 2025-2027.
Three-column comparison table with the Investor Day 2024 column in blue and key rows outlined in gold.
Investor Day 2021 vs 2024 actuals vs Investor Day 2024: non-GAAP FCF 25% / 19.5% / >25% of revenue; DIO ~95 / 151 / ~110; VSMC capacity access fee N/A / $275M / $800M; net capex 6-8% / 6.6% / <5%; SBC ~3% of revenue target; ESMC / VSMC equity investments ~$1.7B; dividend ~25% of CFO; buybacks below 2.0x net leverage; capital return 100% of FCF.
Same three-column comparison table format as page 26 with gold-outlined key rows.
Q4 2026 guidance: revenue $3,750M / $3,850M / $3,950M (low / mid / high; -1% to +4% Q-Q, +12% to +18% Y-Y). Non-GAAP gross margin 58.5% / 59.0% / 59.5%, non-GAAP operating margin 36.6% / 37.5% / 38.3%, non-GAAP diluted EPS $4.14 / $4.36 / $4.58 on 253.8M shares; GAAP EPS $3.36 / $3.57 / $3.79 and GAAP gross margin 57.6-58.7%. Non-GAAP tax rate 17-18%.
Financial table with GAAP, Reconciliation and Non-GAAP column groups, numbered footnotes and a small-print guidance disclaimer.
Strategy, guiding principles and goals across innovation, environmental, social and governance pillars, including carbon neutral by 2035, 55% Scope 1 and 2 reduction by 2030, 35% Scope 3 reduction by 2033, and by 2027 a 35% Scope 1 and 2 reduction, 50% renewable electricity, 60% water recycled and 90% waste recycled.
Four-row grid with an icon column (lightbulb, globe-in-hand, people, handshake) and three text columns of white-bordered cells.
2025 emissions down from 2024: Scope 1 -19%, Scope 2 -8%, Scope 3 -11%. Other progress: renewable energy at 47%, PFC abatement at 4 sites, ISO 14001 / ISO 45001 recertification, limited assurance on Scope 1 and 2, 96% of staff trained on sustainability, 93% see NXP as committed to ethics, inaugural Climate Transition Plan, waste and water goals exceeded, 100% conflict-free 3TG smelters.
Three illustrated scope panels on the left and a 3x3 'Additional Progress' grid on the right.
2020-2025 ESG ratings: MSCI from BB to AAA (AAA since 2022); Sustainalytics risk score from 19.4 to 16.0 (Low Risk, 21.6 Medium Risk in 2022); CDP Climate D to B and Water D to B; ISS ESG C+ Prime to B- Prime.
Rating-agency logos stacked in a left column with a matching row of labeled bars per agency by year.
2020-2025 GAAP income statement: revenue 8,612 to 12,269 (13,276 peak in 2023); gross profit 6,716 in 2025; operating income 3,047 in 2025; net income attributable to stockholders 2,021; diluted EPS $7.95 in 2025 (vs $9.73 in 2024 and $10.70 in 2023); diluted shares 254.3M.
Full-width financial table with a blue year header row and bold subtotal rows.
2020-2025 bridge: non-GAAP gross profit 4,400 to 6,966 (margin 51.1% to 56.8% vs GAAP 49.2% to 54.7%); non-GAAP operating income 2,228 to 4,064 (margin 25.9% to 33.1% vs GAAP 4.9% to 24.8%), with 2025 operating adjustments of (1,017).
Single reconciliation table in the upper half of the slide with indented adjustment rows.
2020-2025 cash flow: operating cash flow 2,482 to 2,820 (3,895 peak in 2022); net capex (388) to (395); non-GAAP free cash flow 2,094 / 2,311 / 2,834 / 2,687 / 2,089 / 2,425, or 24% / 21% / 22% / 20% / 17% / 20% of revenue; year-end cash 3,267 in 2025.
Two stacked tables: summary cash flow statement above, free cash flow derivation below.
Net income to EBITDA bridge for 2020-2025: non-GAAP EBITDA 3,809 and non-GAAP adjusted EBITDA 4,727 in 2025 (peak 5,469 in 2022), after adding back restructuring (261), stock-based compensation (462) and other items.
Long reconciliation table with two sub-sections and a footnote row.
Q3 2025 to Q3 2026 GAAP results: Q3 2026 revenue 3,786, gross profit 2,189, R&D (615), SG&A (313), operating income 1,228, net income attributable to stockholders 884 and diluted EPS $3.48 (vs $2.48 in Q3 2025). Q1 2026 included 621 of other income, lifting EPS to $4.43.
Five-quarter financial table with blue quarter headers and bold subtotal rows.
Five-quarter bridge: Q3 2026 non-GAAP gross profit 2,217, non-GAAP operating income 1,406, non-GAAP net income 1,065 and non-GAAP diluted EPS $4.20 (vs $3.11 in Q3 2025 and $3.61 in Q2 2026), with adjustments for PPA (36), share-based compensation (114) and other incidentals (33).
Two side-by-side reconciliation tables in a dense grid layout.
Operating cash flow 585 / 891 / 793 / 860 / 1,256 and net capex (76) / (98) / (79) / (69) / (50) give non-GAAP free cash flow of 509 / 793 / 714 / 791 / 1,206 from Q3 2025 to Q3 2026; trailing 12-month FCF reaches 3,504, or 25% of revenue. Quarter-end cash was 3,222.
Two stacked five-quarter tables: cash flow summary and FCF derivation.
Q3 2026 net income 899, non-GAAP EBITDA 1,416 and non-GAAP adjusted EBITDA 1,547 (from 1,232 in Q3 2025); trailing 12-month adjusted EBITDA rises from 4,648 to 5,421. Q1 2026 other incidental items of (605) are removed.
Five-quarter reconciliation table with section headers and a footnote row.
Repeats the page 3 thesis to close: high single digit organic revenue growth + gross margin expansion above 60% + 100% of excess FCF to owners, leading to doubling non-GAAP EPS by 2030+ from 2024's $13.09.
Identical to page 3: three blue icon circles joined by plus signs above a blue summary banner.
Back cover with the NXP logo, an nxp.com pill button and the trademark notice.
Large logo left-of-center on black with the multicolor light-ray burst on the right, mirroring the cover.
Common questions about this slide and the underlying presentation content.
NXP reported Q3 2026 revenue of $3,786 million, up 8% quarter-on-quarter and 19% year-on-year. Non-GAAP gross margin was 58.6%, non-GAAP operating margin 37.1% ($1,406 million), non-GAAP free cash flow $1,206 million (31.9% of revenue) and non-GAAP diluted EPS $4.20; GAAP diluted EPS was $3.48.
Page 28 guides Q4 2026 revenue to $3,750-$3,950 million (midpoint $3,850 million, up 15% year-on-year), non-GAAP gross margin of 58.5-59.5%, non-GAAP operating margin of 36.6-38.3% and non-GAAP diluted EPS of $4.14-$4.58 (midpoint $4.36).
Communication Infrastructure & Other grew 54% year-on-year to $503 million and Industrial & IoT grew 39% to $802 million. Automotive, still the largest segment, rose 13% to $2,070 million, while Mobile fell 4% year-on-year to $411 million despite a 17% sequential increase.
The Analyst Day 2024 model shown on pages 11, 26 and 27 targets 6-10% revenue CAGR from 2024 to 2027 (to about $16.0 billion), 57-63% non-GAAP gross margin, 34-40% non-GAAP operating margin, free cash flow above 25% of revenue and return of 100% of free cash flow. Pages 3 and 40 add the aim of doubling non-GAAP EPS from 2024's $13.09 by 2030+.
Page 24 shows $10,978 million of debt, $3,943 million of cash and short-term deposits, $7,035 million of net debt and trailing 12-month adjusted EBITDA of $5,421 million, for 2.0x gross and 1.3x net leverage at an average cost of debt of 3.88%.
Yes. The page offers the original 41-page PDF plus a PPTX version converted from it, so you can reuse the layouts. The PPTX is a machine conversion, so check fonts and chart alignment before presenting.
Yes. It follows the standard public-company earnings structure: thesis, strategy and market slides, quarterly trends, segment breakdown, capital return, debt, financial model, guidance, ESG and a GAAP to non-GAAP appendix. Its dark background, blue bar charts and comparison tables are easy to adapt to other companies.
NXP Semiconductors N.V. published it on its investor relations website on October 27, 2026 with its third-quarter 2026 earnings release. The figures are company-reported and the non-GAAP measures are reconciled in the appendix (pages 32-39).
Original earnings presentation published October 27, 2026
Earnings releases, SEC filings and the NXP Historic Financial Model

Create Your Own Slides
Turn your ideas into professional presentations in seconds with 2slides AI.
Reference professional designs, choose your style, and generate slides with perfect text rendering. Powered by Nano Banana—start creating your presentation now.
Your AI Agent for slides. Save time, shine faster with intelligent presentation creation.


© 2026 2slides. All rights reserved.