
Part of Investor presentation examples · Indian investor presentation examples
Union Bank of India's Investor Presentation for Q2 FY2027 (quarter ended 30 September 2026), themed "Business First, Compliance Always" and marking 107 years of legacy, dated 19.10.2026 and filed with the Indian stock exchanges.
Uses this deck’s cover as a style reference for slides made from your own content. Or pick any page below to use its layout as the reference.
Quick Navigation
Tags
Share the slides
Union Bank of India's Investor Presentation for Q2 FY2027 (quarter ended 30 September 2026), themed "Business First, Compliance Always" and marking 107 years of legacy, dated 19.10.2026 and filed with the Indian stock exchanges.
Detailed view of each slide page, including layout, key content and visual elements.
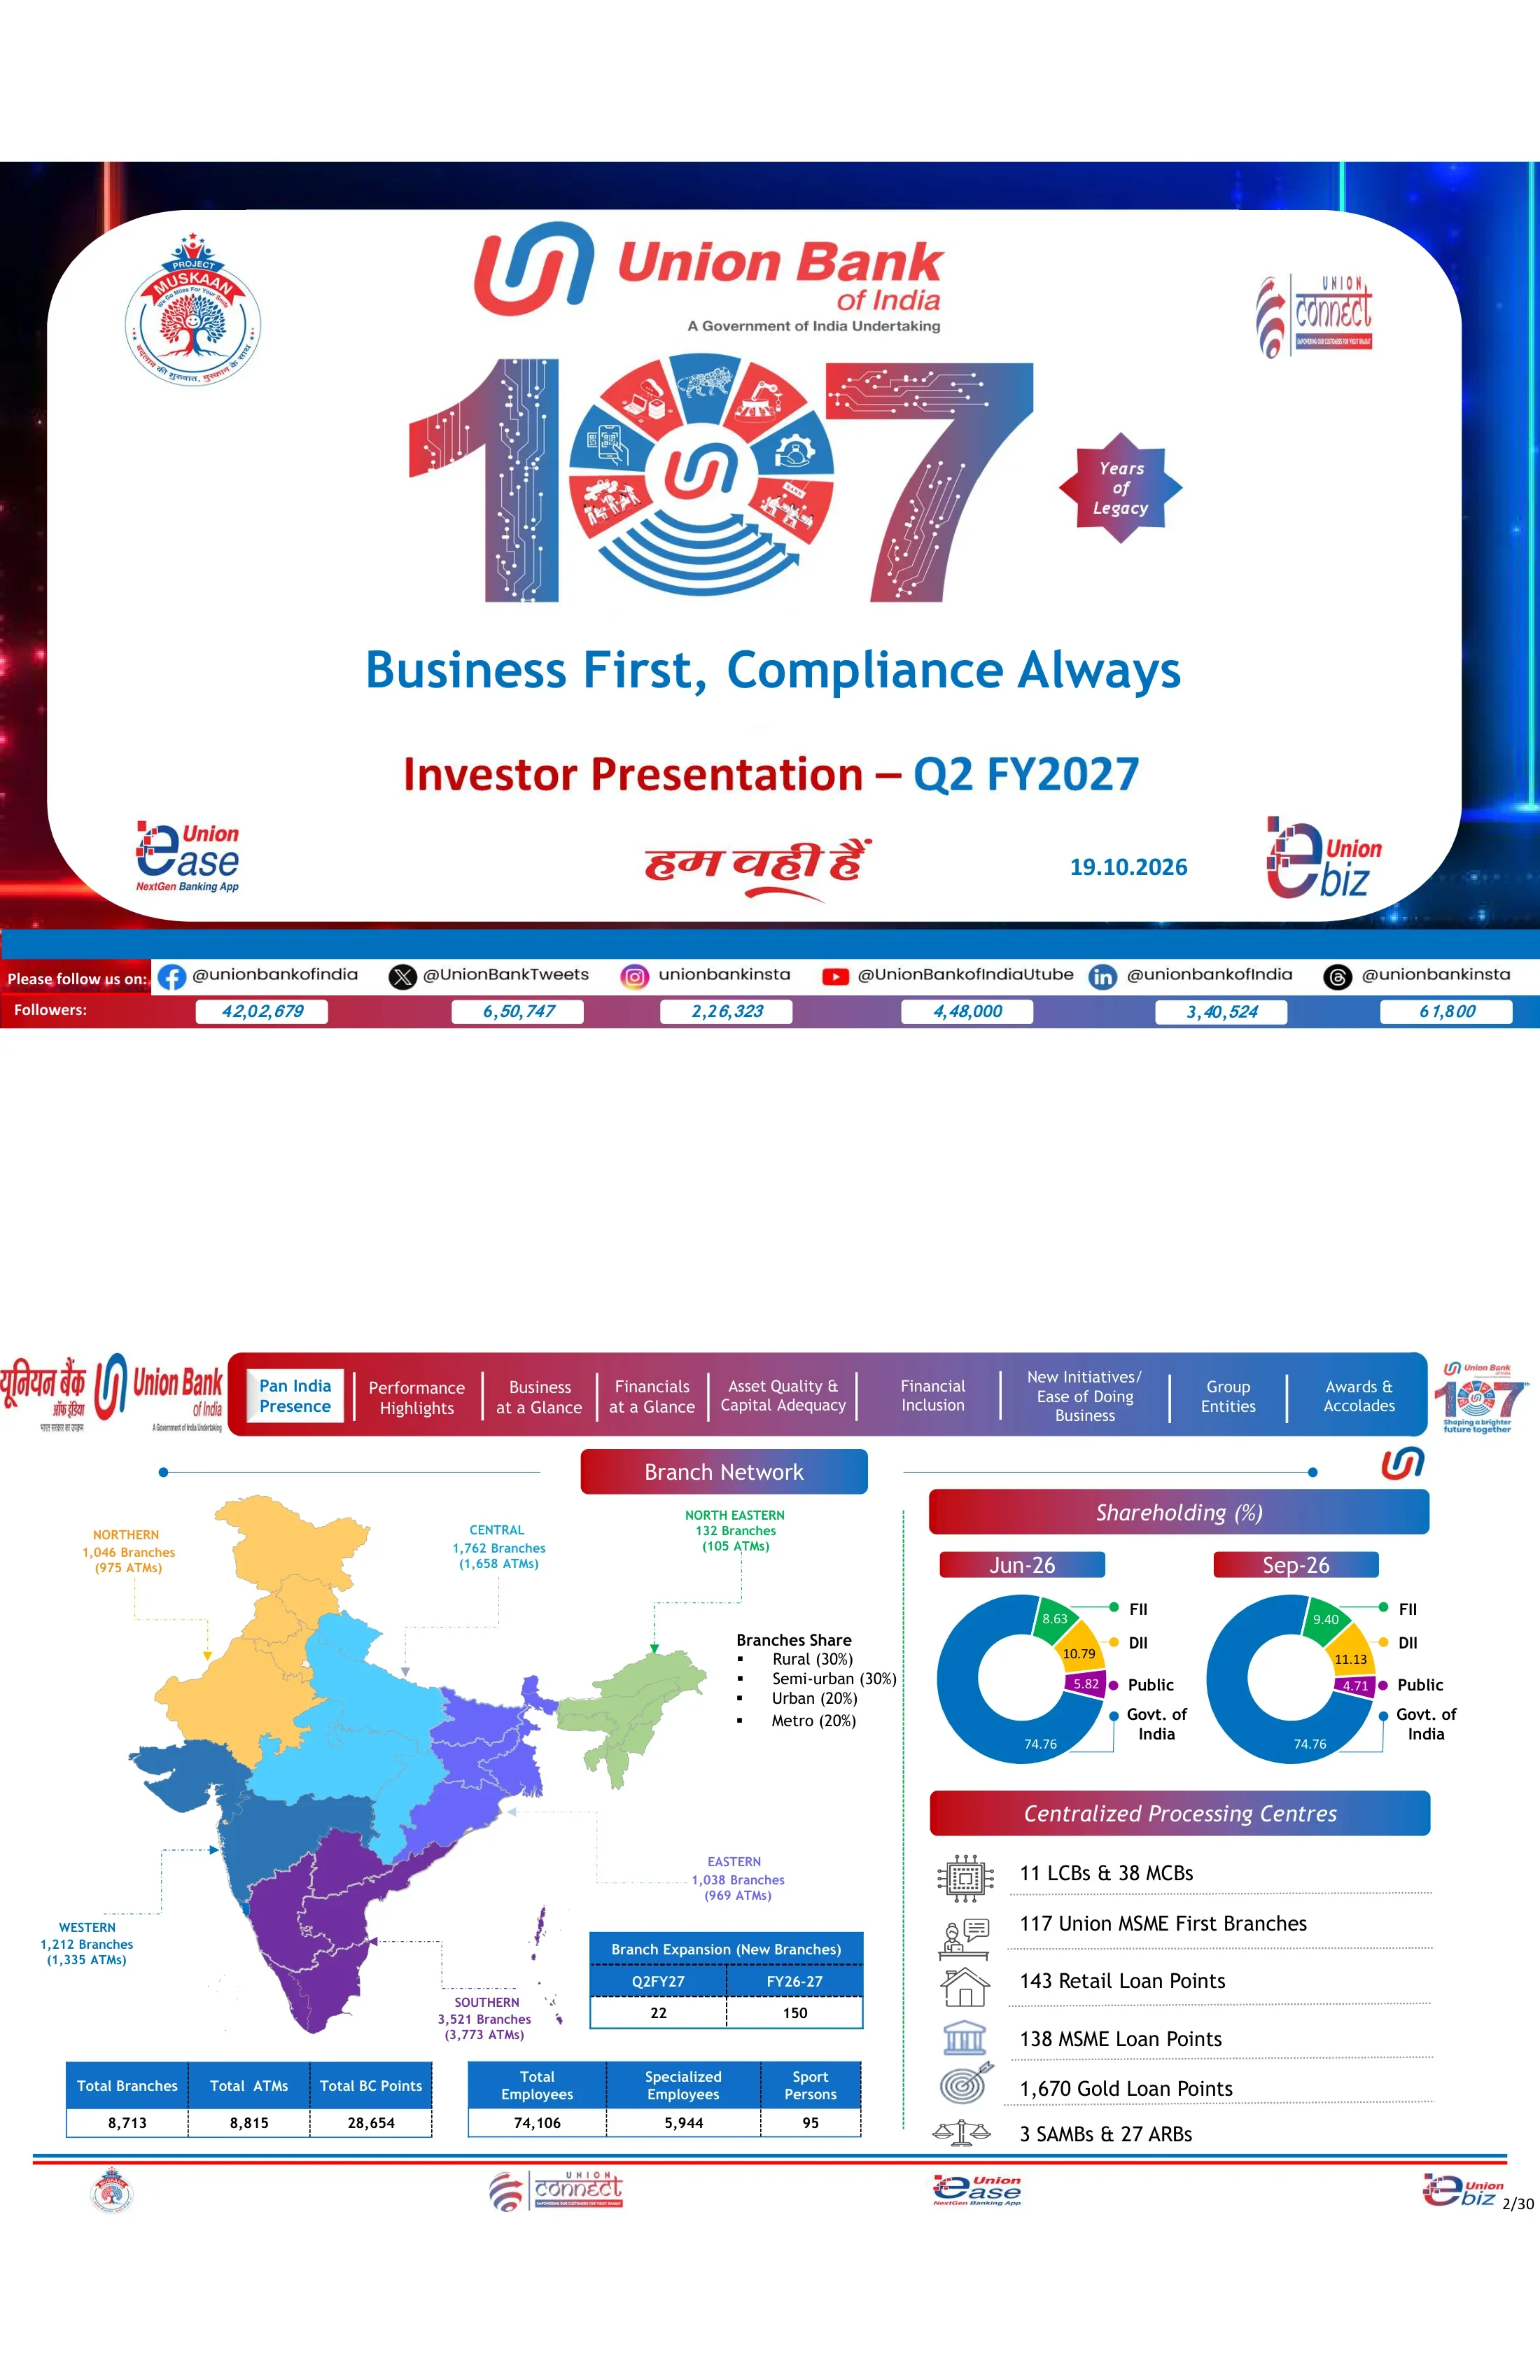
Cover slide with the Union Bank of India logo ('A Government of India Undertaking'), a large '107 Years of Legacy' graphic, the tagline 'Business First, Compliance Always' and the date 19.10.2026. A footer strip lists the bank's social media handles and follower counts, for example 42,02,679 on Facebook.
Rounded white card set on a dark blue-and-red glowing background. The centred '107' numeral graphic sits above the stacked title text, with brand app logos (Project Muskaan, Union Connect, Union Ease, Union eBiz) in the corners and a gradient social-follower bar along the bottom.
8,713 branches, 8,815 ATMs and 28,654 BC points across six regions (Southern has the most with 3,521 branches), served by 74,106 employees. The branch mix is 30% rural, 30% semi-urban, 20% urban and 20% metro; 22 new branches opened in Q2 FY27. The Government of India holds 74.76%, FII holding rose to 9.40% and DII to 11.13% at Sep-26. Centralized processing includes 11 LCBs & 38 MCBs, 117 Union MSME First branches and 1,670 gold loan points.
Left half shows a colour-coded India map with regional call-outs and summary tables underneath. The right half holds two donut charts comparing Jun-26 and Sep-26 shareholding, above an icon list of centralized processing centres.
Global business reached ₹24,75,330 crore (+12.01% YoY): deposits of ₹13,19,455 crore (+6.87%) and advances of ₹11,55,876 crore (+18.53%). RAM advances grew 14.65% to ₹6,35,527 crore, MSME 22.39% and overseas advances 52.19%. CASA was ₹4,60,728 crore with a domestic CASA ratio of 34.93% (+237 bps YoY); the global CD ratio was 88.13%.
Full-width 11-row data table with a blue header. It compares Sep-25, Jun-26 and Sep-26 balances alongside absolute and percentage YoY and QoQ growth columns, with green and red arrows marking direction.
Gross deposits grew 6.87% YoY and gross advances 18.53%. CRAR was 17.94% and CET-1 16.05%. Quarterly operating profit was ₹8,108 crore (+18.99%), net profit ₹5,537 crore (+30.31%), NII ₹10,583 crore (+20.09%) and credit cost 0.21%. For H1 FY27, net profit was ₹10,870 crore against ₹8,365 crore a year earlier, and NII ₹20,620 crore against ₹17,925 crore.
Six-tile KPI grid in two rows (Deposits, Advances, Capital, Profit, Net Interest Income, Efficiency). Each tile has a coloured header bar, an icon, headline figures with a direction arrow, and Sep-26(6M) vs Sep-25(6M) comparison pills below.
NIM was 2.86% (+19 bps YoY), or 3.03% adjusted for tax refund. GNPA fell 87 bps to 2.42%, NNPA was 0.42% and PCR 95.20%. RoA was 1.38% (+22 bps), core RoA 1.03%, RoE 17.21% (+213 bps), RoRWA 2.78%, and book value per share rose 14.16% to ₹168.61. H1 RoE was 16.89% against 14.84% a year earlier.
Same six-tile grid as the previous slide (NIM, adjusted NIM, Asset Quality, RoA, RoE, RoRWA), with headline figures and two-period comparison pills under each tile.
Nine-quarter trend lines from Sep-24 to Sep-26 for operating profit (to ₹8,108 crore), net profit (from ₹4,720 crore to ₹5,537 crore), NII (to ₹10,583 crore), RoA/RoRWA, RoE (17.21%) and EPS (₹29.01). Annual chips show net profit of ₹18,697 crore for FY-26 and ₹10,870 crore for H1FY27, and EPS of 28.48 for H1FY27.
2×3 grid of dashed-border chart panels. Each panel has a tab-style title and a line chart whose Sep-24, Sep-25 and Sep-26 values are highlighted in green bubbles, with a row of five FY/H1 summary chips beneath.
GNPA fell from ₹40,499 crore (Sep-24) to ₹27,916 crore, a ₹12,583 crore reduction, and NNPA from ₹8,759 crore to ₹4,768 crore. GNPA% improved from 4.36% to 2.42% and NNPA% from 0.98% to 0.42%. PCR rose to 95.20%, credit cost fell to 0.21% and the slippage ratio to 0.72%.
2×3 grid of line-chart panels with annotated improvement notes (in bps since Sep-24 and Sep-25) in the corners, and FY/H1 chips under the bottom row.
The credit/deposit ratio rose to 88.13% globally and 84.34% domestically. The two-year CAGR of global advances increased from 7.29% to 11.55%, and of RAM from 8.88% to 10.01%. RAM makes up 55% of the global mix and 57% of the domestic mix. Retail bureau scores show 99.8% of borrowers at 700 or above.
Left column has two solid colour blocks (a blue CD-ratio card and a purple 2Y-CAGR card) with white value boxes. The centre stacks two RAM vs LC & Others line charts, and the right shows a four-line retail bureau score chart with a bracket call-out.
At Sep-26 the retail portfolio was ~₹2.65 lakh crore (23.99% of domestic advances), agriculture ~₹1.90 lakh crore (17.17%) and MSME ~₹1.80 lakh crore (16.31%). Home loans are 43.07% of retail at ₹1,14,276 crore, farm credit is 79.36% of agriculture, and micro enterprises are 52.02% of MSME.
Three equal columns, one per segment. Each has a gradient label, a large ₹ lakh crore headline and share-of-advances percentage, a five-quarter breakdown table, and a small trend line chart at the bottom.
Seven key sectors made up 38.50% of domestic advances (₹4,25,712 crore) at Sep-26. NBFCs & HFCs were ₹1,76,300 crore (15.94%) and infrastructure ₹1,21,269 crore (10.97%), of which power was ₹62,099 crore and roads ₹46,640 crore. Corporate loans above ₹25 crore were 94.6% BBB or better, and 99.6% of standard NBFC exposure was rated A or above.
Left two-thirds holds a sector exposure table with an infrastructure sub-table below it. The right third stacks two dashed-border line charts for the corporate and NBFC rating profiles, each with a bracket percentage call-out.
Global deposits were ₹13,19,455 crore (+6.87% YoY) and the domestic CASA ratio was 34.93% (+237 bps YoY). The two-year deposit CAGR was 3.07% globally and 4.36% domestically; average LCR was 120.00% and NSFR 115.58%. CASA plus retail TD grew 11.42%, savings deposits 11.89% and CASA 14.65% YoY.
Top row has a five-quarter deposit table with two small side tables (2Y CAGR, liquidity). The bottom row has three line-chart panels (composition, savings, CASA), each with a bracketed YoY growth label.
Domestic investments were ₹3,35,814 crore at Sep-26, with SLR rising to 81% of the book (₹2,71,174 crore) and non-SLR at ₹64,640 crore. HTM SLR was ₹2,25,279 crore. Modified duration was 4.94 for SLR and 2.77 for non-SLR. Composition details show bonds & debentures of ₹53,260 crore.
Left side has a blue banner of quarterly totals over an SLR/non-SLR mix line chart, above a large HTM/AFS/FVTPL table with blue ₹ columns and purple M-duration columns. The right side holds a composition table.
Interest income rose to ₹28,158 crore (+7.51% YoY) and NII to ₹10,583 crore (+20.09%). Fee income was ₹3,210 crore, while treasury income fell 34.60%. Operating profit was ₹8,108 crore, provisions ₹2,570 crore and net profit ₹5,537 crore (+30.31% YoY, +3.84% QoQ). For H1 FY27, net profit was ₹10,870 crore (+29.95%) and fee income grew 22.90%.
Full-width P&L table with five quarterly columns, YoY and QoQ percentage columns and half-year columns. Key rows (NII, non-interest income, operating profit, net profit) are shaded light blue and bold, with green and red arrows.
Total provisions were ₹2,570 crore in Q2 FY27, including NPA provisions of ₹596 crore and tax of ₹1,870 crore; credit cost was 0.21%. Additional standard-asset provisions of ₹700 crore (March 2026), ₹100 crore (June 2026) and ₹200 crore (September 2026) add up to ₹1,000 crore set aside to strengthen the balance sheet. This amount is excluded from PCR and CRAR.
Left provisions table with a highlighted total row. The right side stacks two line-chart panels for credit cost and quarterly provisions, the second carrying a text note.
Quarterly global and domestic trends for cost of funds (4.34–4.39% in Sep-26), yield on funds, NIM (domestic 2.95%, global 2.86%), cost of deposits (5.01%), yield on advances (7.90–8.01%) and yield on investments. H1FY27 chips show CoF at 4.38%, CoD at 5.03% and NIM at 2.83%.
2×3 grid of dual-line (global vs domestic) charts, each with legend chips and a row of five FY/H1 summary chips underneath.
Cost-to-income was 46.78% in Q2 (46.07% for H1FY27). Quarterly EPS was ₹29.01 and P/E 5.88. Business per branch was ₹284.10 crore, operating profit per branch ₹3.72 crore (annualized) and book value per share ₹168.61, with price-to-book at 1.01.
2×3 grid of chart panels. The top row has single-line charts with FY/H1 chips; the bottom row has paired two-series charts (per branch vs per employee, BVPS vs P/B).
Gross NPA opened Q2 at ₹29,093 crore. Additions were ₹1,909 crore (fresh slippages ₹1,856 crore) and reductions ₹3,086 crore (cash recovery ₹1,226 crore, write-offs ₹1,544 crore), leaving a closing balance of ₹27,916 crore. Total recovery including TWO was ₹2,692 crore, the delinquency ratio 0.72% and PCR 95.20%.
Single full-width roll-forward table with five quarterly columns and two half-year columns. Opening, additions, reductions and closing rows are shaded, and sub-items are italic.
Q2 slippages were ₹1,909 crore: retail ₹352 crore, agriculture ₹627 crore, MSME ₹803 crore and large corporates ₹127 crore. Gross sectoral NPA fell to 0.84% for retail, 6.86% for agriculture, 3.74% for MSME and 1.14% for large corporates, giving 2.42% overall.
Wide three-block table (slippages, outstanding NPA, gross sectoral NPA %) over five quarters each. Segment total rows are in blue text, with sub-segment rows beneath.
The restructured book under RF 1.0 fell to ₹3,701 crore and under RF 2.0 to ₹2,790 crore by Sep-26. SMA exposure above ₹5 crore dropped from ₹5,634 crore (Sep-25) to ₹2,282 crore, with SMA-2 at ₹1,338 crore.
Two stacked full-width tables: restructuring by segment under RF 1.0 and RF 2.0, then SMA-0/1/2 outstanding over five quarters. Each has a highlighted total row.
CRAR was 17.94%, CET-1 16.05% and Tier II 1.12% at Sep-26. Total capital was ₹1,43,185 crore on RWA of ₹7,98,059 crore. Tier-II bonds are rated AAA/Stable by CRISIL, ICRA, India Ratings, CARE and Brickwork; international issuer ratings are S&P BBB/Stable and Fitch BBB-/Stable, and the ESG rating is CareEdge-ESG 1+. The board-approved FY27 capital plan is ₹8,000 crore.
Left half has a CRAR/CET-1/Tier II line chart with CRAR chips, a capital table and total capital chips. The right half stacks rating tables (domestic, international, ESG) and a capital-plan table under gradient labels.
Government scheme lending includes the Union Guaranteed Emergency Credit Line (4,39,246 accounts, ₹31,860 crore), PM Mudra in Q2 (₹6,174 crore) and PM SVANidhi (11,65,488 accounts). PMJDY accounts grew to 349 lakh with balances of ₹16,671 crore. Social security enrolments reached 392 lakh for PMSBY, 107 lakh for PMJJBY and 63 lakh for APY.
Top row has a government schemes table and a PMSBY/PMJJBY claim-settlement table. Below a dashed green divider sit two line-chart panels for PMJDY accounts and social security schemes.
Union Sudarshan is described as the bank's first centralized, fully automated banking intelligence hub. It monitors business, operations, risk, compliance, cyber security and technology 24×7, using 7 pillars and 240+ use cases. It runs on a hub-and-spoke model (hub in Mumbai with 75 staff; spokes in Mumbai, Hyderabad, Mangalore and Bengaluru with 64 staff), was developed in-house, runs 100% on-premises and has an AI-agent roadmap.
Bordered definition box at the top. Below are three columns (hub-and-spoke diagram, bullet list of key highlights, bullet list of strategic benefits) and a circular Sudarshan emblem, with four dashboard screenshots along the bottom.
Fourteen numbered initiatives grouped into four themes. Customer Experience covers Customer 360, the credit card dashboard, quick remittance and smart lock/kill switch. Seamless Digital Journeys covers STP gold loan, STP dairy loan, self-serve FD, CA opening via NeSL and Insta OD. Data & Insights covers Geo Intelligence and My-Diary. Governance & Upskilling covers office-note automation, credit proposal tracking and e-learning.
Four rounded quadrant panels tinted light blue, pink, green and lavender. Each has a theme icon and subtitle, and a row of numbered circular badges over short description cards.
Digital business generated in Q2 FY27 included ₹740 crore+ in retail loans (+23% QoQ), ₹150 crore+ in agriculture (+79%), ₹490 crore+ in MSME loans (+53%) and ₹7,100 crore+ in deposits (+9%). Over 9,40,000 digital CASA accounts were opened, and Union Ease added 10 lakh+ new users, alongside 50,000+ CBDC users.
Left column has two gradient blue-purple checklist panels of digital initiatives. The right panel is split into three gradient-banded rows (Digital Business, Liability Journeys, Channels), each with circular icons and large figures.
Three pillars (CASA acquisition, transaction banking, wealth management) run across an Institutional Business arm (government banking, anchor relationships, payment integration, new-age flows such as programmable CBDC) and a Retail Business arm (salary banking, premium savings, pension and mandates). The flow runs 'Acquire the relationship → Capture the flows → Deepen the ecosystem → Build long-term value', supported by 10 ecosystem hubs and 118 business centres.
Three pillar cards across the top, with a red Institutional block and a blue Retail block below, each holding six icon cards. A red arrow-flow banner and a location footer bar sit at the bottom.
Union Bank's eight group entities and their Q2FY27 net profit in ₹ crore. Five are 100% subsidiaries, including Union Asset Management (AUM ₹28,029 crore, net profit 10.99) and UBI Services (13.63). The JVs are Star Union Dai-ichi Life Insurance (25.10%, net profit 15.59) and ASREC (27.30%), and the associate is Andhra Pradesh Grameena Bank (35%, net profit 601.72, the bank's share 210.60).
2×4 card grid in light blue. Each card shows a large ownership percentage, entity type, name, bullet description and a small dashed net-profit table, with a red '8 GROUP ENTITIES' pill at the top right.
Six photo panels of recognitions. These include a 'Best Retail Bank of India' certificate at the Navbharat BFSI conclave (9 September 2026), an excellence award under the PMFME scheme from MoFPI (25 August 2026) and 3rd rank in EASE 9.0 Q1FY27 among 12 PSBs. Hindi captions cover the bank's Rajbhasha (official language) awards and the release of its book 'Business First, Compliance Always'.
2×3 grid that pairs each event photo or chart image with a justified caption block in English or Hindi, separated by dashed green lines.
A full-bleed banner congratulating employee Rutuja Pisal, a member of the Indian women's hockey team, on the team's gold medal at the Asian Games 'after 44 years'.
Single framed hero banner filling the content area: an athlete portrait on the left and stacked bold display typography on the right, over a stadium and skyline background.
Photo of the bell-ringing ceremony at NSE IX for Union Bank's maiden foreign currency bond issue: USD 300 Mn at 5.230% maturing 28 Aug 2029, and USD 300 Mn at 5.417% maturing 28 Aug 2031, rated Fitch BBB- and S&P BBB.
Single framed full-width event photograph under the tab navigation bar.
Forward-looking statements disclaimer, a 'Thank You' box, an investor feedback link and QR code, and the investor relations email (investor.relations@unionbankofindia.bank.in), repeated above the social-media follower strip.
Bilingual logo header at the top with emblem badges, a blue-bordered disclaimer box in the middle, and paired 'Thank You' and contact boxes above the gradient follower strip.
Common questions about this slide and the underlying presentation content.
For the quarter ended 30 September 2026, net profit was ₹5,537 crore (up 30.31% YoY), net interest income ₹10,583 crore (up 20.09%) and operating profit ₹8,108 crore (up 18.99%). Global business reached ₹24,75,330 crore, with advances up 18.53% and deposits up 6.87%. GNPA improved to 2.42%, NNPA to 0.42%, PCR was 95.20%, CRAR 17.94% and RoE 17.21%. For H1 FY27, net profit was ₹10,870 crore.
Indian banks follow an April–March fiscal year, so FY27 runs from April 2026 to March 2027 and Q2 FY27 covers July to September 2026. The deck compares Sep-26 figures with Sep-25 (YoY) and Jun-26 (QoQ), and shows H1 FY27 (April–September 2026) against H1 FY26.
Yes. The page offers the original PDF of the investor presentation plus an editable PPTX converted from that PDF. You can reuse the tables, chart panels and tab-navigation layout in PowerPoint, Keynote or Google Slides. Since the PPTX is a conversion, some charts may come through as images or shapes rather than native chart objects.
It is Union Bank of India's own investor presentation, published in English and filed with the Indian stock exchanges (BSE/NSE) as a disclosure under SEBI Listing Regulation 30. The source file is on BSE's corporate filings site. The exchange cover letter has been removed, so page 1 here is the deck's own cover.
According to the deck, GNPA fell from ₹40,499 crore (4.36%) in Sep-24 to ₹27,916 crore (2.42%) in Sep-26, and NNPA from 0.98% to 0.42%. PCR rose to 95.20%, the Q2 slippage ratio was 0.72%, and SMA exposure above ₹5 crore fell to ₹2,282 crore. The bank also built a ₹1,000 crore additional standard-asset buffer over three quarters.
Every content slide shares a red-to-blue gradient tab bar with nine section tabs, and the active section is highlighted in white. Section titles sit in gradient pills, line charts mark key points with green bubbles, and FY/H1 summary chips run under the charts. KPI pages use six-tile grids. The deck also mixes dense ₹ crore tables with infographic slides, such as a hub-and-spoke diagram, a 14-initiative quadrant grid and a group-entity card grid.
Upload your quarterly results data or a draft PDF to 2Slides and ask for an investor presentation in this style: a section tab bar, KPI tile grids, trend charts with summary chips, and P&L, NPA and capital tables. You can also use 'Create Slides Like This' with this deck as the reference to copy its red-blue gradient look and layout rhythm, then edit the numbers and export to PPTX.
Exchange filing; first page is the cover letter to the exchange

Create Your Own Slides
Turn your ideas into professional presentations in seconds with 2slides AI.
Reference professional designs, choose your style, and generate slides with perfect text rendering. Powered by Nano Banana—start creating your presentation now.
Your AI Agent for slides. Save time, shine faster with intelligent presentation creation.


© 2026 2slides. All rights reserved.