
Part of Investor presentation examples · Indian investor presentation examples
UltraTech Cement Limited (Aditya Birla Group) Q2 FY27 earnings presentation, 'A Force for Good', covering the quarter ended 30 September 2026 (July–September 2026), filed with the Indian stock exchanges on 19 October 2026.
Uses this deck’s cover as a style reference for slides made from your own content. Or pick any page below to use its layout as the reference.
Quick Navigation
Tags
Share the slides
UltraTech Cement Limited (Aditya Birla Group) Q2 FY27 earnings presentation, 'A Force for Good', covering the quarter ended 30 September 2026 (July–September 2026), filed with the Indian stock exchanges on 19 October 2026.
Detailed view of each slide page, including layout, key content and visual elements.
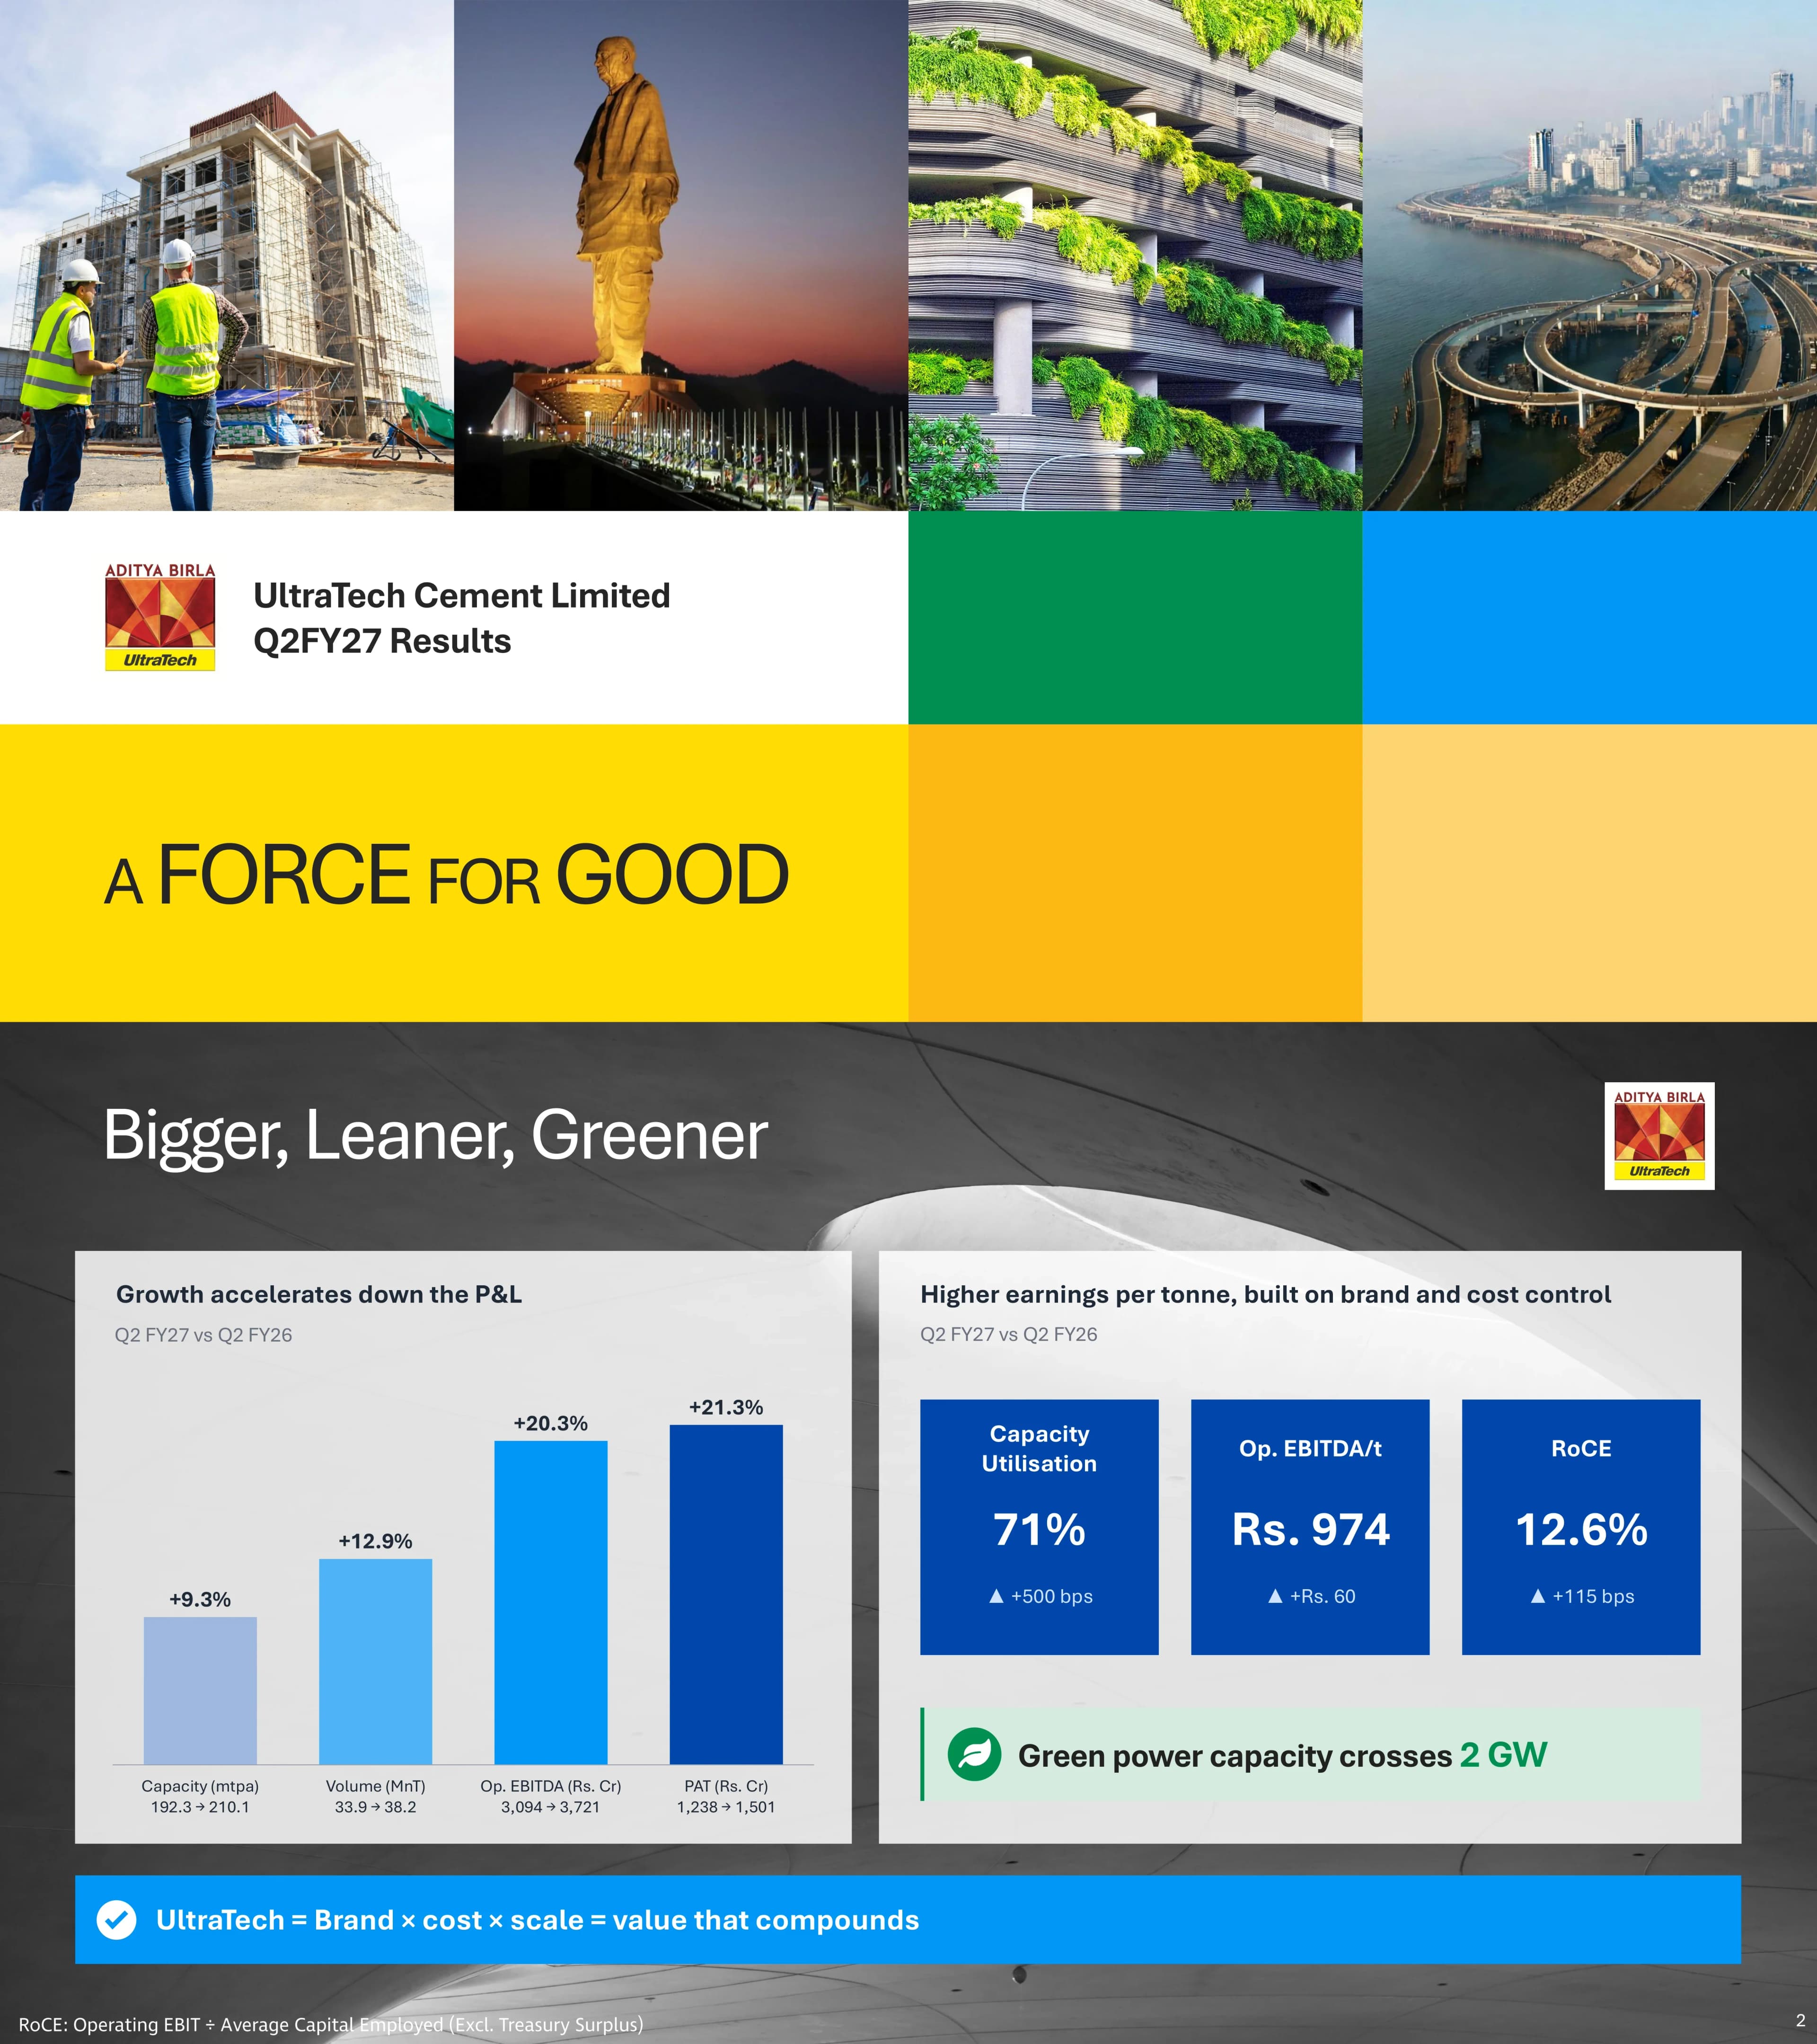
Cover slide naming UltraTech Cement Limited and Q2FY27 Results, with the tagline 'A Force for Good' and the Aditya Birla UltraTech logo.
Mosaic grid: four photo tiles across the top (construction site, Statue of Unity, green-terraced building, sea-link flyover) above flat colour blocks in white, green, blue, yellow, amber and pale orange; title text in the white block and the tagline in the large yellow block.
Q2 FY27 vs Q2 FY26: capacity +9.3% (192.3 to 210.1 mtpa), volume +12.9% (33.9 to 38.2 MnT), operating EBITDA +20.3% (Rs. 3,094 to 3,721 Cr) and PAT +21.3% (Rs. 1,238 to 1,501 Cr). Capacity utilisation 71% (+500 bps), operating EBITDA/t Rs. 974 (+Rs. 60), RoCE 12.6% (+115 bps); green power capacity crosses 2 GW.
Dark concrete-texture background with two light panels: a four-bar growth chart on the left and three dark-blue KPI tiles on the right, a green call-out strip, and a full-width blue banner at the bottom.
Four sections: Macro overview, Business highlights, Financial performance and ESG updates.
Four equal vertical cards, each with a photo on top and a solid colour label block underneath (amber, blue, yellow, green).
Section divider opening the macroeconomic context section.
Full-bleed photo of cement silos at sunset with a large white title at top-left and an amber frame bar along the top and right edges.
India macro: real GDP growth of 7.8% in Q1FY27 (RBI forecasts 7.1% for the year), Centre + State capex +15.5% YoY in April–August 2026, real investment (GFCF) +11.9%, bank credit +19.4% YoY in September 2026, GST collections +15.0% in Q2FY27, and manufacturing/services PMI at 55.1/55.2. The Union Budget allocates Rs. 12.2 lakh crore for FY27 capex, ~42% spent by August 2026.
2x3 grid of cream tiles, each with a large green percentage and a short explanation, plus an amber 'For cement' banner along the bottom.
Region-by-region demand across Infrastructure, Commercial, Housing and Rural: North, Central and West show growth in all four segments; East infrastructure fell because of fund-flow delays, floods and a cyclone, while other segments were stable; South infrastructure was muted but commercial, housing and rural grew.
Five-row table on a light grey panel: region name, four I/C/H/R status circles, and bullet commentary, with a legend at the bottom.
Section divider for operating and business updates.
Full-bleed concrete-wall background with three UltraTech cement bags (Weather Plus, standard, Super) on the right and a large white title at top-left; blue edge bar.
4.6 mtpa of grey cement capacity commissioned (total 210.1 mtpa at 30 September 2026); 6,289 UltraTech Building Solutions outlets (+24% YoY); lead distance of 358 km (down 8 km YoY); WHRS capacity of 444 MW (+20%); renewable power capacity of 1.58 GW (+29%); clinker conversion ratio of 1.48x.
2x3 grid of translucent white tiles over a sky-and-dunes photo, each with a bold metric, a label and a dark YoY badge.
Q2FY27 consolidated sales volume of 38.22 MnT (+12.9% YoY): grey cement domestic 35.94 MnT (+13.8%), white cement domestic 0.52 MnT (+2.6%), overseas 1.75 MnT (-1.4%), exports and others 0.13 MnT. UltraTech brand volume grew 20.2% YoY.
Clean three-column table with a light-blue highlighted volume column, blue-ruled lines, a blue total row and a full-width blue banner.
Sales mix: trade 65.1% / non-trade 34.9%; bag 78.8% / bulk 21.2%; direct dispatch 60.8% / depot 39.2%; road 77.0% / rail 21.0% / sea 2.0%.
Four equal columns, each with a donut chart on a pale blue panel above a supporting photo.
RMC business: 485 plants (+77 YoY) in 179 cities (+18), volume of 4.65 Mn m3 (+23%), revenue of Rs. 2,338 Cr (+29%), 1.33 MnT of cement consumed (3.5% of cement volume, +25%) and RoCE of 34%.
Left half: 2x3 pale-blue KPI tiles with blue numerals and dark YoY badges; right half: 2x2 photo grid of RMC product brands with a blue tagline banner.
Grey cement capacity grows from 146.2 mtpa (FY24) to 188.8 (FY25), 196.8 (FY26), 213.1 (FY27E) and 242.9 mtpa (FY28E). A zone table shows the FY28E mix: North 58.6, Central 35.6, East 43.2, West 40.5, South 59.6, All India 237.5 plus Overseas 5.4 mtpa.
Left: bar chart on a light blue panel, with hatched bars for actuals and solid blue for estimates. Right: zone-wise capacity table with blue-highlighted All India and Overall rows.
FY27 plan adds 16.3 mtpa: greenfield Visakhapatnam (3.0), Shahjahanpur (2.7) and Petnikota (3.6); brownfield Patratu (3.0), slag mills (1.0) and Pali (3.0). The FY28 plan adds 29.8 mtpa across 16 sites, including Sehore, Lalitpur, Banka and three India Cements (ICL) units.
Two side-by-side tables split into Greenfield and Brownfield groups, with light-blue shading marking capacity commissioned to date and blue total rows.
Showcases Alluri Sitarama Raju International Airport, Visakhapatnam, as an infrastructure project; positions UltraTech as a key enabler of India's infrastructure development (creative visualisation for representation).
Single large hero photo framed by a blue project-name tag at top-left and a full-width blue banner at the bottom.
The Ultravolt wires and cables business launched on 3 September 2026: 15,000+ serviceable pin codes, 500+ districts and 80,000+ retailers and electricians onboarded. Planned consumption capacity is 78,000 mt of copper and 24,000 mt of aluminium, making it the second-largest player by installed copper capacity. Capex committed or spent to date is ~Rs. 1,100 Cr.
Brand logo header with launch badge, three pale-blue stat tiles, two blue-headed text panels (Manufacturing and Expansion, Marketing and Brand Building), and a centred blue capex banner.
Eight product lines: PVC insulated cables, insulated e-beam crosslinked cables, flexible cord / multi-core cables, submersible cable, solar DC / PV cable, coaxial cable, CCTV cables and LAN Cat 6/6A, presented as a performance-focused portfolio.
2x4 grid of product cards with blue title bars over studio cable photography and a full-width blue banner.
Launch of Birla White Salt Block anti-efflorescence putty. Its features: it blocks salt migration to prevent white patches and peeling, uses silicone-polymer technology for water resistance, gives superior whiteness and comes in dust- and moisture-free packaging.
Large campaign creative (before/after wall scene with product pack) on the left and a blue-headed features panel with bullets on the right.
Section divider for the financial results section.
Grey concrete studio background with two professionals reviewing a tablet on the right, a large white title at top-left and a yellow edge bar.
Q2FY27 consolidated revenue of Rs. 23,024 Cr (+18.9% YoY): grey cement domestic Rs. 18,603 Cr (+16.0%), white cement Rs. 693 Cr (+12.2%), ready mix concrete Rs. 2,338 Cr (+29.1%), construction chemicals Rs. 421 Cr (+48.4%), overseas Rs. 1,302 Cr (+27.2%), exports and others Rs. 318 Cr.
Three-column table with gold rules, a pale-yellow highlighted value column and a gold total row.
Grey cement (domestic) realisation of Rs. 5,076/t in Q2FY26, Rs. 5,218/t in Q1FY27 and Rs. 5,176/t in Q2FY27, a 2% increase YoY (prior year restated to include ICL).
Single bar chart on a pale yellow panel with hatched prior-period bars, a solid yellow current bar and an elbow-arrow call-out box.
Consolidated EBITDA of Rs. 3,832 Cr in Q2FY27 vs Rs. 3,268 Cr in Q2FY26 (+17.2%) and Rs. 5,146 Cr in Q1FY27. PAT of Rs. 1,501 Cr vs Rs. 1,238 Cr (+21.3%) and Rs. 2,604 Cr in Q1FY27.
Two side-by-side bar-chart panels (EBITDA, PAT), each with three bars and a YoY call-out box.
Cost per tonne and share of total costs: logistics Rs. 1,136/t (27%, +0.1% YoY, -1% QoQ), fuel Rs. 1,030/t (24%, +14% YoY, +12% QoQ), power Rs. 337/t (9%, -12% YoY, +0.4% QoQ), raw material Rs. 718/t (16%, +6% YoY, +3% QoQ).
Four yellow-headed columns with line-art icons, plus a grey label column for share of costs, Rs./t, YoY and QoQ rows.
Logistics cost of Rs. 1,134/t (Q2FY26), Rs. 1,151/t (Q1FY27) and Rs. 1,136/t (Q2FY27), a 1% decrease QoQ, helped by an 8 km YoY and 2 km QoQ reduction in lead distance and a waiver of the busy-season rail freight surcharge.
Bar chart with a QoQ call-out on a pale yellow panel, with explanatory bullets on the right.
Fuel cost rose to Rs. 1,030/t from Rs. 901/t a year earlier (+14% YoY, +12% QoQ). The fuel rate climbed to Rs. 2.09 per '000 kcal from 1.80. In the fuel mix, imported coal rose to 50%, pet coke fell to 25% and alternative fuel reached 7.2%.
Left: bar chart with YoY and QoQ call-outs. Right: two stacked line-chart panels (fuel rate trend; fuel mix trend with three series).
Power cost fell to Rs. 4.77/kWh from Rs. 5.31, consumption to 70.60 from 71.97 kWh/t and cost per tonne to Rs. 337 from Rs. 382. The mix shifted from captive thermal (36.8% to 31.4%) toward renewables (21.1% to 25.1%) and WHRS (18.0% to 22.0%).
Comparison table of power source mix and rates for Q2FY26 vs Q2FY27, with gold summary rows and green down-arrows.
Raw material cost of Rs. 718/t, up 6% YoY from Rs. 677 and 3% QoQ from Rs. 697, attributed to higher industrial diesel prices. A cost index (Q2FY25 = 100) shows fly ash at 104, limestone raising at 114 and gypsum at 89 in Q2FY27.
Left: bar chart with YoY and QoQ call-outs plus a driver bullet. Right: three-series indexed line chart.
Packing bag cost of Rs. 216/t in Q2FY27, up 30% YoY from Rs. 166 and down 7% QoQ from Rs. 232, because crude prices rose with the Middle-East conflict. A Brent crude index (Q2FY26 = 100) peaked at 149 before easing to 140.
Bar chart with call-outs on the left and a Brent crude index line chart on the right, both on pale yellow panels.
Other costs of Rs. 692/t, 6% lower YoY (Rs. 738) but 28% higher QoQ (Rs. 543) on operating leverage, shown alongside a WPI index rising from 100 to 110.
Bar chart with two call-outs on the left and a WPI line chart on the right.
UltraTech won 18 awards at the ET Brand Equity Shark Awards 2026 and Best Digital & Social Media Brand of the Year at e4m IDMA 2026. The slide calls the marketing award-winning and UltraTech India's No. 1 cement brand.
Two yellow-headed photo panels showing trophies side by side, with a full-width yellow statement banner.
Standalone and consolidated P&L down to EBITDA: consolidated net sales of Rs. 23,024 Cr (vs 19,371), total expenses of Rs. 19,574 Cr, operating EBITDA of Rs. 3,721 Cr (vs 3,094), other income of Rs. 111 Cr and EBITDA of Rs. 3,832 Cr. Standalone net sales were Rs. 21,866 Cr.
Four-column financial table (Q2FY26 and Q2FY27, standalone and consolidated) with grey group headers, gold subtotal rows and yellow-tinted current-quarter columns.
From EBITDA to PAT, consolidated: finance costs Rs. 552 Cr, depreciation Rs. 1,213 Cr, exceptional loss of Rs. 6 Cr (sale of asset) and tax Rs. 557 Cr, giving PAT of Rs. 1,501 Cr vs Rs. 1,238 Cr. Standalone PAT was Rs. 1,332 Cr vs Rs. 1,064 Cr.
Continuation table in the same four-column format, with gold EBITDA and PAT rows.
Balance sheet at September 2026 vs March 2026 (consolidated): net fixed assets of Rs. 1,10,944 Cr, shareholders' funds of Rs. 77,702 Cr, gross debt of Rs. 28,411 Cr, treasury surplus of Rs. 4,875 Cr and net debt of Rs. 23,536 Cr (up from Rs. 16,620 Cr).
Four-column table (standalone and consolidated for each date) with gold Application of funds and Sources of funds rows.
H1FY27 vs H1FY26: EBITDA of Rs. 8,978 Cr (vs 7,859), operating cash flow of Rs. 6,181 Cr (vs 4,875), capex and investments of Rs. 5,882 Cr and free cash flow to equity of Rs. 388 Cr (vs 599).
Two-period cash-flow table with gold highlight rows for EBITDA, operating cash flow and free cash flow.
Section divider for sustainability, showing Hirmi Cement Works in Chhattisgarh.
Full-bleed photo of a lake with the plant in the background, a large white title at top-left and a green edge bar.
H1FY27 consolidated metrics (unaudited): Scope 1 net CO2 emissions of 534 kg/t cement (-1.1% YoY; FY32 target 462), 30.0 MnT of alternative raw materials and fuel (+18.3%), 6.2x water positive, and a green power mix of 46.4% (+21.4% YoY; FY30 target 85%).
2x2 metric grid with green category tags and large green numerals on the left; a tall photo of a green-walled building on the right.
ESG scores: S&P Global CSA score of 71 (2025), Crisil ESG score of 59 (2025) and NSE Sustainability Ratings & Analytics score of 61 (2025).
Three tall green-outlined cards, each with the rater's logo, a large green score and a label.
Kukurdih Cement Works, Chhattisgarh, now meets 100% of its electricity needs from green power with no loss of reliability. About one-third of India units source more than 50% of their power from green sources, and no new captive thermal capacity has been added through organic expansion in over a decade.
Mint-green panel with bullet text on the left and a plant photograph on the right.
600+ electric trucks are being added to logistics operations by December 2026. They are expected to cut net CO2 emissions by more than 1,17,000 tonnes a year, equivalent to about 39 million litres of diesel. They will expand the existing green fleet of 850+ CNG and electric vehicles.
Mint-green panel with three bullets on the left and a photo of an electric tipper truck on the right.
CSR reach by plant: Bela Cement Works, 55,868 healthcare beneficiaries; Kukurdih Cement Works, 63,696 village infrastructure beneficiaries; Reddipalayam Cement Works, 32,318 education beneficiaries; Arakkonam Cement Works, 45,219 social reform beneficiaries.
2x2 grid of photo-plus-stat cards, with captioned community photos on the left and green beneficiary numbers on a mint background on the right.
Forward-looking statements disclaimer, plus company contact details: registered office at Ahura Centre, Andheri (East), Mumbai; CIN L26940MH2000PLC128420; website and investor relations email.
Justified grey paragraph at the top and a yellow-bordered contact box in the lower centre.
Common questions about this slide and the underlying presentation content.
For the quarter ended 30 September 2026, consolidated net sales were Rs. 23,024 Cr (+18.9% YoY), EBITDA was Rs. 3,832 Cr (+17.2%) and PAT was Rs. 1,501 Cr (+21.3%). Consolidated sales volume reached 38.22 MnT (+12.9%). Operating EBITDA per tonne rose by Rs. 60 to Rs. 974, capacity utilisation was 71% and RoCE was 12.6%.
UltraTech follows the Indian fiscal year, so FY27 runs from April 2026 to March 2027 and Q2 FY27 covers July to September 2026. The deck compares Q2 FY27 with Q2 FY26 (YoY) and Q1 FY27 (QoQ), and the cash flow slide covers H1 FY27 (April–September 2026).
Only the original PDF is available for this deck. An editable PPTX could not be produced because the source file exceeds the converter's size limit. You can recreate any of its layouts with 2Slides, such as the KPI tile grids, the hatched-versus-solid bar charts or the colour-coded section dividers.
It is UltraTech Cement's own English-language results presentation, filed with BSE and NSE as a stock exchange disclosure under SEBI Regulation 30 (filed 19 October 2026). The exchange cover letter has been removed, so page 1 is the deck cover. The source filing is listed in the references on this page.
Consolidated grey cement capacity was 210.1 mtpa at 30 September 2026. The deck plans 16.3 mtpa of additions in FY27, taking capacity to 213.1 mtpa, and a further 29.8 mtpa in FY28, taking it to 242.9 mtpa. Each greenfield and brownfield site is listed with its capacity.
Fuel cost rose 14% YoY to Rs. 1,030/t on a higher fuel rate, and packing bag cost rose 30% YoY to Rs. 216/t on crude prices. Power cost fell 12% to Rs. 337/t as renewables and WHRS grew to 47% of the power mix. Logistics cost held flat at Rs. 1,136/t, helped by a shorter lead distance.
Copy its structure: a cover mosaic, an executive-summary slide with a growth bar chart and KPI tiles, four colour-coded sections each opened by a full-bleed photo divider, and per-tonne cost slides that pair a bar chart with call-out boxes. In 2Slides, describe your company's metrics and choose a clean corporate theme with a four-colour accent system to generate a similar quarterly results deck quickly.
In H1 FY27, the green power mix reached 46.4% (target 85% by FY30), Scope 1 net emissions were 534 kg CO2 per tonne (target 462 by FY32), alternative raw materials and fuel use was 30.0 MnT and the company was 6.2x water positive. The deck also notes that Kukurdih Cement Works runs on 100% green power and that 600+ electric trucks are being added by December 2026.
Exchange filing; first page is the cover letter to the exchange

Create Your Own Slides
Turn your ideas into professional presentations in seconds with 2slides AI.
Reference professional designs, choose your style, and generate slides with perfect text rendering. Powered by Nano Banana—start creating your presentation now.
Your AI Agent for slides. Save time, shine faster with intelligent presentation creation.


© 2026 2slides. All rights reserved.