
Part of Investor presentation examples · Japanese investor presentation examples
SHIFT Inc. (TSE: 3697) Q4 and full-year earnings presentation for FY2026 (fiscal year ended August 2026), dated October 15, 2026, covering record revenue of ¥161.6 billion (1,616億円), the ramp-up of AI revenue, segment reviews, back-office AI efficiency and the FY2027 budget and 'SHIFT3000' long-term targets.
Uses this deck’s cover as a style reference for slides made from your own content. Or pick any page below to use its layout as the reference.
Quick Navigation
Tags
Share the slides
SHIFT Inc. (TSE: 3697) Q4 and full-year earnings presentation for FY2026 (fiscal year ended August 2026), dated October 15, 2026, covering record revenue of ¥161.6 billion (1,616億円), the ramp-up of AI revenue, segment reviews, back-office AI efficiency and the FY2027 budget and 'SHIFT3000' long-term targets.
Detailed view of each slide page, including layout, key content and visual elements.
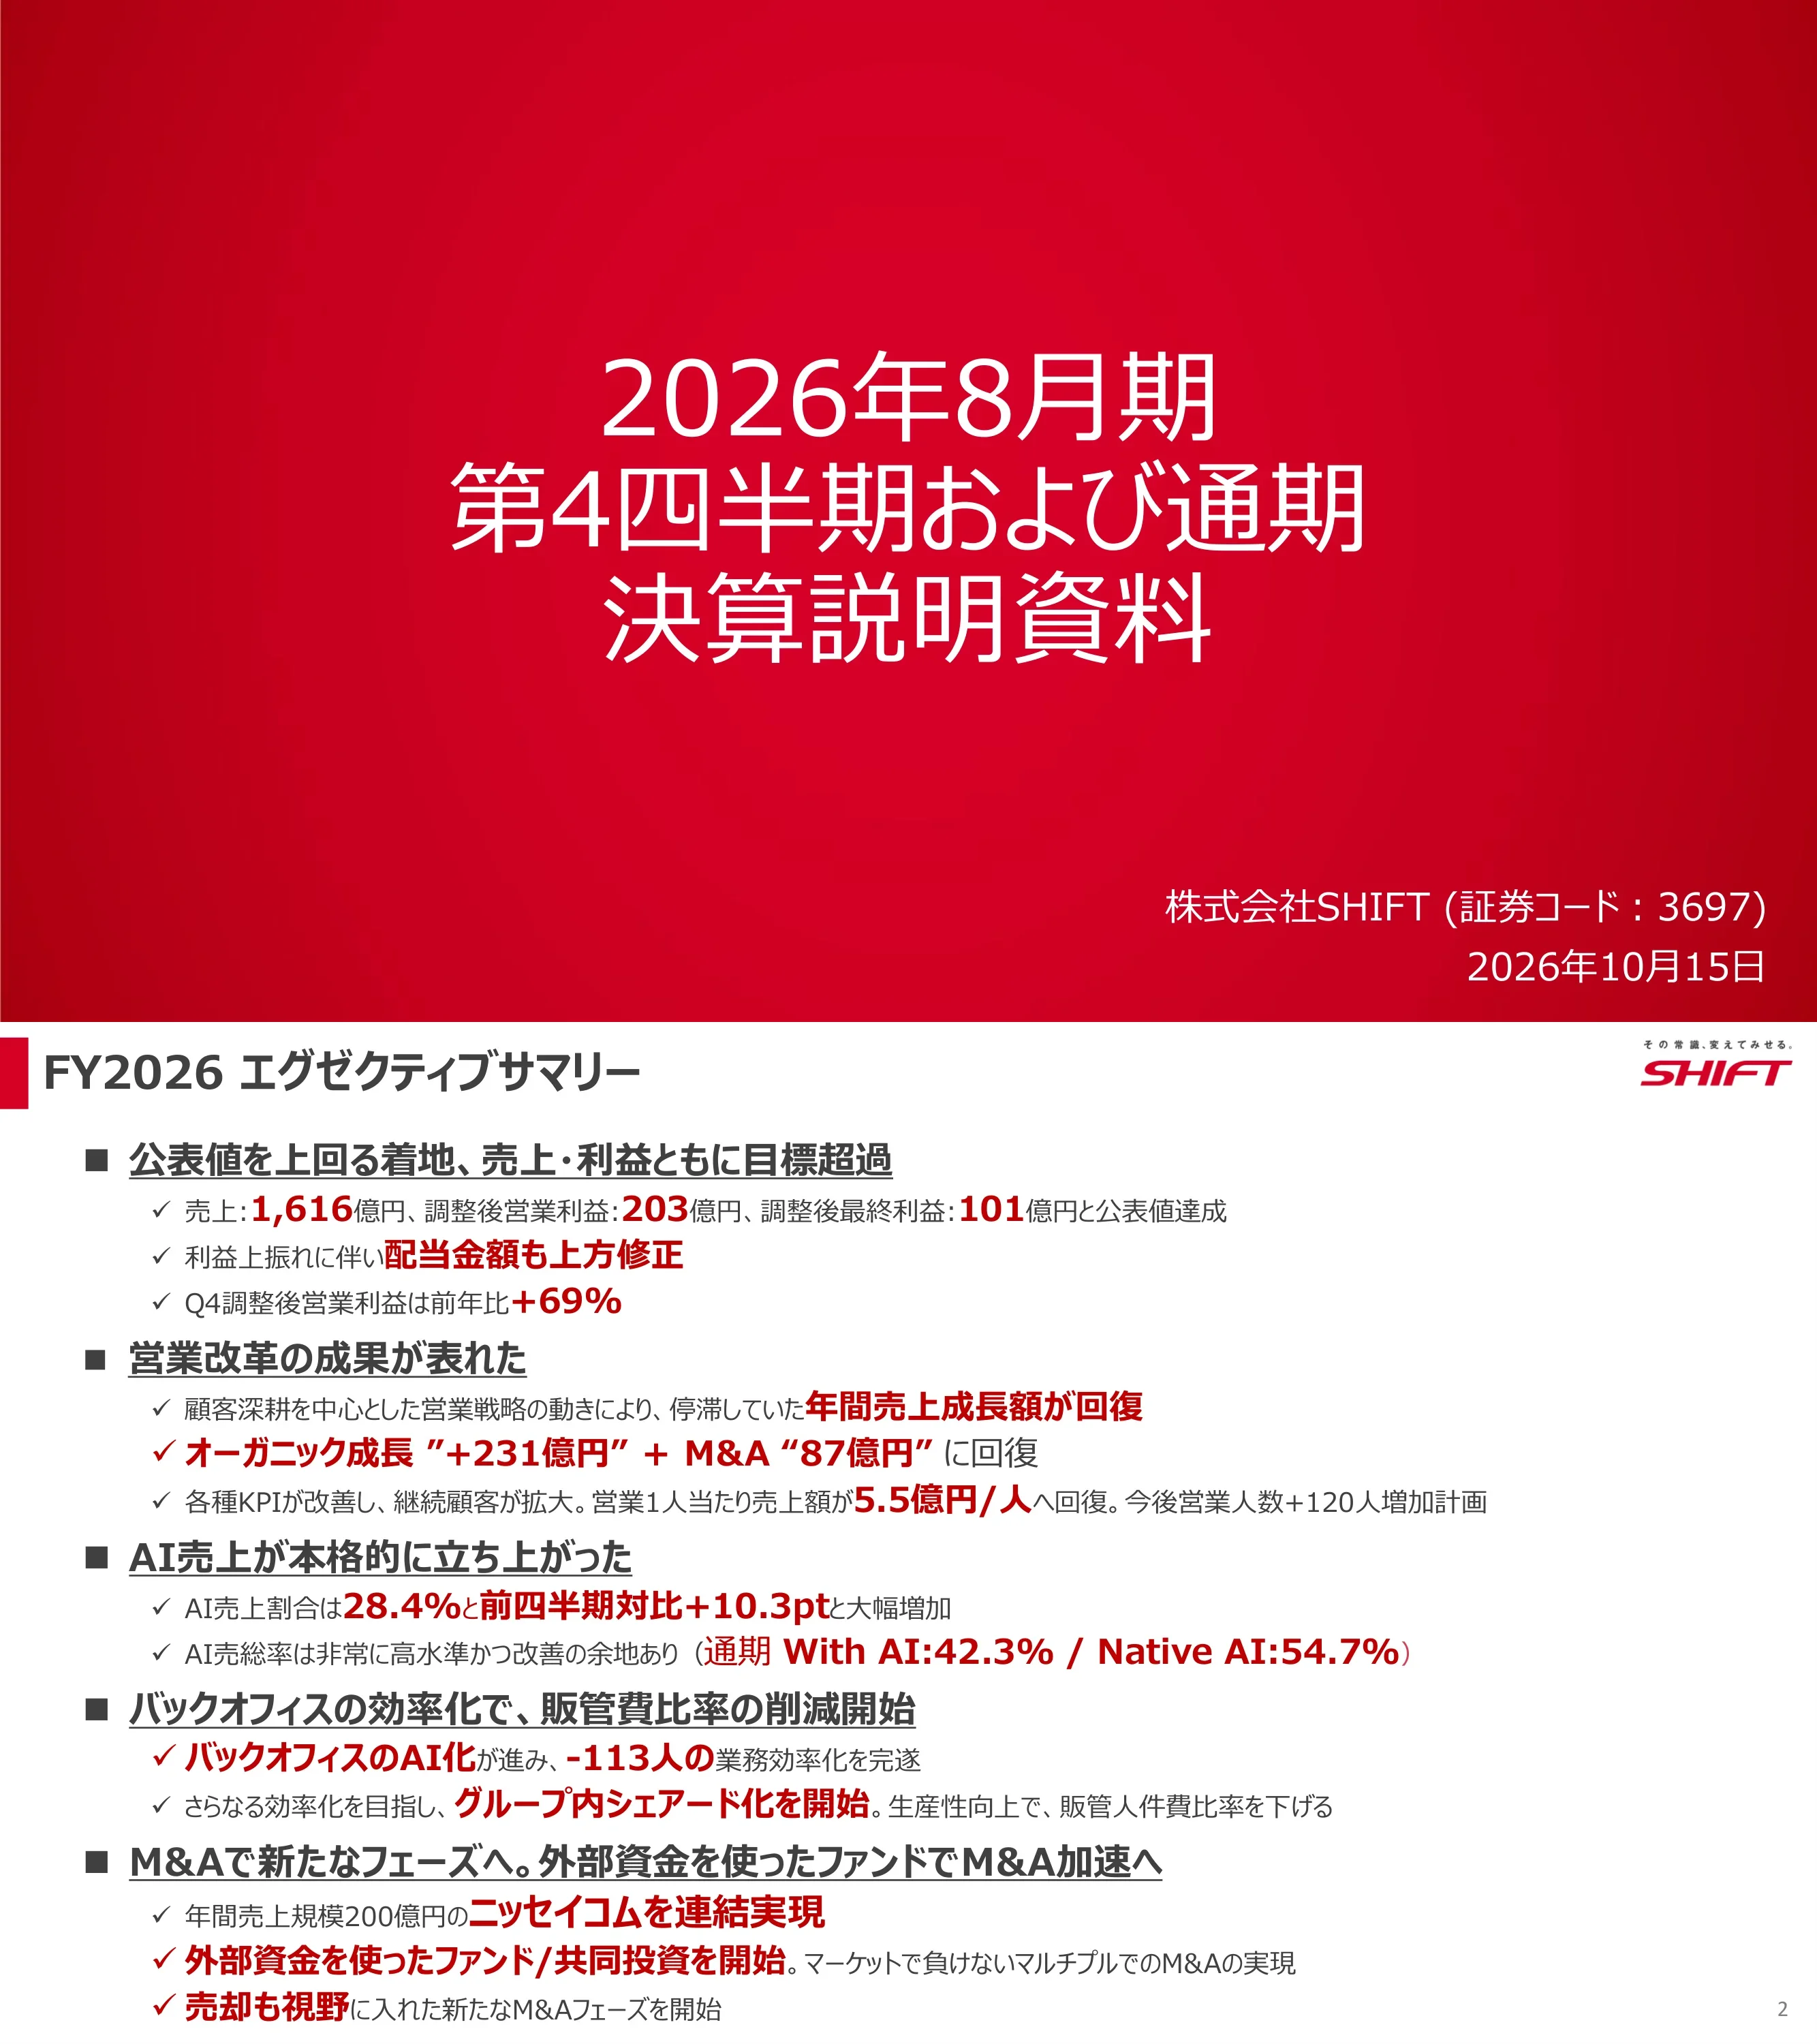
Title slide for SHIFT Inc. (securities code 3697) Q4 and full-year results presentation for the fiscal year ended August 2026, dated October 15, 2026.
Full-bleed red radial gradient with centered three-line white Japanese title; company name, code and date bottom right.
Results beat targets: revenue 1,616億円, adjusted operating profit 203億円, adjusted net profit 101億円, Q4 adjusted OP +69% YoY and an upward dividend revision. Organic growth of +231億円 plus 87億円 from M&A, sales productivity recovered to 5.5億円 per salesperson, AI revenue share hit 28.4% (+10.3pt QoQ), back-office AI saved 113 headcount, Nissay Com (≈200億円 revenue) was consolidated and an external-capital M&A fund was launched.
Five underlined bold headings, each followed by check-mark bullets; key figures enlarged in red.
Section divider introducing the summary of FY2026 results.
Horizontal red gradient band across the middle of a white slide with centered white title.
FY2026 revenue 1,616億円 (+25%) vs. forecast 1,600億円 (raised from 1,500億円); gross margin 33.5% (-1.1pt); adjusted SG&A ratio 21.0%; adjusted OP 203億円 (+15%) vs. 200億円; adjusted ordinary profit 162億円 (-6%); adjusted net profit 101億円 (-8%) vs. 90億円. Q4 alone: revenue 458億円 (+33%), adjusted OP 71億円 (+69%), adjusted SG&A ratio 19.1% (-3.5pt).
Matrix table: red row labels, columns for forecast, full-year actual, Q4 actual and a grey 'background' commentary column.
Dividend set at 10% of adjusted net profit (excluding one-off items such as a 38.7億円 equity-method loss). Final base of 117億円 vs. ~105億円 assumed at Q3 lifts total dividends from 10.5億円 (4.10 yen/share) to 11.7億円 (4.53 yen/share); payout on reported profit is 15.8%.
Three-column comparison (definition, Q3 forecast, Q4 final) with yellow arrows feeding a 'payout ratio 10%' banner into bottom dividend boxes.
Section divider for the revenue growth review.
Red gradient band divider with two-line white title.
YoY revenue growth recovered; standalone growth was 1.4x the prior year (+173.5億円) and consolidated growth +317.8億円 (+231.3億円 excluding Nissay Com/STEP). Standalone KPIs FY2026: retention 93.2%, monthly project price 4.52 million yen, 185 salespeople, 5.5億円 revenue per salesperson, future pipeline 642億円, 5,788 annual projects; 'rock' (≥30 million yen/month) project revenue rose from 48億円 to 133億円 vs. FY2023.
Three panels: quarterly YoY growth line chart with yearly table and sales-strategy timeline; central KPI table FY2023–FY2026; donut charts and arrow table for project portfolio.
Development added in 2017, consulting in 2020 and BPaaS in earnest from 2024. FY2026 segment revenue: Testing 644億円, Development 651億円, Consulting 193億円, BPaaS 52億円; next seeds are the M&A fund, AI modernization, AI testing (Nemuranai) and AI BPaaS.
Stacked bar chart FY2014–FY2026 with bubble callouts and rocket icons tracing each segment's launch-to-scale timeline.
Sales strategy shifted from new accounts to deepening existing customers, and pricing from engineer rates to project rates. Loyal customer unit price 11,858 thousand yen (+7.6%) and count 617 (+12.8%); standalone customers 1,260 (+31.1%); consolidated customers incl. Nissay Com 2,920 (+34.9%); rock-size project revenue 4,365 million yen per quarter (+47%); project counts up 20%+ across all sizes.
Two halves (customer, project), each with two line/bar charts above KPI comparison tables.
Process reform and AI coaching complete the sales AI platform in three steps: task-specific AI tools, a sales AI portal, and AI-based quantitative evaluation of individuals with an AI salary range. Next, all data (CRM, minutes, project info, news) is connected so AI proactively instructs each salesperson.
Step flow (STEP 1–3) in a framed panel on the left; data-platform diagram with personas on the right.
Section divider for profitability review.
Red gradient band divider.
Gross margin moved from 34.7% (FY2025) to 33.5% (FY2026): standalone utilization -1.0pt, indirect costs (weak yen) -0.5pt, AI effect +0.7pt, group companies -0.1pt, other -0.2pt. Utilization dipped in Q1 after accelerated junior hiring; hiring under 6 million yen salary stopped from Q2, and Q4 utilization and margin recovered, staying high in September.
Waterfall bridge chart on the left with numbered explanations below; monthly line chart of margin and utilization on the right.
AI revenue share expanded to roughly 30% in Q4 (With AI 27.4%, Native AI 1.0%), lifting Q4 gross margin to 34.6%; full-year AI share 15.1% with With AI margin 42.3% and Native AI margin 54.7%. Targets: FY2027 challenge 36.0% gross margin (25% With AI, 3% Native AI) and SHIFT3000 40.0% (35% / 15%).
Equation-style grid: gross margin = AI revenue share x AI project margin, with quarterly, full-year, FY2027 and SHIFT3000 columns.
Section divider for SG&A review.
Red gradient band divider.
Operational reform improved personnel cost ratio: adjusted SG&A ratio went from 21.1% to 20.7% excluding Nissay Com/STEP (personnel -0.5pt, recruiting +0.2pt, other -0.1pt) and 21.0% including them (+0.3pt). FY2027 improvement will be limited by M&A, but ~1pt per year is possible from FY2028.
Waterfall chart on the left with orange numbered callouts; three orange headed explanation cards on the right.
Section divider for the segment reviews.
Red gradient band divider.
Sub-section divider for the Consulting segment.
Red gradient band divider.
Consulting revenue rose from 14,789 to 19,263 million yen (+30%). Gross margin 39.9% (41.4% prior year), With AI share 24.0%, Native AI 0.3%; projects 480/month (from 400) at 3.4 million yen/month (from 3.1). Drivers: domain expansion, higher value-add and a 'shower effect' pulling in development, testing and BPaaS work.
Bar chart left, KPI comparison table center, three numbered red-header driver cards right.
Four market shifts (strategy to execution, DX to AI-native redesign, research to decision-making, specialist to cross-domain) in a ~2 trillion yen market growing 10%+. SHIFT's DX consulting exceeds 160億円, with business, security (20億円+) and strategy consulting added; four client cases show consulting fees of 12–95 million yen generating 0.3–6.4億円 of follow-on order backlog.
Three columns: market change list, layered domain diagram with red/blue blocks, and four case cards.
Sub-section divider for the Development segment.
Red gradient band divider.
Development revenue rose from 47,949 to 65,107 million yen (+36%; +19% excluding Nissay Com). Gross margin 30.2%, With AI share 7.5%, projects 2,424/month at 2.2 million yen/month. AI modernization analyzed 310 million lines (steps) of source code; contract size capability rose from the 1-billion-yen to the 2-billion-yen class.
Bar chart, KPI table and two numbered driver cards.
Eight months after launch, analyzed code reached 310 million steps (x3.1 since Q2), proposal opportunities 121億円 and expected order backlog about 39.1億円 from 44 companies; public bodies (5 entities, 32.7億円) and companies under 300 billion yen revenue dominate. Japan's dormant IT assets are estimated at 100 trillion yen of development cost.
Q2 vs Q4 progression boxes on the left, long arrow to a total-market box, and a client-size distribution table.
Contract development capability rose from the 10億円 class to the 20億円 class, with project managers increasing from 111 to 183. Five enablers: DQS technology base, development organization, PM capability, customer access via business units and project quality control.
Size-tier table (giant rock to gravel) comparing pre- and post-FY2026 examples; numbered red strengths list on the right.
A manufacturer's production management system of over 10 million steps written in an obscure language was decoded by building in-house training data and language specifications, feeding DQS for RE (AI agents, static analysis engine, LLM); engagement progressed from a free diagnosis to a 100-million-yen RE project and a 30-million-yen ST follow-on, likened to a modern Rosetta Stone.
Case header band with deal progression; system architecture flow diagram below.
Sub-section divider for the Testing segment.
Red gradient band divider.
Testing revenue rose from 57,612 to 64,382 million yen (+12%); gross margin 35.8% (37.3% prior), With AI share 21.5%, projects 1,326/month at 4.0 million yen/month. Engines: utilization recovery in Q4, AI testing moving from proof to monetization, larger bundled projects above 30 million yen/month, and security becoming a board-level issue.
Bar chart, KPI table and four numbered driver cards (0–3).
Analysis of 99,097 FY2026 sales visit records found testing needs in 68,265 visits (68.9%). From Q1 to Q4, mentions of AI/automation rose +16.7pt (29.8% to 46.5%) and cost/productivity +8.3pt, as faster AI-driven development raises the value of testing.
Headline stat band, line chart with category legend table, and three numbered insight cards on the right.
AI testing broke through accuracy and cost barriers: cumulative AI test orders reached 1,259 million yen as of September 2026 with planned gross margin of 52.0%. Execution cost fell from 489 yen per case at launch to 39 yen (-92%; -67% vs. a human tester at 158 yen), token cost from 300 to 15 yen and time from 12 to 1.5 minutes per case; AI self-check achieved 99.59% accuracy over 11,690 cases.
Three panels: cumulative order line chart, stacked cost bar chart, and accuracy table with token-cost chevron sequence.
Share of testing revenue from projects of 30 million yen/month or more rose from 11.6% in Q1 to 15.6% in Q4 (+4.0pt); flagship cases run at 81.6, 40.1 and 30.0 million yen/month. SHIFT positions itself as covering upstream to operations in-house with AI, unlike consulting firms or SIers that outsource stages.
Bar chart and case list on top; three-column competitor comparison with chevron process rows below.
Japan's defense budget has risen to a first-ever ~10 trillion yen, mostly for equipment. Through defense consultancy JADC, SHIFT secured Japan's first AI performance evaluation for defense equipment and RMF services; cumulative defense project orders reached 53億円.
Blue bar chart of defense budget left; JADC structure diagram and order total center; service screenshots right.
Sub-section divider for the AI BPaaS segment.
Red gradient band divider.
BPaaS revenue rose from 3,817 to 5,157 million yen (+35%), gross margin flat at 30.2%, Native AI share 8.8% and With AI 9.7%, projects 241/month at 2.0 million yen. Internal use proved a 113-person back-office workload reduction, now packaged as an offering, with customer lead generation via events with Matsuo Lab and OpenAI.
Bar chart, KPI table, and an FY2026 overview with customer/service/organization cards.
Japanese companies hold about 90 trillion yen of latent efficiency value. Three cases show results: a knowledge-based AI help desk saving 1,920 hours/year, AI OCR paper-to-digital saving 8,800 hours/year, and AI handling 35% of citizen inquiry calls, with post-AI gross margins of roughly 35–50% and project prices from 1 to 3 million yen per month.
Industry x function heat-map grid on the left; three case rows with market size, price and margin columns on the right.
Section divider for back-office initiatives.
Red gradient band divider.
Of 1,689 SG&A staff at the start of the year (987 standalone), operations staff fell from 284 to 171, a 113-person reduction, with temporary staff reduced to zero. FY2027 plans +120 sales staff (235 to 355), steady infrastructure staff, and a further 100-person AI BPaaS reallocation of operations to profit roles plus group shared services.
Headcount flow table by function across FY2026 start, end and FY2027 target, with policy boxes on the right.
An in-house evaluation AI uses all chat logs and work outputs to see contributions managers miss. Manager evaluation time fell from 1,477 to 990 hours (-33%) and all 10 post-evaluation survey items improved, along with eNPS.
Iceberg-style visible vs AI-visible information diagram on the left; time and satisfaction result cards on the right.
SHIFT set up a 150億円 joint fund with Tokyo Gas (SHIFT Growth Capital as GP) as part of an investment platform, enabling about 300億円 of M&A with external capital. Targets are SI/SES firms only, an area where 31 prior deals saw no impairment; the fund aims to pay higher multiples, build exit data and attract talent.
Fund structure diagram on the left; four numbered purple point cards on the right.
Section divider for medium-term targets.
Red gradient band divider.
Base budget: revenue 1,900億円 (+18%), gross margin ~34.5%, adjusted SG&A ratio ~20.7%, adjusted OP 250億円 (13.2%, +23%), adjusted net profit 165億円 (+63%). AI challenge budget: revenue 2,000億円 (+24%), gross margin 36.0%, SG&A 20.3%, adjusted OP 314億円 (15.7%, +55%), adjusted net profit 212億円 (+109%), with M&A on top.
Driver matrix: rows for revenue, margin, SG&A and profit; columns for base budget, 'further' levers, challenge budget and an M&A add-on column.
Regardless of driver progress, adjusted OP can grow at a 20%+ CAGR. Challenge case (organic +300億円/yr plus 100億円 M&A): FY2031 revenue 3,650億円 and adjusted OP 875億円 (24.0%). Base case (+200億円 plus 60億円): FY2031 revenue 3,000億円 and adjusted OP 525億円 (17.5%).
Two scenario blocks (challenge, base) with FY2029–FY2031 columns pairing results and drivers, CAGR in dark/red badges.
SHIFT is moving from boosting human productivity to delivering work itself through AI, across the man-month, With AI and Native AI eras over about 10 years. Revenue simulation: 1,616億円 in FY2026 (Native AI 9億円) to 2,000億円 in FY2027 challenge and 3,650億円 in FY2031 (With AI 1,280億円, Native AI 550億円), with AI BPaaS (40 trillion yen market) and AI modernization (16 trillion yen) as targets.
S-curve chart of market evolution with era bands, service ladder on the right, and revenue simulation table below.
Mission statement 'SHIFT is a company that solves social issues', surrounded by goals across SHIFT1000, 2000 and 3000 such as resolving IT engineer shortages, 10% annual pay raises, retirement at 70, breaking multi-layer subcontracting, AI-driven legacy migration and international competitiveness.
Central mission statement encircled by grey and pink bubbles along an arrow loop.
Section divider for the reference appendix.
Red gradient band divider.
From FY2026 SHIFT commits to volatility-adjusted profit. Adjustments total 28.4億円 in FY2026 (goodwill and customer-asset amortization 22.3億円, M&A advisory/DD fees 5.8億円, fund SPC costs 0.1億円, M&A-linked interest 0.3億円) and 31.4億円 planned for FY2027, now including LBO interest.
Pink banner statement above a four-row reconciliation table with FY2026 actual and FY2027 plan columns.
Q4 revenue 45,752 million yen (+33.0%), full year 161,600 (+24.5%, 101.0% of forecast). Full-year operating profit 17,445 (+11.6%), adjusted OP 20,259 (+14.8%, 101.3% of target), adjusted ordinary profit 16,162 (-6.0%), net profit 7,430 (-16.8%) and adjusted net profit 10,120 (-7.6%, 112.4% of target).
Full-width financial table with red-filled actual columns and grey prior-year columns.
Full-year SG&A 36,756 million yen (22.7% of revenue, +25.1%), adjusted SG&A 33,942 (21.0%). Personnel 19,512 (12.1%), recruiting 5,057 (3.1%); in Q4 recruiting fell 60.5% to 513 million yen and adjusted SG&A was 19.1% of revenue.
Line-item table with Q4 and cumulative columns, ratio to revenue and change rates.
Total assets 109,685 million yen (+42.4%), cash 31,097, long-term borrowings 27,538 (+223.8%), equity ratio 37.9% (down 14.8pt). ROE 18.1% (24.1%), ROIC 11.4% (18.6%), ROA 8.0% (12.8%); goodwill plus customer-related assets total 29,293, or 69.4% of net assets.
Balance sheet table left, three ratio cards center, goodwill table right.
Full-year software testing services revenue 100,700 million yen (+19.5%, margin 35.4%), software development services 53,550 (+33.4%, 26.5%) and other adjacent services 13,384 (+24.6%, 43.4%), each split into partner vs end-user customers.
Three side-by-side boxed tables with pink partner and teal end-user sub-tables.
Q4 YoY revenue by industry: banking 21 to 31億円 (+47%), manufacturing 33 to 41 (+24%), public sector 11 to 16 (+43%), retail/logistics 31 to 40 (+27%), ERP 52 to 60 (+16%); telecom fell 32 to 28 (-12%); group companies combined 149 to 219億円 (+47%).
4x3 grid of teal-labelled industry tiles showing before/after values and growth.
Standalone revenue rose 21% with loyal customers +22% (86.4% of revenue); customer count +23%. Average monthly revenue per customer: new 3.15 million yen, repeat 4.34 million, loyal 11.86 million (from 11.02 million).
Two stacked-bar comparisons on the left; teal comparison table of monthly revenue per customer tier on the right.
Quarterly detail by segment of revenue share and gross margin for Traditional, With AI and Native AI. Consolidated With AI share rose from 2.7% in Q1 to 27.4% in Q4 (Testing With AI reached 17.7% of consolidated revenue in Q4); consolidated margin 33.5% for the year.
Two large red-header tables side by side (revenue share and gross margin) grouped by segment.
The same table for FY2025, when all revenue was Traditional; consolidated gross margin was 34.7%, with Consulting 41.4%, Development 30.6%, Testing 37.3% and BPaaS 30.2%.
Mirrors page 51: paired share and margin tables by segment.
Segment revenue and operating profit: Consulting 19,263 / 5,449 million yen, Development 65,107 / 5,838, Testing 64,382 / 16,897, BPaaS 5,157 / 801, Investment Platform 638 / -361; consolidated revenue 161,600 and operating profit 17,445 (10.8% margin).
Wide segment table with rows for revenue, gross profit, margins and YoY changes.
Repeated security incidents move spending from IT-department spot checks to board-led, continuous company-wide security covering prevention, detection, response and operations. Under the SECURE AQ brand SHIFT integrates its security group company, offers end-to-end services and leverages defense-project expertise.
Before/after panels left, illustrated house cutaway center, three red-header strength cards right.
SHIFT's standalone disability employment rate is 2.6% (statutory 2.5%) with 218 employees; all 23 eligible group companies meet the requirement (152 employees). The new subsidiary SHIFT HAP, established October 2026, provides support services, AI-assisted efficiency work and creative businesses such as floriculture and art.
Three-stage flow: current status (gold), establishment (company profile card), future (group-wide structure).
AI is applied across back-office functions for a 113 operator-equivalent reduction; e.g., recruiting staff fell from 137 to 51 (-86) using AI screening and interview tools, sales administration 42 to 26 (-16) and design 24 to 15 (-9), while M&A/PMI and HR planning staff increased.
Central headcount table by function flanked by panels of named back-office AI tools.
Awards and recognition including the HR Technology Award learning category prize, Gen HR Award 2026 finalist, ITreview Grid Award 2026 Summer Leader, a case cited by the Ministry of Internal Affairs, AWS and Google Cloud partner certifications, and Health and Productivity Management 2026 certification.
Gradient category banners over award logo clusters, with technical and human-capital sections below.
The group launched the 'ONE-SHIFT' service so that group companies jointly support clients from service launch through operations; logos of about 25 group companies span consulting, development, ERP, infrastructure, defense consulting, testing, security, localization, marketing and design.
Large blue speech-bubble ellipse with ONE-SHIFT wordmark ringed by circular company logos.
Defines monthly customer price, customer counts and project price, and AI revenue categories: With AI projects need 35%+ gross margin (40% for consulting) and Native AI projects 45%+. Includes the forward-looking statements disclaimer and IR contact ir_info@shiftinc.jp.
Text-only slide with two headed sections and a red gradient footer band.
Common questions about this slide and the underlying presentation content.
For the fiscal year ended August 2026, SHIFT reported revenue of 161,600 million yen (1,616億円, +24.5% YoY), adjusted operating profit of 20,259 million yen (203億円, +14.8%) and adjusted net profit of 10,120 million yen (101億円), beating its targets of 1,600億円, 200億円 and 90億円. Q4 alone delivered revenue of 458億円 (+33%) and adjusted operating profit of 71億円 (+69%), and the total dividend was raised to 11.7億円 (4.53 yen per share).
AI revenue share rose from 2.7% in Q1 to 28.4% in Q4 FY2026 (With AI 27.4%, Native AI 1.0%), or about 15% for the full year. With AI projects earned a 42.3% gross margin and Native AI projects 54.7%, against 31.9% for traditional work. The FY2027 challenge budget targets a 36.0% consolidated gross margin.
The FY2027 base budget is 1,900億円 of revenue and 250億円 adjusted operating profit (13.2% margin). The AI challenge budget is 2,000億円 and 314億円 (15.7%). Long-term 'SHIFT3000' scenarios reach 3,000–3,650億円 of revenue and 525–875億円 of adjusted operating profit by FY2031.
Yes. The page offers the original PDF of all 59 slides and an editable PPTX converted from the PDF, so you can reuse the layouts, tables and charts in PowerPoint, Keynote or Google Slides. Because the PPTX is converted, some Japanese text boxes and charts may need minor adjustment.
It is SHIFT Inc.'s own Japanese-language earnings presentation (決算説明資料) for Q4 and full-year FY2026, dated October 15, 2026 and published on TDnet, the Tokyo Stock Exchange's Timely Disclosure network. The English titles and summaries on this page are translations prepared for reference. The Japanese original is authoritative.
The deck uses SHIFT's corporate crimson on white. Each page title has a red vertical accent bar, sections open with full-width red gradient dividers, and each headline message runs two lines in bold Japanese gothic. Data appears in pastel teal, pink and gold KPI tables with red-outlined highlights, and a pointing-hand 'look here' mascot marks the key number on many slides.
Use the editable PPTX as a reference, then generate your own deck in 2Slides from your figures or source document. Ask for a red-and-white corporate theme, a headline message slide for each topic, KPI comparison tables, waterfall bridges for margin changes, and budget or scenario matrices like pages 4, 12, 39 and 40. You can then edit the numbers and branding before exporting.
In FY2026, Development grew to 65,107 million yen (+36%), Testing to 64,382 million yen (+12%) with the highest segment operating profit of 16,897 million yen, Consulting to 19,263 million yen (+30%), and AI BPaaS to 5,157 million yen (+35%). The deck also covers AI modernization (310 million lines of code analyzed) and AI testing, where execution cost fell 92% to 39 yen per case.
Original Japanese-language deck

Create Your Own Slides
Turn your ideas into professional presentations in seconds with 2slides AI.
Reference professional designs, choose your style, and generate slides with perfect text rendering. Powered by Nano Banana—start creating your presentation now.
Your AI Agent for slides. Save time, shine faster with intelligent presentation creation.


© 2026 2slides. All rights reserved.