
Part of Investor presentation examples · Indian investor presentation examples
Hindustan Zinc Limited (Vedanta group) Earnings Presentation for 2QFY27 (July–September 2026), filed with the Indian stock exchanges on 19 October 2026, covering record quarterly and half-year production, highest-ever financial results, zinc and silver market outlook, ESG performance and growth projects.
Uses this deck’s cover as a style reference for slides made from your own content. Or pick any page below to use its layout as the reference.
Quick Navigation
Tags
Share the slides
Hindustan Zinc Limited (Vedanta group) Earnings Presentation for 2QFY27 (July–September 2026), filed with the Indian stock exchanges on 19 October 2026, covering record quarterly and half-year production, highest-ever financial results, zinc and silver market outlook, ESG performance and growth projects.
Detailed view of each slide page, including layout, key content and visual elements.
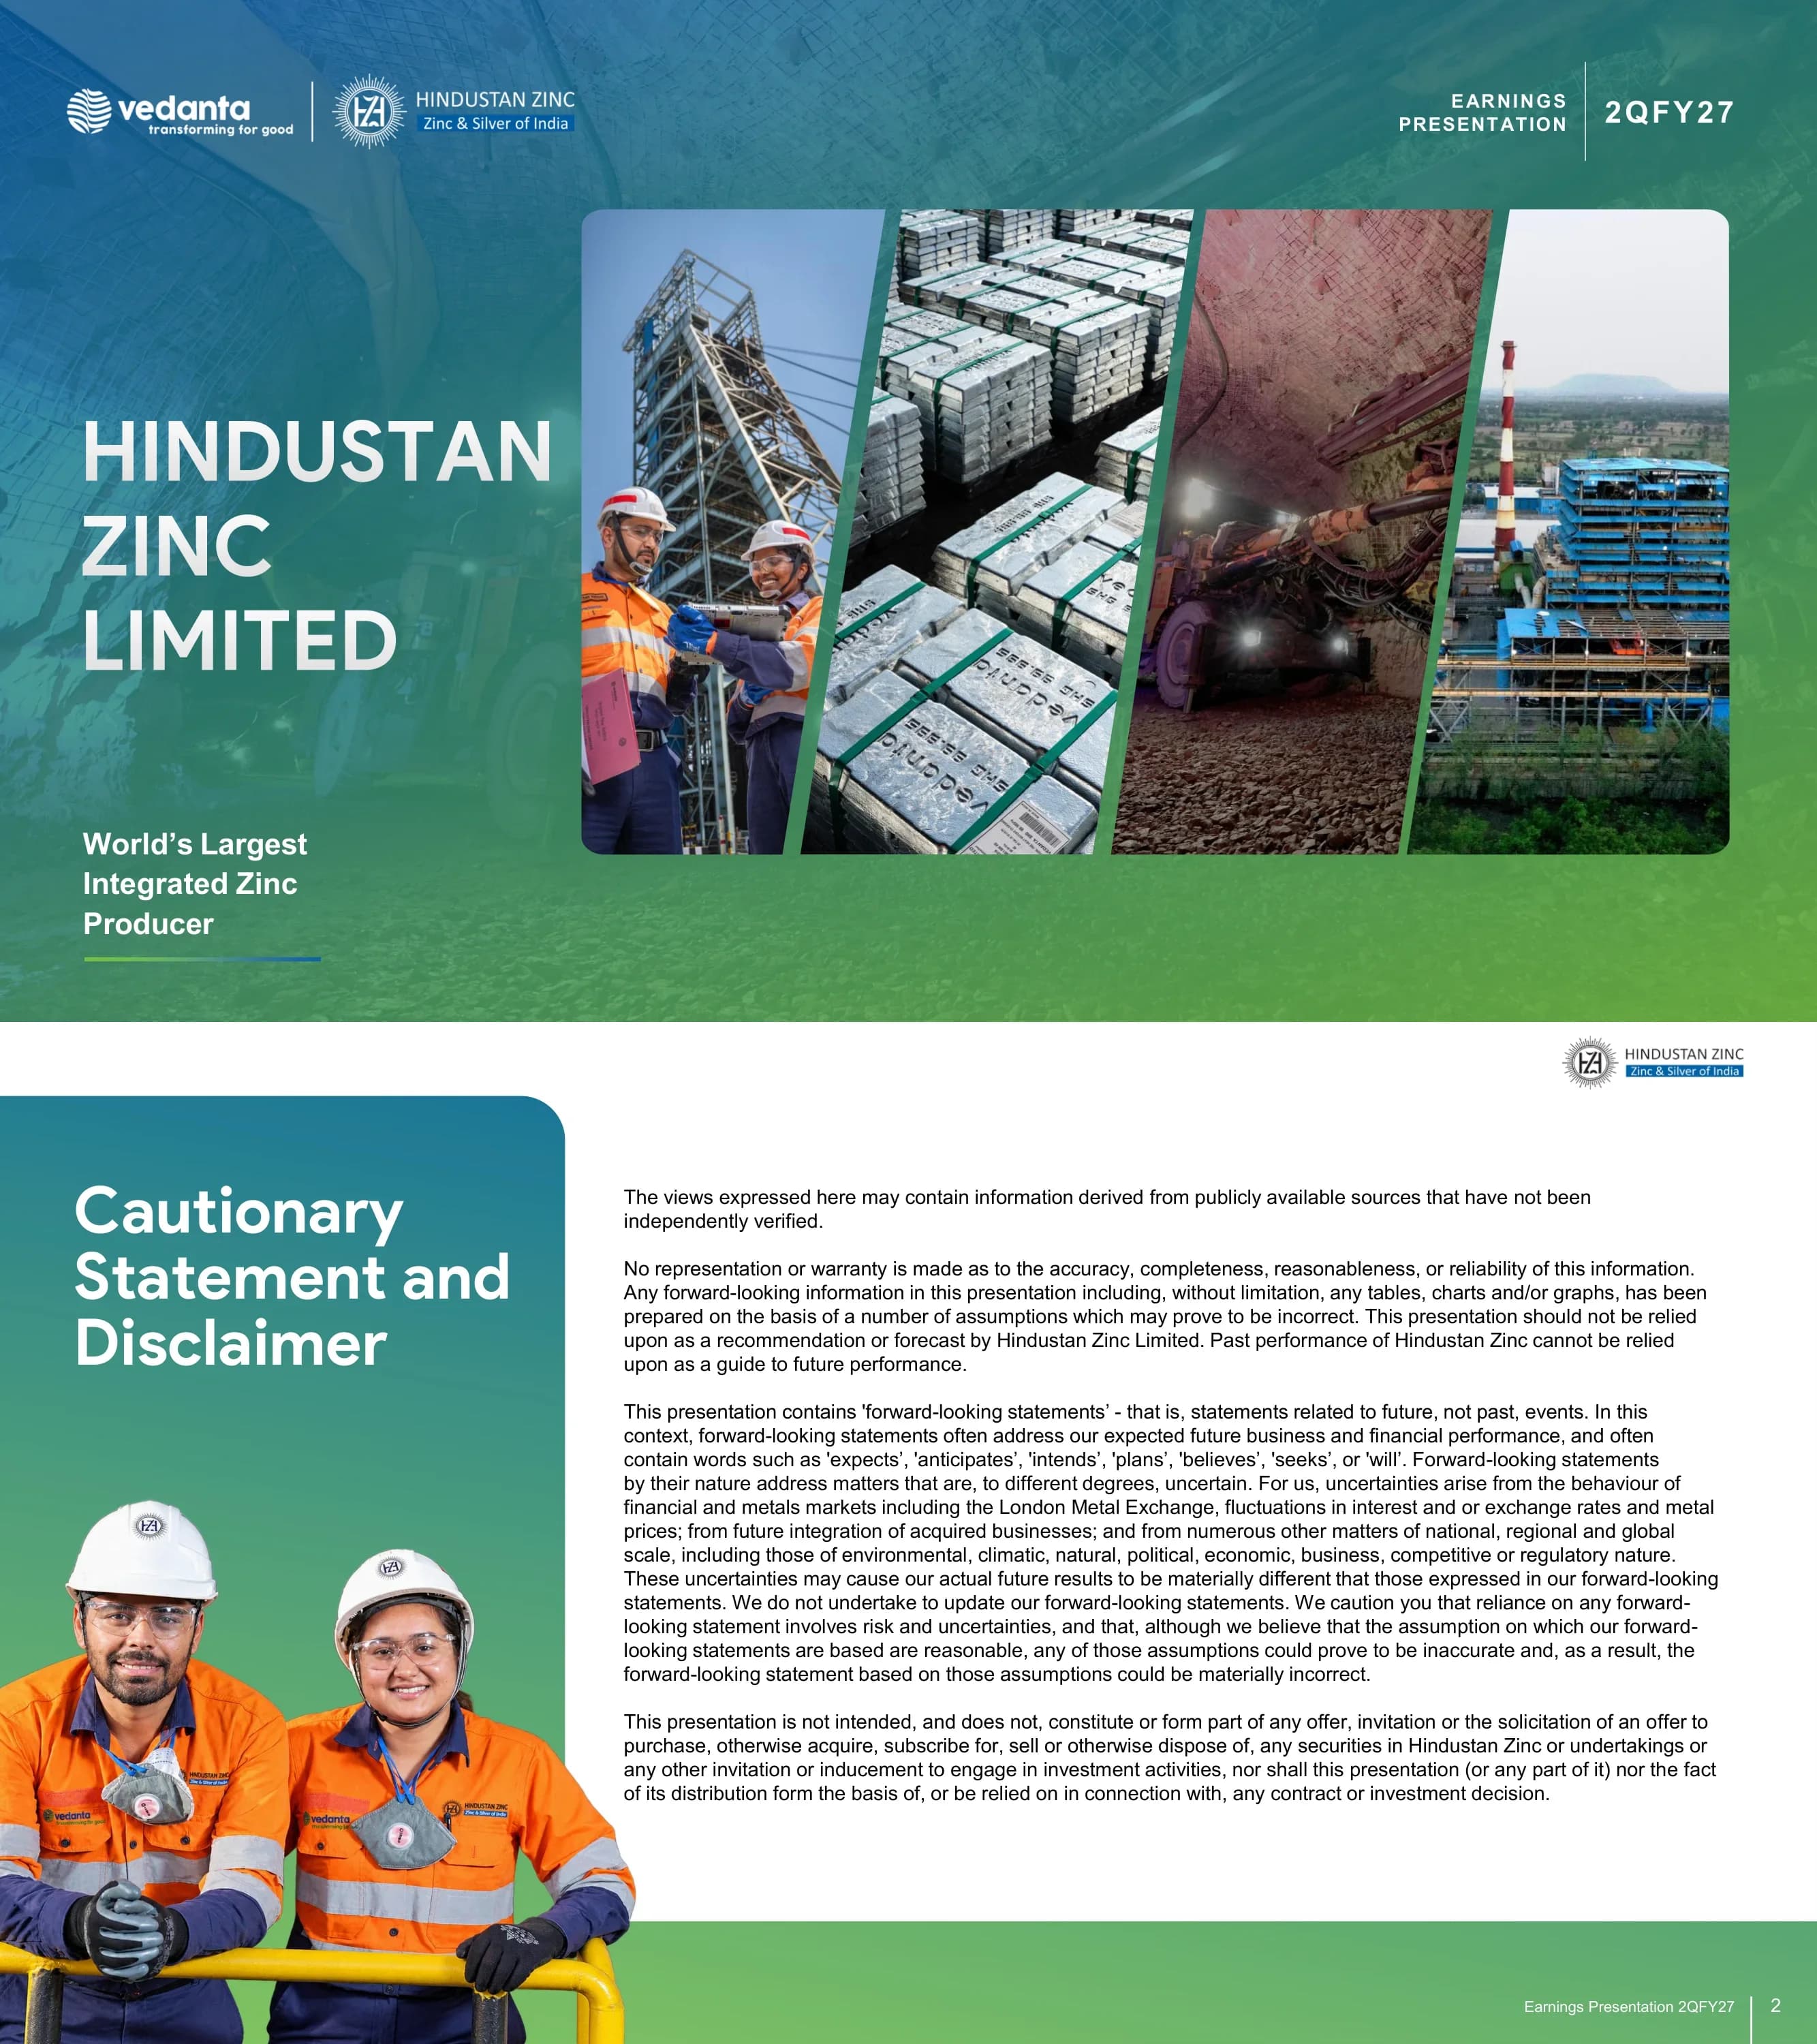
Cover slide with Vedanta and Hindustan Zinc ('Zinc & Silver of India') logos, the company name in large white type and the tagline 'World's Largest Integrated Zinc Producer'.
Full-bleed blue-to-green gradient background; large stacked title on the left; four slanted photo panels on the right; period label top right.
Standard forward-looking statements disclaimer: information may come from unverified public sources, forward-looking statements are subject to metal price, exchange rate and other uncertainties, and the presentation is not an offer of securities.
Left gradient panel with large white title and cut-out photo of two workers; dense body text on the right.
Agenda listing six sections with page numbers: Key Highlights (04), Sustainability Update (08), Market Update (12), Operational and Project Update (16), Financial Review (20) and Appendix (24).
Gradient title top left; vertical green timeline line with large green page numbers on the right; underground crew photo bottom left.
2QFY27: mined metal 271 KT (+5% YoY), refined metal 264 KT (+7%), silver 173 MT (+20%); revenue ₹15,093 crore (+77%), EBITDA ₹9,285 crore (+108%), net profit ₹6,412 crore (+142%); zinc COP ex-royalty $703/MT (29% better); free cash flow ₹6,389 crore. 1HFY27: revenue ₹28,840 crore, EBITDA ₹17,359 crore, net profit ₹11,881 crore (+143%), zinc COP $776/MT, silver c.45% of profitability.
Two horizontal bands (green 'Record Quarterly Performance', blue 'Historic Half Year Performance'), each with a label block and four white KPI cards.
Claims include world's largest integrated zinc producer, world's largest zinc mine at Rampura Agucha, top-10 silver producer, world's 2nd largest zinc-lead reserves and resources with 25+ years mine life, ranked 1st in S&P Global CSA 2025 for the 3rd year, and 1st Indian ICMM member. India positioning: c.74% expected domestic primary zinc share and consistent AAA rating by CRISIL.
Full-width gradient panel with title and worker photo on the left, two columns of eight icon claims on the right, and a white callout strip of four India facts at the bottom.
Positions zinc and silver as energy-transition metals and lists critical-mineral blocks: Tungsten (Balepalyam, Andhra Pradesh; exploration started Q4FY26; mining Sep'30), Potash (Jhandawali-Satipura, Rajasthan), REE (Nawatola-Laband, Uttar Pradesh) and REE & Yttrium (Gundlupet, Karnataka; LOI received).
Gradient title with blue subtitle; two image-plus-text blocks for zinc and silver; six-column table across the bottom with alternating green/blue headers.
Digital and AI initiatives in three groups: technology already running at mines (tele-remote operation, collision avoidance, seismic monitoring), intelligence in smelters (predictive equipment health, AI consumables optimisation, cellhouse intelligence) and next-step integration (digital twin, autonomous material handling, energy optimisation across captive power plants).
Three equal columns, each a photo on top with an overlapping white card of bullets and a green side accent.
Section opener for the sustainability update, presented by CEO Amarendu Prakash.
Gradient title tile top left, large solar-farm photo collage, presenter name tile bottom right, home icon.
27% renewable power in overall consumption; subsidiary HZAPL sourcing 100% renewable power; first EV crane and EV cherry-picker deployed; ICFRE–AFRI plantation partnership at Chanderiya; MoU with MFL India for 30 EV trucks; FY2026 Sustainability, TNFD and Climate Action reports published.
Three stacked rows, each with a gradient label pill and icon on the left, bullet list in the middle and supporting photo on the right.
Six small bar charts FY21–1HFY27: TRIFR improved from 2.6 to 1.3, zero fatalities in 1HFY27, waste recycling around 30%, GHG intensity (Scope 1+2 per MT) steady at 4.6, water withdrawal split STP vs fresh water, and cumulative plantation rising from 2.7 to 8.6 lakh.
2×3 grid of mini bar charts, each tagged with a gradient pill label (Zero Harm, Circular Economy, Climate Change, Water Stewardship, Biodiversity Conservation).
FY2026 CSR highlights: ₹278.15 crore CSR spend, c.2.6 million lives benefitted, 4,149 villages, 38 districts across 3 states, 7 verticals; initiative counts and beneficiaries per vertical; 12,263 Nand Ghars (women and childcare centres) in Rajasthan, including 2,989 new in 1HFY27.
Vertical gradient stat column on the left, 2×4 grid of icon cards in the centre, photo mosaic on the right and a gradient banner for Nand Ghars.
Section opener for the market update, presented by CEO Amarendu Prakash.
Gradient title tile, sunset aerial photo of a smelter complex and highway, presenter tile bottom right.
IMF GDP growth comparison shows India at 7.7% (2025), 6.4% (2026f) and 6.7% (2027f), the fastest among major economies; global manufacturing PMI line chart Apr-24 to Sep-26. Government capex up 2.6x over six years, with FY27 effective capex budgeted at a record ~4.4% of GDP.
Two charts side by side under gradient header bars; gradient callout box bottom left and two bullet notes bottom right.
Dual-axis chart of zinc price ($/MT) versus LME stocks (KT) Jan-25 to Sep-26, and Wood Mackenzie supply/demand/balance chart for 2022–2026f. Notes: zinc demand to grow at 1.4% CAGR over the next decade, structural supply deficit expected post-2030, average reserve grades down from 6.9% in the 1990s to 2.8%.
Two charts under green and blue rounded header pills; four-point gradient insight banner across the bottom.
Silver market heading for a sixth straight deficit year in 2026 (deficit of 1.44 KT forecast); silver price rose from $17/oz in 2017 to $68/oz in 2026 through September. Industrial share of demand rose from 46% (2022) to 58% (2025); photovoltaics drive ~17% of silver demand; lead-zinc, copper and gold mines supply ~70% of production.
Surplus/deficit bar chart with demand/supply lines on the left, silver price line chart on the right, four-point gradient insight banner below.
Section opener for operations and projects, presented by CEO Amarendu Prakash.
Gradient title tile, photo of a grinding mill and processing hall, presenter tile bottom right.
Mined metal production 271 KT in 2QFY27 (+5% YoY) and 539 KT in 1HFY27 (+3%, record first half for the 6th year); refined metal 264 KT (+7%) and 524 KT (+6%) helped by smelter debottlenecking; zinc COP ex-royalty $703/MT (29% better than $994) and $776/MT for the half (23% better).
Three bar charts in a row with bracketed growth callouts; horizontal timeline with three nodes and commentary bullets below.
Saleable silver production 173 MT in 2QFY27 (+20% YoY from 144 MT) and 321 MT in 1HFY27 (+10% from 293 MT). Precious metal contributed 45% and base metal 55% of 1HFY27 profitability.
Subtitle text over a white card set on a gradient photo background; bar chart left, donut chart right.
Project 1: 250 KTPA integrated refined zinc capacity expansion at Debari, lifting refined metal capacity from 1.1 to 1.4 MTPA, c.₹12,000 crore approved investment, target completion 2QFY29. Project 2: India's first 10 MTPA zinc tailings reprocessing plant, ₹3,823 crore, target 4QFY28; both progressing on schedule.
Two mirrored tree diagrams: numbered pill header, three branching metrics, and a colored status-update box (green left, blue right).
Section opener for the financial review, presented by CFO Amit Gupta.
Gradient title tile, aerial photo of a mine and concentrator in hilly terrain, presenter tile bottom right.
Revenue from operations ₹15,093 crore in Q2FY27 and ₹28,840 crore in H1FY27 (both +77% YoY); EBITDA ₹9,285 crore at 62% margin and ₹17,359 crore at 60% (both +108%); net profit ₹6,412 crore and ₹11,881 crore with EPS of ₹15 and ₹28. Gross investments and cash ₹17,439 crore vs borrowings ₹6,171 crore; ₹13,027 crore contributed to the national exchequer in 1HFY27.
Three chart columns (Revenue, EBITDA & margin, Net Profit & EPS) each with a pale summary box on top; gradient banner of balance-sheet facts at the bottom.
1HFY27 total shareholder return of 15%, from ₹63.85 capital gain and ₹11 dividend per share; TSR 12 times the Nifty 50 and 4 times the Nifty 100; ranked Top 40 in Nifty 100 and Top 5 among Nifty Metal companies by market cap of ₹239k crore.
Gradient 2×2 stat tile on the left; flow diagram of two boxes merging into a TSR box on the right.
Investment case in four pillars: Global and India leadership (~74% primary zinc and ~92% primary lead market share), Growth Vision (2.0 MTPA refined metal capacity, 1,500 TPA silver, 510 KTPA fertiliser plant), Financial Strength (lowest-cost, AAA rating, leading dividend payer) and Sustainability (70% renewable power by FY28, Net Zero by 2050 or earlier).
Gradient photo header with white title; four columns with circular gradient icons, headings and bullet lists separated by thin vertical rules.
Section opener for the appendix.
Full-width underground photo with a gradient title tile on the left.
Waterfall from 2QFY26 EBITDA of ₹4,467 crore: prices +₹2,899 crore and FX +₹987 crore to adjusted EBITDA of ₹8,353 crore, then volume +₹627 crore, cost +₹322 crore and marketing & others −₹17 crore, reaching ₹9,285 crore in 2QFY27.
Photo panel on the left partly overlapped by a white card holding the waterfall chart.
2QFY27 vs 2QFY26 vs 1QFY27 vs 1HFY27 income statement in ₹ crore: revenue from operations 15,093 / 8,549 / 13,747 / 28,840; EBITDA 9,285; depreciation (962); finance cost (88); profit before tax 8,572; tax (2,160); net profit 6,412; EPS ₹15.18 (1H ₹28.12). Left column explains drivers such as higher prices, volumes and lower borrowings.
Icon-led commentary list on the left; financial table with green, light-green and blue column headers on the right.
Production and sales table: mined metal 271 KT, refined zinc 212 KT, refined lead 51 KT (+14%), saleable silver 173 tonnes / 5.6 million ounces (+20%); refined metal sales 265 KT; wind power 155 million units. Half-year totals and footnotes on subsidiary and lead-concentrate contributions.
Large white table card on a gradient photo background with Quarter (green) and Half Year (blue) header groups.
Revenue split for 2QFY27: zinc ₹8,224 crore (+54%), lead ₹1,130 crore, silver ₹4,111 crore (+141%), others ₹1,628 crore; EBITDA margin 62%. Zinc COP with royalty $1,228/MT; zinc LME $3,825/MT (+35%), lead LME $1,857/MT, silver LBMA $62.6/oz (+59%), INR:USD 95.57.
Same table-card layout as the previous page with Quarter and Half Year column groups.
Approximate annual EBITDA impact: zinc ±$100/MT = ₹725–750 crore; lead ±$100/MT = ₹150–175 crore; silver ±$1/oz = ₹200–225 crore; INR/USD ±₹1 = ₹325–350 crore; zinc COP ±$25/MT = ₹225–250 crore.
Photo on the left; three stacked tables on white cards with green and blue title bars on the right.
Six recognitions: RoSPA Gold award for the tailings reprocessing plant, Platinum and Gold at ET Edge SCM Fest Awards 2026, CNBC-TV18 'Masters of Risk' ESG award for the 5th consecutive year, PeopleFirst HR Excellence awards, LEED Platinum for the head office, and British Safety Council Five-Star grading (95%) for Zawar CPP.
Dark blue-green gradient background with a central trophy image and six numbered award blocks arranged three per side.
Showcases the company's reporting suite: Integrated Annual Report, Digital Integrated Annual Report, Tax Transparency Report, Climate Action Report, Sustainability Report and TNFD Report, plus the 'Ask Zincky' assistant.
2×3 grid of report cover mock-ups on pale green rounded cards with labels; robot-mascot button at the bottom.
Shareholding as of 30 September 2026: Vedanta 60.71%, Government of India 27.92% and public 11.37%. Five wholly-owned subsidiaries including Hindustan Zinc Alloys, Hindustan Zinc Fertilizers and Hindmetal Exploration Services.
Org chart: three shareholder boxes on top with percentage badges, green Hindustan Zinc pill in the centre, five subsidiary boxes below.
Earnings conference call on Monday, 19 October 2026 at 16:00 IST, with universal access and playback dial-in numbers (playback 19–26 October 2026) and investor relations and corporate communications contacts.
Gradient banner with call date across the top; dial-in table on the left; contact card on the right.
Closing slide with Vedanta and Hindustan Zinc logos, 'THANKYOU' in large white type and the investor relations email address.
Photo of three women miners on the left over a digital-overlay background; logo tile and large closing text on blue-green gradient panels on the right.
Common questions about this slide and the underlying presentation content.
For 2QFY27 (July–September 2026) the deck reports record revenue from operations of ₹15,093 crore (+77% YoY), EBITDA of ₹9,285 crore (+108%) at a 62% margin, and net profit of ₹6,412 crore (+142%). Mined metal production was 271 KT, refined metal 264 KT, saleable silver 173 MT (+20%), and zinc cost of production excluding royalty fell 29% to $703/MT. For 1HFY27, revenue was ₹28,840 crore, EBITDA ₹17,359 crore and net profit ₹11,881 crore.
The page offers the original 34-page PDF of the Hindustan Zinc Q2 FY27 earnings presentation and an editable PPTX converted from that PDF. The PPTX is a conversion, so fonts, gradients and chart objects may need minor clean-up, but it is a practical starting point for reusing layouts such as the KPI card grid, EBITDA waterfall or appendix tables.
It is the company's own English-language presentation, filed with the Indian stock exchanges (BSE/NSE) on 19 October 2026 as a disclosure under SEBI Regulation 30. The exchange cover letter has been removed, so page 1 is the deck cover. The source listed on this page links to the BSE filing. Indian fiscal year FY27 runs from April 2026 to March 2027, so Q2 FY27 covers July–September 2026.
It argues that tight LME inventories and supply disruptions are driving a global zinc deficit, with demand forecast to grow at 1.4% CAGR over the next decade and average reserve grades down from 6.9% in the 1990s to 2.8%. For silver, it points to a sixth straight year of deficit in 2026, industrial demand rising to 58% of the total in 2025, and silver prices reaching about $68/oz through September 2026.
According to the sensitivity slide, a $100/MT change in zinc moves annual EBITDA by about ₹725–750 crore, $100/MT in lead by ₹150–175 crore, $1/oz in silver by ₹200–225 crore, a ₹1 change in INR/USD by ₹325–350 crore, and a $25/MT change in zinc cost of production by ₹225–250 crore.
Two board-approved projects: a 250 KTPA integrated refined zinc expansion at Debari taking refined metal capacity from 1.1 to 1.4 MTPA (c.₹12,000 crore, target 2QFY29), and India's first 10 MTPA zinc tailings reprocessing plant (₹3,823 crore, target 4QFY28). The deck also lists critical-mineral blocks for tungsten, potash, rare earth elements and yttrium.
Study its structure: cover, disclaimer, agenda, KPI dashboard, gradient section dividers with presenter names, market charts, operations charts, financial review, and an appendix with an EBITDA bridge, income statement, performance tables and sensitivities. Its blue-to-green gradient titles, rounded photo panels and green/blue table headers form a consistent visual system. With 2Slides you can describe your own quarterly results or upload your data, pick a clean corporate theme, and generate a comparable earnings deck with KPI cards, charts and tables in minutes, then edit it.
As of 30 September 2026, the group structure slide shows Vedanta Limited holding 60.71%, the Government of India 27.92% and the public 11.37%. Hindustan Zinc has five wholly-owned subsidiaries, including Hindustan Zinc Alloys and Hindustan Zinc Fertilizers.
Exchange filing; first page is the cover letter to the exchange

Create Your Own Slides
Turn your ideas into professional presentations in seconds with 2slides AI.
Reference professional designs, choose your style, and generate slides with perfect text rendering. Powered by Nano Banana—start creating your presentation now.
Your AI Agent for slides. Save time, shine faster with intelligent presentation creation.


© 2026 2slides. All rights reserved.