
Part of Investor presentation examples · Indian investor presentation examples
Canara Bank's Financial Results presentation for Q2 FY 2026-27 (July–September 2026), the 46-slide investor and earnings deck filed with the Indian stock exchanges on 14 October 2026, covering business growth, profitability, asset quality, capital, digital reach and full-year guidance.
Uses this deck’s cover as a style reference for slides made from your own content. Or pick any page below to use its layout as the reference.
Quick Navigation
Tags
Share the slides
Canara Bank's Financial Results presentation for Q2 FY 2026-27 (July–September 2026), the 46-slide investor and earnings deck filed with the Indian stock exchanges on 14 October 2026, covering business growth, profitability, asset quality, capital, digital reach and full-year guidance.
Detailed view of each slide page, including layout, key content and visual elements.
Cover slide announcing Canara Bank's Q2 FY 2026-27 financial results with the tagline 'A Legacy of Trust, Togetherness, Transformation' and promotional badges for the bank's products.
Full-bleed handshake photograph with a blue arrow-ribbon title banner across the top, logo top right, tagline bottom left and a contact/social footer strip.
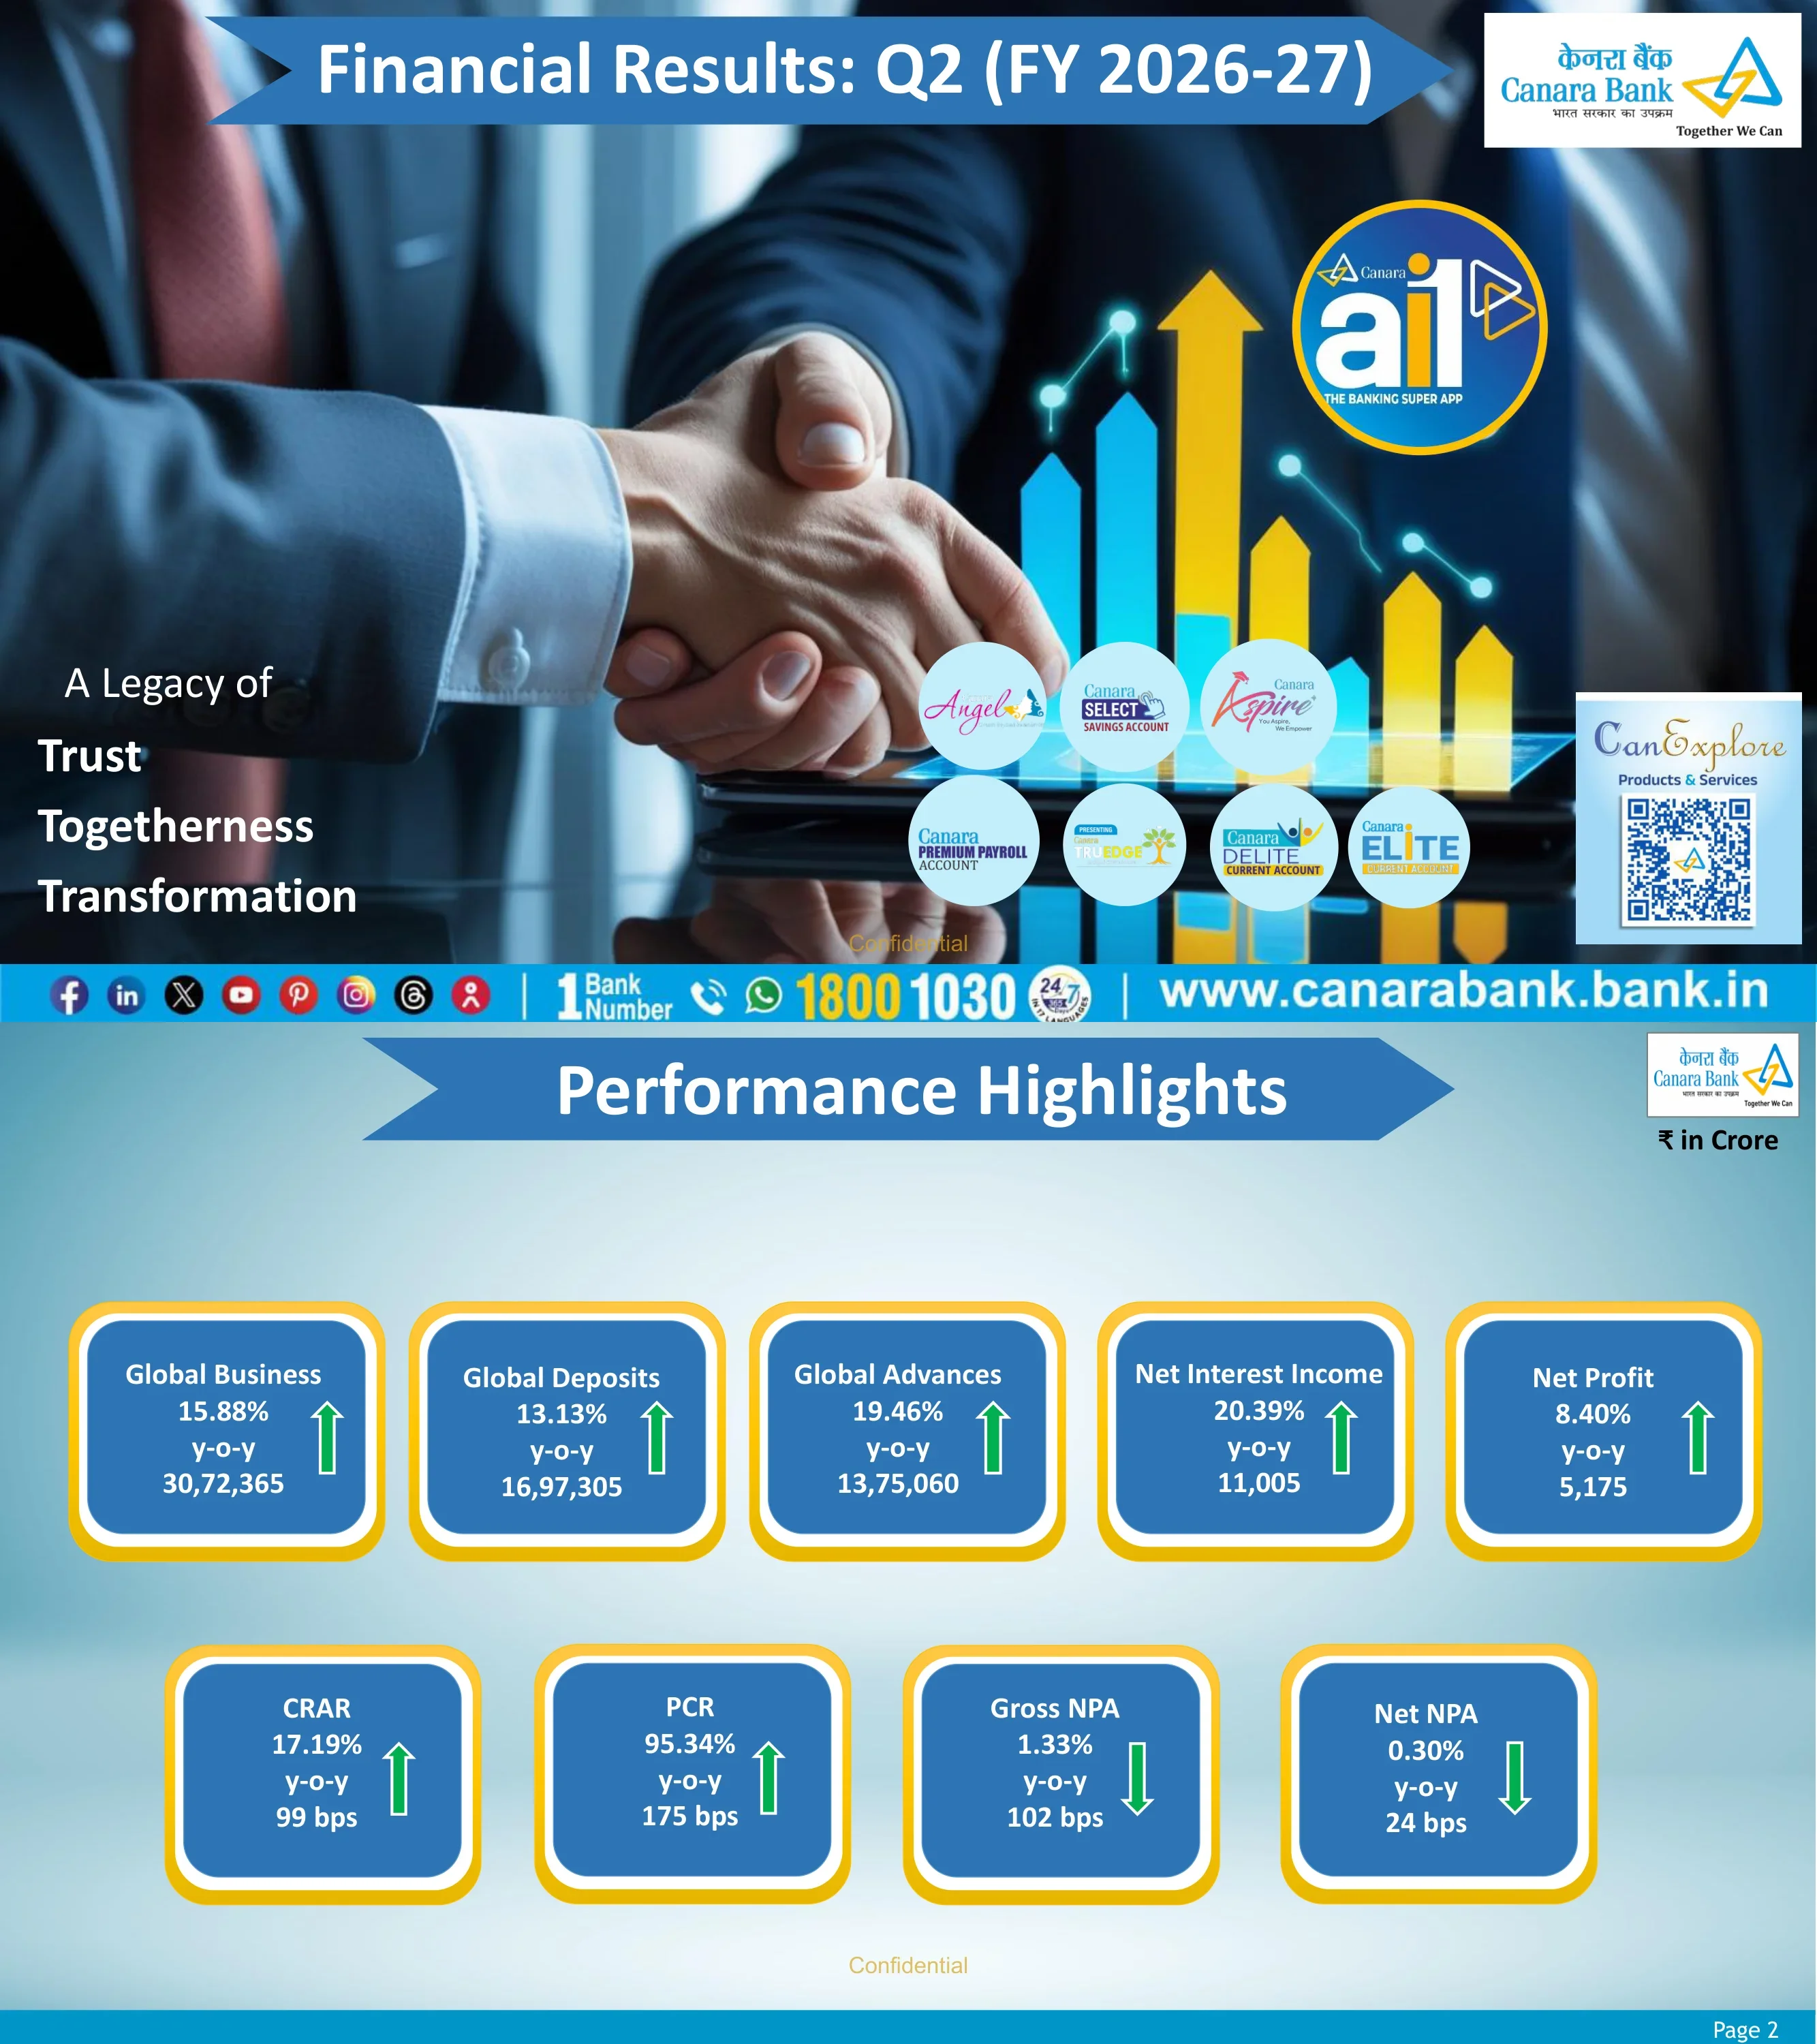
Nine headline KPIs (₹ crore): global business ₹30,72,365 (+15.88% y-o-y), global deposits ₹16,97,305 (+13.13%), global advances ₹13,75,060 (+19.46%), NII ₹11,005 (+20.39%), net profit ₹5,175 (+8.40%); CRAR 17.19% (+99 bps), PCR 95.34% (+175 bps), Gross NPA 1.33% (-102 bps), Net NPA 0.30% (-24 bps).
Two rows of rounded KPI tiles (five on top, four below) with royal-blue fill and thick yellow borders on a sky-blue gradient.
Segment highlights: RAM credit ₹8,12,310 crore (+21.03%), retail credit ₹3,30,587 crore (+31.61%), housing loans ₹1,34,501 crore (+17.35%), vehicle loans ₹29,326 crore (+25.50%), MSME ₹1,77,600 crore (+15.49%), EPS ₹22.06 (+5.00%), credit cost 0.47% (down 21 bps) and slippage ratio 0.58% (down 18 bps).
Two rows of four blue diamond badges, each with stacked white and yellow chevron shadows beneath.
Agenda listing nine sections with page ranges: Business Performance (6-13), Financial Performance (15-22), Investments (24-25), Asset Quality (27-32), Capital & Shareholding (34-35), ESG (37), Distribution Network & Digital Footprint (39-42), Subsidiaries & Associates (43) and Guidance for March 2027 vs Actuals for Sep 2026 (44).
Vertical stack of wide blue bars with yellow outlines, each paired with a small page-range box on the right.
Section divider for Business Performance, showing loan products (home, vehicle, education and gold loans) rising out of a smartphone, with the bank's tagline.
Full-bleed photographic background, tagline top left, arrow-ribbon section title bottom left, logo top right and a product badge bottom right.
Global gross business grew from ₹26,51,322 crore (Sep'25) to ₹30,72,365 crore (Sep'26), +15.88% y-o-y; overseas advances jumped 58.46% to ₹1,10,307 crore and global deposits rose 13.13% to ₹16,97,305 crore. Global CD ratio climbed from 76.72% to 81.01%.
Full-width data table with four period columns plus Q-o-Q and Y-o-Y growth; headline rows highlighted in peach, sub-rows in light blue.
CASA deposits reached ₹4,48,889 crore (+4.85% y-o-y) while current deposits fell 16.71%; term deposits grew 13.67% to ₹10,99,090 crore and retail term deposits 17.17%. Total domestic deposits were ₹15,47,979 crore (+10.97%).
Full-width table with savings, current, CASA, term and total rows, Q-o-Q and Y-o-Y growth columns.
RAM (Retail, Agriculture, MSME) credit rose 21.03% to ₹8,12,310 crore and now makes up 59% of domestic advances versus 58% a year earlier; retail grew 31.61% to ₹3,30,587 crore and corporate & others 17.26% to ₹5,62,750 crore.
Left column with two stacked 3D pie charts (Sep'26 and Sep'25 mix); right two-thirds holding the advances table with growth columns.
The bank exceeded all priority sector norms: total priority 44.99% of ANBC vs 40% norm, agriculture 20.61% vs 18%, small and marginal farmers 12.74% vs 10%, non-corporate farmers 15.55% vs 14%, weaker sections 18.73% vs 12% and micro enterprises 9.22% vs 7.5%.
Large orange arrow callout on the left labelled 'Mandated Norms under Priority Sector', with a bulleted list of six achievements on the right.
Year-on-year comparison of four portfolios: RAM ₹6,71,141 crore to ₹8,12,310 crore (+21.03%), retail loans ₹2,51,190 crore to ₹3,30,587 crore (+31.61%), housing loans ₹1,14,615 crore to ₹1,34,501 crore (+17.35%) and vehicle loans ₹23,367 crore to ₹29,326 crore (+25.50%).
2x2 quadrant grid divided by orange cross lines, each quadrant a two-bar Sep'25 vs Sep'26 chart with a growth trend line.
Credit by industry: NBFC exposure ₹1,77,763 crore (+21.36% y-o-y) is now larger than infrastructure at ₹1,31,631 crore (-9.26%); construction grew fastest at 36.41%, with food processing +22.04% and chemicals +21.29%.
Full-width table across ten sectors with Sep'25, Jun'26, Sep'26 columns and Q-o-Q / Y-o-Y growth.
87% of the externally rated domestic loan book above ₹50 crore (₹3,47,486 crore) is rated A and above, up from 83% a year earlier; BBB is 8% and BB and below 5%. PSU customers carry ₹48,716 crore of central and ₹51,665 crore of state government guarantees.
Table on the left two-thirds with a PSU guarantee sub-table below; 3D stacked pyramid graphic on the right showing rating shares.
Standard NBFC exposure grew to ₹1,76,370 crore, of which ₹1,76,302 crore (effectively 100%) is rated A and above; BBB and lower-rated exposure is negligible.
Single centered table with exposure and % share columns for Sep'25, Jun'26 and Sep'26.
Section divider for Financial Performance showing a businessman touching a rising golden bar chart next to the ai1 super app logo.
Full-bleed photo with tagline mid-left, arrow-ribbon section title at the bottom and a product badge at the bottom right.
Quarterly interest income rose 11.46% y-o-y to ₹35,159 crore, led by interest on advances at ₹26,754 crore (+15.91%); non-interest income fell 18.17% to ₹5,772 crore, so total income grew 6.04% to ₹40,931 crore.
Full-width table with quarterly columns and growth, alternating peach headline rows and light-blue detail rows.
Fee-based income rose 6.54% y-o-y to ₹2,755 crore and service charges 13.85%, but treasury income fell 68.48% to ₹499 crore and recoveries in written-off accounts fell 25% to ₹1,260 crore, taking total non-interest income to ₹5,772 crore.
Dense full-width table with eleven line items, peach rows for fee, treasury, recovery and total lines.
Interest expenses rose 7.82% y-o-y to ₹24,154 crore and operating expenses 5.42% to ₹8,019 crore, with staff cost flat (-0.27%); total expenses were ₹32,173 crore, up 7.21%.
Full-width table with interest and operating expense breakdown plus growth columns.
Net interest income ₹11,005 crore (+20.39% y-o-y, +7.73% q-o-q), operating profit ₹8,758 crore (+1.98%), provisions ₹3,583 crore (-6.06%) and net profit ₹5,175 crore (+8.40%).
Summary P&L table with quarterly figures and growth columns; NII, operating profit and net profit rows highlighted in peach.
Five-quarter trends: operating profit ₹8,588 crore to ₹8,758 crore, net profit ₹4,774 crore to ₹5,175 crore, PCR 93.59% to 95.34%, Gross NPA 2.35% to 1.33% and Net NPA 0.54% to 0.30%.
Five small bar-and-line charts arranged in three columns separated by orange vertical rules.
Total provisions fell 6.06% y-o-y to ₹3,583 crore; NPA provisions were ₹1,339 crore (-10.97%), there was a ₹441 crore write-back on non-performing investments, and income tax rose 23.36% to ₹1,801 crore.
Full-width table with peach total-provision row and growth columns.
Cumulative H1 ratios at Sep'26: RoA 1.04%, RoE 18.49%, cost-to-income 48.41%, CD ratio 81.01%, annualised EPS ₹22.06, book value ₹124.56 and NIM 2.53% (quarterly NIM 2.55%).
Table with quarterly and cumulative sub-columns for each of four periods.
Cost of deposits eased from 5.66% to 5.27% and cost of funds from 5.21% to 4.88%, while yield on advances moved from 8.40% to 8.03%; NIM improved to 2.53% from 2.52%.
2x3 grid of small four-bar charts separated by orange dividing lines.
Section divider for Investments showing a hand dropping a coin into a Canara Bank safe, with wooden house blocks and badges for Insta MF loan and Canara Crest.
Full-bleed photograph with tagline top left, arrow-ribbon section title bottom left and product badges.
Total gross investment rose to ₹4,13,480 crore; SLR securities were ₹3,62,238 crore (88.90% of domestic investments), and held-to-maturity holdings of ₹3,25,099 crore formed 79.79% of the domestic book.
Numbered table (Sl. No column) with nested sub-items for SLR, non-SLR and HTM/AFS/FVTPL categories.
Non-SLR investments fell 16.48% y-o-y to ₹45,228 crore, largely from a ₹7,766 crore drop in 'Other'; central government recapitalisation bonds of ₹18,238 crore make up 40.33% of the book.
Full-width table with three period columns, % share and Y-o-Y variation (amount and %).
Section divider for Asset Quality with cupped hands protecting a blue house carrying the ai1 logo.
Full-bleed photo, tagline on the right, arrow-ribbon section title bottom left, product badge bottom right.
Gross NPA fell from ₹27,040 crore (2.35%) to ₹18,299 crore (1.33%) and Net NPA from ₹6,113 crore (0.54%) to ₹4,053 crore (0.30%); PCR rose to 95.34% and annualised credit cost fell to 0.47%.
Table with alternating light-blue amount rows and peach ratio rows across four periods.
In the September 2026 quarter, NPAs opened at ₹20,354 crore, fresh additions were ₹1,916 crore and reductions ₹3,971 crore (including ₹2,800 crore write-offs), closing at ₹18,299 crore; total cash recovery including written-off accounts was ₹2,277 crore.
Long reconciliation table with peach rows marking the total reduction, net NPA and total recovery lines.
Sector GNPA ratios at Sep'26: retail 0.32%, housing 0.41%, vehicle 0.46%, agriculture 1.65%, MSME 3.90% and corporate & others 0.94%; domestic GNPA is 1.38% and global 1.33%.
Table with four NPA period columns plus advances outstanding and GNPA % columns.
Industry NPAs at Sep'26: infrastructure ₹1,560 crore (1.19% GNPA, down from ₹3,495 crore a year earlier), iron & steel 2.03%, textile 3.68%, food processing 6.16% and engineering 4.27%.
Five-row table with large row heights, four period columns and a GNPA % column.
SMA position (₹5 crore and above): total SMA 0/1/2 fell to ₹7,043 crore or 0.51% of gross advances from 0.65% a year earlier; SMA 1 & 2 combined were ₹4,142 crore (0.30%).
Table with number of accounts, outstanding and % to gross advances for three periods.
374 accounts with ₹28,022 crore book liability are referred to NCLT with 99% provision coverage (RBI list 1 & 2 at 100%). Cumulative FY 2026-27 recovery via NCLT reached ₹610 crore across 81 accounts, led by resolution (₹355 crore).
Two stacked tables: NCLT exposure by list on top and recovery by mode below.
Section divider for Capital & Shareholding showing hands placing branded coins into a blue glass bowl bearing the ai1 super app logo.
Full-bleed photo with tagline top left, arrow-ribbon section title bottom left and product badge bottom right.
Total capital rose to ₹1,51,698 crore against risk-weighted assets of ₹8,82,732 crore, giving a CRAR of 17.19% (CET1 12.80%, AT1 2.25%, Tier II 2.14%) versus 16.20% a year earlier; RWA to gross advances fell to 64.20%.
Capital table on the left, stacked column chart of CRAR components on the right.
Government of India holds 62.93%, FIIs/FPIs 12.27%, resident individuals 10.51%, mutual funds 7.00%, insurance companies 4.32%, others 2.40% and staff 0.57%; FII/FPI holding was 10.55% at Mar'25 and 14.24% at Mar'26.
Large exploded 3D pie chart with callout labels, plus a small FII/FPI holding table at top right.
ESG section divider with hands holding a glass globe labelled 'Canara Green Deposit' over coins, wind turbines in the background and Rooftop Solar and scholarship badges.
Full-bleed nature photo with tagline mid-left, arrow-ribbon title along the bottom and badges.
Environmental: rainwater harvesting at 122 properties, rooftop solar at 174 properties (4,417 kWp), 44 green building certifications and FY 2025-26 Scope 1 and 2 emissions of 11,272.51 and 165,168.84 tCO2. Social: 150 financial literacy centres held 7,550 camps reaching 7,91,056 people in September 2026. Governance: board-approved ESG policy, a Chief Ethics Officer, and an improved Sustainalytics ESG risk rating (High to Medium).
Three rounded columns tinted green, yellow and peach for Environmental, Social and Governance, each with an icon header and dense bullet text.
Distribution network divider highlighting 10,100+ branches across India, international branches in London, New York, Dubai (DIFC) and IBU GIFT City, and 24/7 customer support.
Dark photographic background with a central hub circle connected to four city-photo roundels, tagline top left and section title at the bottom.
Domestic branches grew to 10,146 and BC points to 13,087, giving 23,237 total banking outlets, with 10,764 ATMs and recyclers. Branches split 32% rural, 30% semi-urban, 19% urban and 19% metro, plus four international branches.
Network table at top, 3D pie chart of branch split bottom left and a peach-headed list of international branches bottom right.
Digital Footprint divider showing a hand holding a phone running the ai1 app, with badges for Corporate ai1, EasyFee, ai1 Pe and e-Bank Guarantee.
Full-bleed photo with tagline left, arrow-ribbon title at the bottom and floating app UI cards.
Year-on-year digital growth: MeitY digital transactions 566.30 to 717.65 crore, e-transactions 1,449.71 to 1,801.56 crore, mobile banking registrations 3.03 to 3.54 crore, UPI registrations 3.68 to 4.30 crore, credit cards 10.55 to 13.11 lakh and CBDC registrations 15.27 to 19.58 lakh.
Ten small two-bar charts in two rows, alternating yellow and light-blue bars.
Three new launches: scheduled bulk payments and future-dated fund transfers in internet banking, biometric authentication for UPI transactions up to ₹10,000, and programmable CBDC wallet integration in BHIM.
Three stacked horizontal banners (blue, pink, navy), each anchored by a circular label on a curved connecting line.
For the six months to Sep'26, subsidiaries contributed a ₹12.92 crore share of profit and associates ₹518.75 crore, led by Kerala Grameena Bank (₹214.49 crore) and Can Fin Homes (₹162.67 crore); Canara Robeco AMC and Canara HSBC Life are also listed.
Single table split into Subsidiaries and Associates blocks with peach section headers, showing holding %, total profit and the bank's share.
Actuals beat most FY27 guidance: advances growth 19.46% vs 11–12%, business growth 15.88% vs 10–11%, deposit growth 13.13% vs 9–10%, RoE 18.49% vs 16.50%, EPS ₹22.06 vs ₹20, GNPA 1.33% vs 1.50% and credit cost 0.47% vs 0.75%. CASA at 29.00% is below the 30–32% target.
Three-column scorecard table (parameter, guidance, actual) with actuals printed in green where they meet or beat guidance.
Standard forward-looking statements disclaimer: the presentation is for information only, actual results may differ because of risks such as NPA levels, growth, provisioning and market exposure, and the bank has no obligation to update the statements.
Centered title with a single justified paragraph of bold navy text.
Closing slide with the 'Together We Can' slogan, a large 'Thank You' and a note thanking stakeholders for their support and trust.
Centered stack: blue italic slogan, oversized peach italic 'Thank You' with drop shadow, and italic blue closing message.
Common questions about this slide and the underlying presentation content.
Net profit was ₹5,175 crore, up 8.40% year on year, and net interest income rose 20.39% to ₹11,005 crore. Global business reached ₹30,72,365 crore (+15.88%), with advances of ₹13,75,060 crore (+19.46%) and deposits of ₹16,97,305 crore (+13.13%). Asset quality improved further: Gross NPA 1.33%, Net NPA 0.30%, PCR 95.34% and CRAR 17.19%.
Yes. The page offers the original 46-page PDF and an editable PPTX converted from that PDF, so you can reuse the tables, KPI tiles and chart layouts in PowerPoint, Keynote or Google Slides. Because the PPTX is a conversion, some text boxes and charts may need minor touch-ups.
It is Canara Bank's own Financial Results Q2 (FY 2026-27) presentation, filed with the Indian stock exchanges (BSE/NSE) on 14 October 2026 as a disclosure under SEBI Listing Regulations (Regulation 30). The source is the BSE corporate filing linked on this page. The exchange cover letter has been removed, so page 1 is the deck's own cover. Figures are as reported by the bank and are not independently audited by 2Slides.
As of 30 September 2026 the bank was ahead of most full-year targets: advances growth of 19.46% against 11–12% guidance, deposit growth of 13.13% against 9–10%, RoE of 18.49% against 16.50%, annualised EPS of ₹22.06 against ₹20, and credit cost of 0.47% against 0.75%. The domestic CASA ratio, at 29.00%, was below its 30–32% target.
It covers deposit and loan mix (RAM credit is 59% of domestic advances), priority sector compliance, industry credit and external rating profiles, investments, detailed NPA movement and SMA/NCLT data, Basel III capital, shareholding (Government of India 62.93%), ESG practices, a network of 10,146 domestic branches and 23,237 banking outlets, digital adoption metrics, and subsidiaries and associates.
It uses a sky-blue gradient background, royal-blue arrow-ribbon title banners and a consistent table style: a blue header row with alternating light-blue and peach highlight rows. Highlights are shown as yellow-framed KPI tiles and diamond badges with directional arrows. Full-bleed photo section dividers repeat the 'Trust, Togetherness, Transformation' tagline, and the deck closes with a guidance-vs-actuals scorecard. It shows how to keep a 46-slide, table-heavy bank deck consistent and easy to scan.
Use this deck as a structural reference: highlights, contents, business performance, financials, asset quality, capital, ESG, network, then guidance. Upload your own results file or outline to 2Slides with 'Create Slides from File', or use 'Create Slides Like This' with these pages as the style reference. 2Slides then generates a deck with similar KPI tiles, data tables and section dividers, which you can edit and export to PPTX or PDF.
Exchange filing; first page is the cover letter to the exchange

Create Your Own Slides
Turn your ideas into professional presentations in seconds with 2slides AI.
Reference professional designs, choose your style, and generate slides with perfect text rendering. Powered by Nano Banana—start creating your presentation now.
Your AI Agent for slides. Save time, shine faster with intelligent presentation creation.


© 2026 2slides. All rights reserved.