
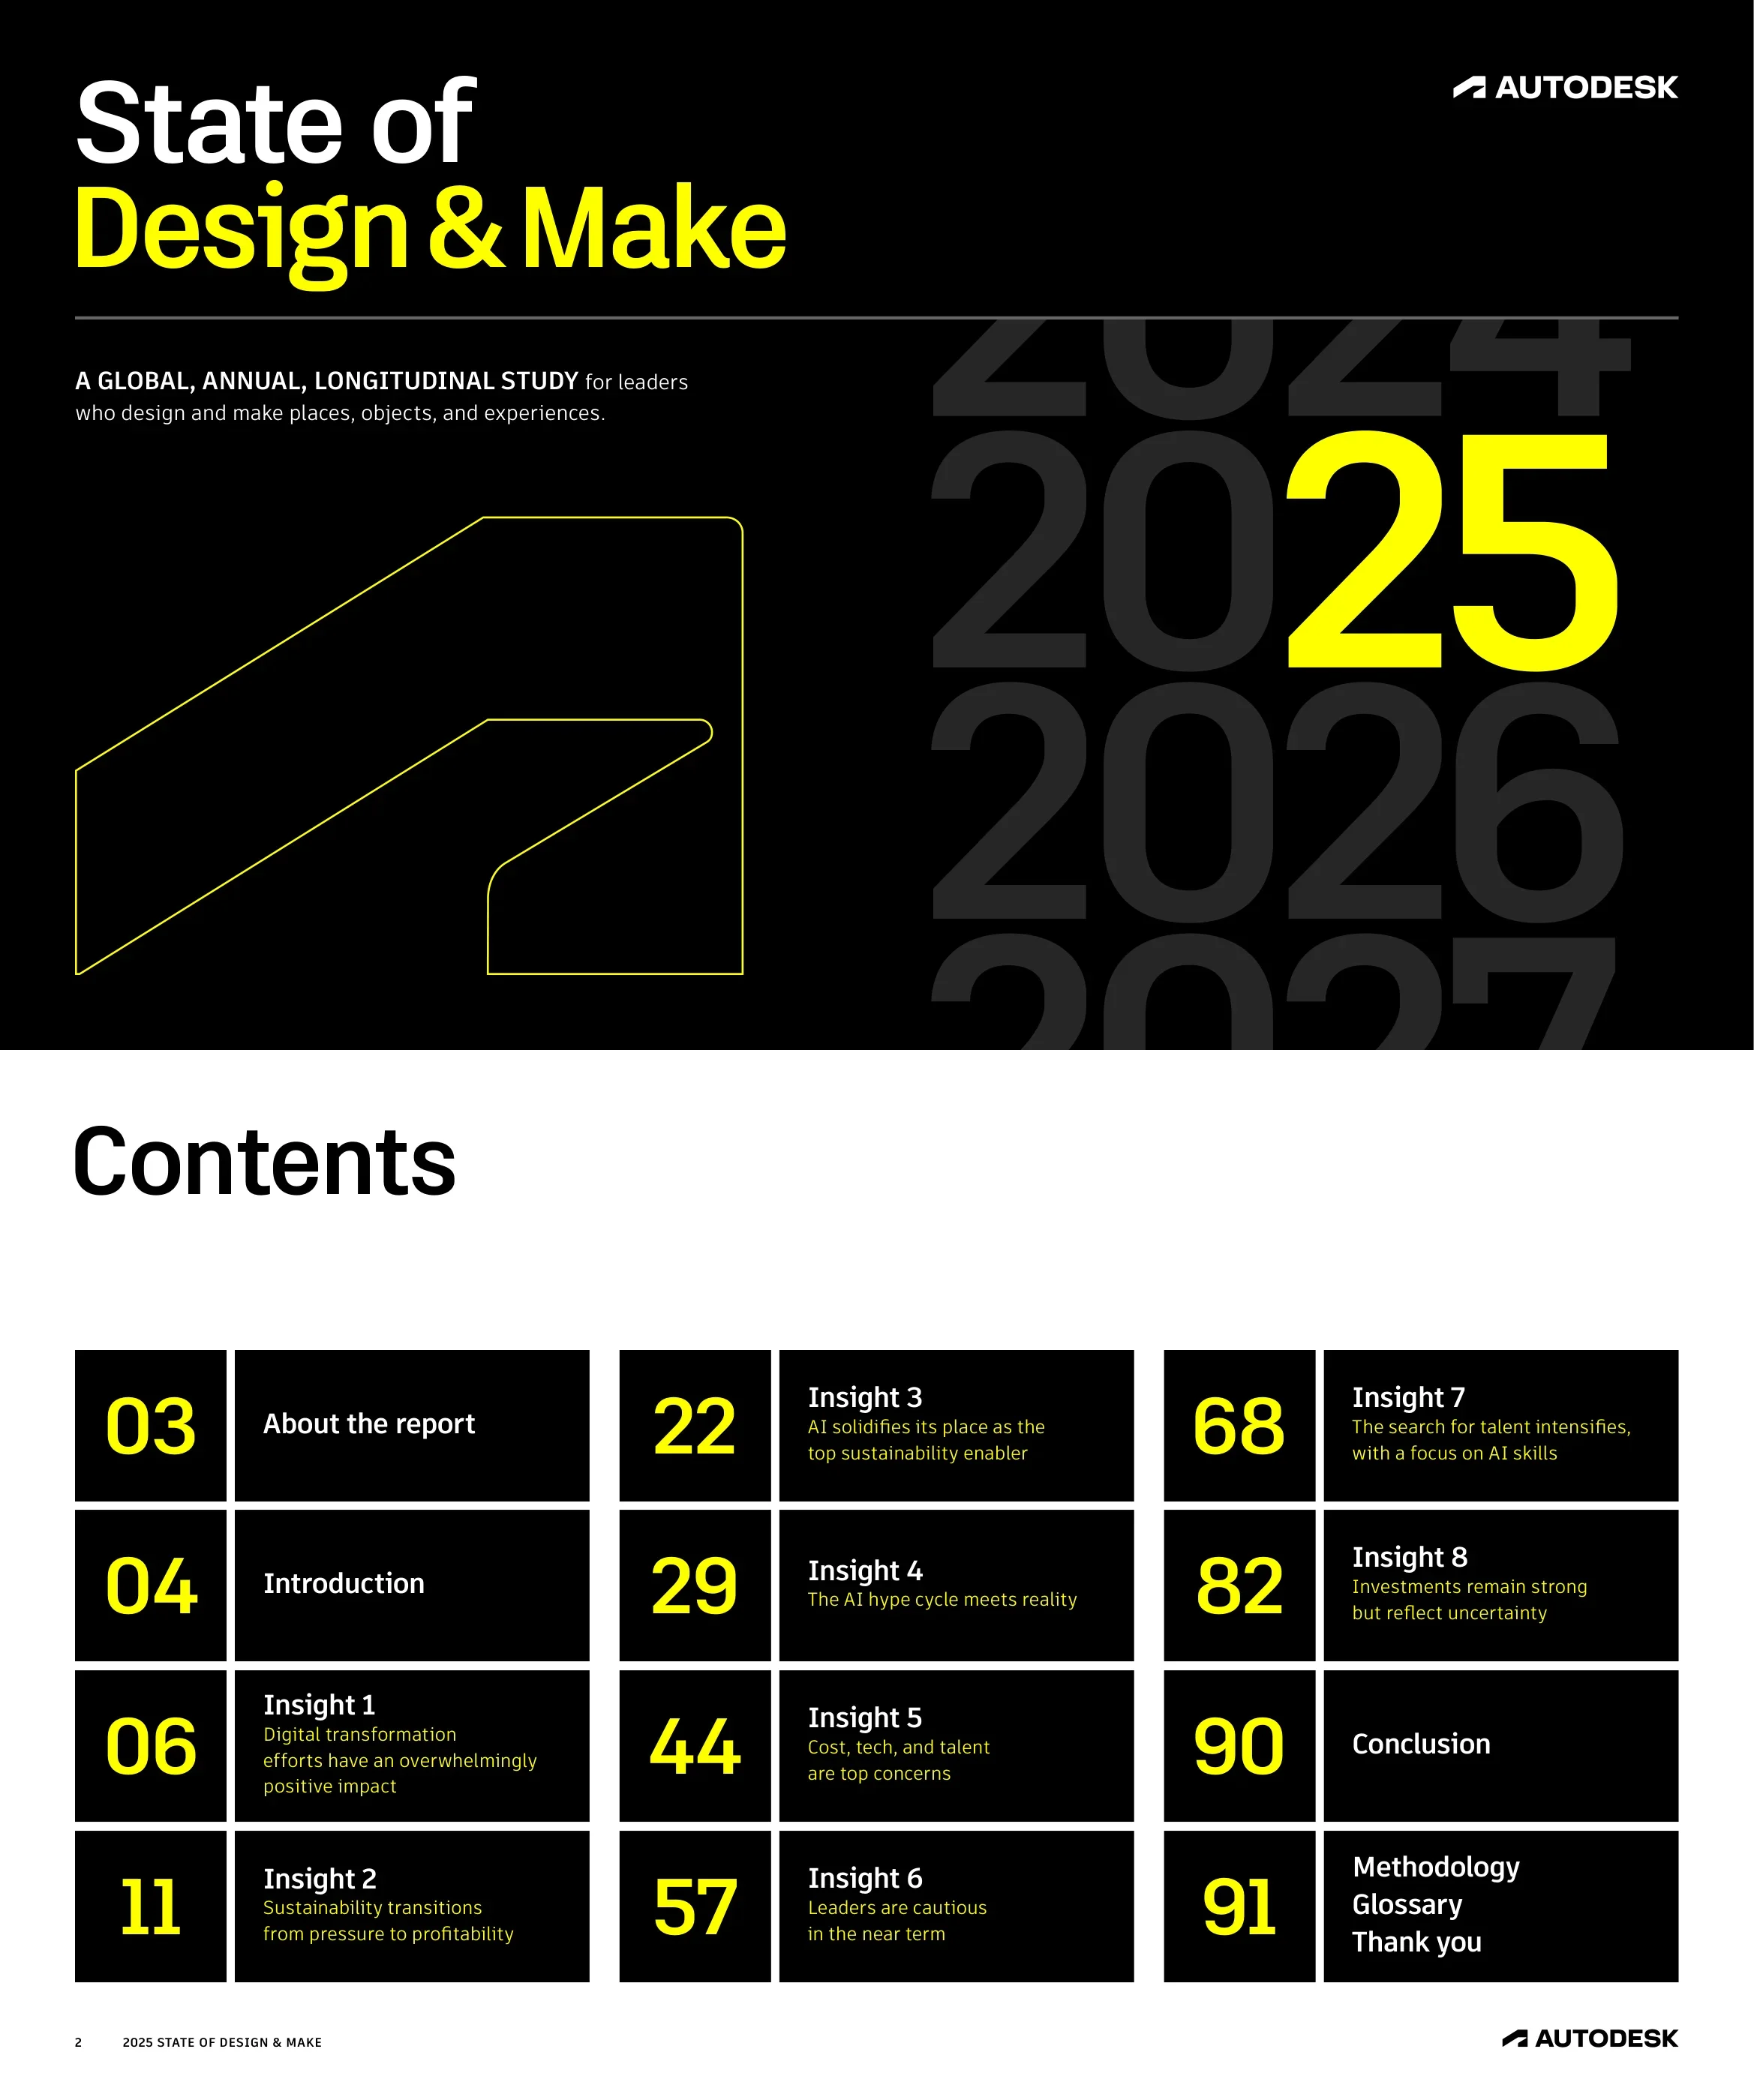
2025 State of Design & Make — Autodesk's global annual longitudinal industry research report surveying 5,594 leaders across AECO, D&M, and M&E on digital transformation, AI, sustainability, talent, and investment trends
Uses this deck’s cover as a style reference for slides made from your own content. Or pick any page below to use its layout as the reference.
Quick Navigation
Tags
Share the slides
2025 State of Design & Make — Autodesk's global annual longitudinal industry research report surveying 5,594 leaders across AECO, D&M, and M&E on digital transformation, AI, sustainability, talent, and investment trends
Detailed view of each slide page, including layout, key content and visual elements.
The cover introduces Autodesk's third annual global research report for leaders who design and make places, objects, and experiences, anchored by a giant yellow '25' on a black background with a yellow line-art isometric object.
Full-bleed black background with centered report title, large typographic year numeral, yellow accent line-art illustration, and Autodesk logo top-right
The table of contents lists all 12 major sections with yellow page number callouts, from 'About the Report' through the eight Insights to Conclusion and Methodology.
Clean two-column list with large yellow page numbers on the left and section titles on the right, minimal black-and-white layout
This page explains the 'Design and Make' definition—the convergence of technologies producing digital and built assets—and describes the survey's scope: 5,594 industry leaders across AECO, D&M, and M&E in the third year of longitudinal comparisons.
Half-page yellow paper-fold hero image on the left, editorial body copy with pull-out statistics on the right
The introduction summarizes key macro findings: rising costs, cooling AI optimism, growing global uncertainty, and the enduring resilience of digital transformation investments.
Full-bleed blue molecular-sphere hero image with black text overlay box containing introduction copy and key finding highlights
This page defines 'digitally mature' organizations and establishes their performance advantages in resilience, data utilization, supply-chain diversification, and adaptability to change.
Full-bleed green geodesic sculpture hero with inset statistical callouts and body narrative copy
This section divider introduces Insight 1: 'Digital transformation efforts have an overwhelmingly positive impact,' displayed against a black background with a giant yellow '01' rolling numeral.
Black full-bleed background with yellow 'INSIGHT 01' tag top-left, large insight title center, and giant stacked gray/yellow '01' numerals on the right
A bubble chart demonstrates that more than 50% of surveyed leaders report positive ROI from digital transformation across customer satisfaction, productivity, and innovation dimensions.
Full-width bubble chart visualization with axis labels and percentage callouts, minimal white background with chart legend
Digitally mature organizations outperform peers by 26–35 percentage points across performance, preparedness, investment agility, and change-keeping, supported by executive quotes from Nitesh Alagh and Anna Noneder.
Blue wave hero image on one half, four statistical callout tiles and two pull-quote boxes on the other half
A comparative bar chart shows that cost surged as the top barrier to digital transformation, jumping from 35% in 2024 to 44% in 2025.
Side-by-side grouped bar chart comparing 2024 and 2025 barrier rankings, with highlighted cost bar and supporting narrative copy
This page explores the cost-as-barrier theme in depth, featuring a purple isometric-cube hero and a pull quote from Dr. Max Clark of Parsons on cost management strategies.
Purple isometric-cube hero image on one half, editorial narrative with inset pull-quote box on the other half
This section divider introduces Insight 2: 'Sustainability transitions from pressure to profitability,' displayed with the giant yellow '02' numeral on a black background.
Black full-bleed background with yellow 'INSIGHT 02' tag top-left, large insight title center, and giant stacked '02' numerals on the right
Seventy-two percent of leaders say sustainability can generate more than 5% annual revenue, signaling a shift from obligation to commercial opportunity, with a quote from Mohamad Kassir of Egis Group.
Teal wire-mesh hero image on one half, key statistic callout and pull-quote box on the other half with narrative body copy
A trend chart reveals that stakeholder pressure on sustainability—from customers, employees, investors, and policymakers—has declined consistently from 2023 to 2025, with a supporting quote from Marcelo Piller.
Full-width multi-line trend chart with four stakeholder category lines descending over three years, with pull-quote inset
Despite declining external pressure, sustainability commitments remain near-universal at 95%, suggesting organizations have internalized the agenda, as noted by Andy Yu of Build King.
Orange paper-spiral hero on one half, 95% statistic callout, narrative body copy, and Andy Yu pull-quote box on the other
A chart shows the gap between long-term and short-term sustainability strategy has narrowed dramatically to 12% in 2025, down from 26% in 2023, with a quote from Eng. Tarek ElGamal of Redcon Construction.
Gap-narrowing area or bar chart showing the 2023–2025 convergence, inset pull-quote box, and supporting narrative
Digitally mature companies demonstrate an 85% long-term and 74% short-term sustainability benefit recognition rate, showing that technological sophistication drives holistic sustainability strategy.
Green wave hero image on one half with two key percentage callouts and editorial narrative on the other half
An AMER bar chart shows that Brazil and the US lead in customer-driven sustainability influence at approximately 80%, while Mexico dropped significantly to 62%.
Full-width regional bar chart with country-level percentage bars, color-coded by country, with brief narrative context
This page provides the Americas sustainability narrative context, featuring a purple cube hero and a pull quote from Vinicius Prata of Eletrobras on regional sustainability dynamics.
Purple cube 3D hero on one half, Americas narrative body copy and Vinicius Prata pull-quote box on the other
An APAC chart shows Japan as least influenced by customers at 57%, while China saw a significant drop from 85% to 71%, with a quote from Jun Xue of Xiaomi EV.
Full-width APAC bar chart with country-level percentage bars and year-over-year change annotations, inset pull quote
An EMEA chart shows Turkey as the most customer-influenced market at 77%, with the Netherlands the least at 64%, and broad declines across the region from 2024.
Full-width EMEA country-level bar chart with 2024 vs 2025 comparison bars and broad-decline annotation
This page covers the EMEA sustainability narrative, featuring a blue skyscraper-ring hero and a pull quote from Pierre-Yves Massille of Egis Group on European sustainability dynamics.
Blue skyscraper-ring 3D hero on one half, EMEA narrative body copy and Pierre-Yves Massille pull-quote box on the other
This section divider introduces Insight 3: 'AI solidifies its place as the top sustainability enabler,' displayed with the giant yellow '03' numeral on a black background.
Black full-bleed background with yellow 'INSIGHT 03' tag top-left, large insight title center, and giant stacked '03' numerals on the right
AI has climbed to the top sustainability enabler for the second consecutive year, with 39% of organizations now using AI to advance sustainability goals, up from 34% and 26% in prior years.
Yellow hexagon 3D hero on one half, key statistic trend callout and Nitesh Alagh pull-quote box on the other with supporting narrative
A Sankey-style flow chart visualizes the continuing integration of AI and sustainability strategy from 2023 to 2025, showing AI's rise from fifth place to first among sustainability enablers.
Full-width Sankey-style flow diagram with ranked-enabler positions across three years, color-coded flow bands
This page illustrates concrete AI-sustainability impact through examples spanning data center efficiency, natural disaster visualization, and carbon offset management, with a quote from Brian Alting of Moody Nolan.
Blue fabric-ripple 3D hero on one half, three use-case example tiles and Brian Alting pull-quote box on the other
An APAC line chart shows South Korea's largest increase in AI adoption for sustainability (15% to 43%), while India leads the region at 52%, per a quote from Yongsik Jeong of Samoo.
Full-width APAC multi-line trend chart with country-level trajectories and highlighted South Korea surge, inset pull quote
An EMEA line chart shows Germany and the Nordics recording the largest jump in AI-for-sustainability adoption (to 40% and 39% respectively), with Turkey highest in the region at 47%.
Full-width EMEA multi-line trend chart with country-level trajectories and highlighted Germany/Nordics jumps, inset Dr. Max Clark pull quote
A D&M sector line chart shows industrial machinery leading in AI-enabled sustainability efforts, complemented by a solution spotlight on Yamaha Motor and Final Aim's AI-designed EV concept.
D&M sector line chart on one half, Yamaha Motor / Final Aim solution spotlight box and Hidenori Saito pull quote on the other
This section divider introduces Insight 4: 'The AI hype cycle meets reality,' displayed with the giant yellow '04' numeral on a black background.
Black full-bleed background with yellow 'INSIGHT 04' tag top-left, large insight title center, and giant stacked '04' numerals on the right
AI optimism has fallen—those agreeing 'AI will enhance my industry' dropped from 78% to 69%—while concern that AI will destabilize industries rose to 48%, as noted by Fumihiro Ojima of Tokyu Construction.
Green wave 3D hero on one half, two contrasting percentage-change callouts and Fumihiro Ojima pull-quote box on the other
An area chart shows concern about AI-related industry disruption climbing from 41% in 2024 to 48% in 2025, with a quote from Amarnath Patnam of Sobha Realty.
Full-width rising area chart with 2024 and 2025 data points highlighted, inset Amarnath Patnam pull-quote box
A four-panel chart shows AI sentiment declining across all measured dimensions: industry-enhance down 9%, confidence down 9%, creative potential down 10%, and trust down 11%.
Four-panel side-by-side metric comparison with year-over-year percentage-change annotations and consistent color coding
This page details cybersecurity and regulatory uncertainty as the primary AI concerns, with quotes from Christian Ahlers of Lindner Group and Yongsik Jeong of Samoo on responsible AI adoption.
Blue curl 3D hero on one half, two-column narrative copy with two pull-quote boxes on the other
An AECO bar chart shows utilities and telecom are least concerned about AI disruption, while oil and gas firms express the greatest concern across the built-environment sector.
Horizontal bar chart ranking AECO sub-sectors by AI concern level, with color-coded bars and percentage labels
This page narrates the AECO sector's nuanced AI outlook, featuring a yellow fan-spiral hero and a pull quote from Ammar Al Assam of Dewan Architects on balancing AI opportunity with caution.
Yellow fan-spiral 3D hero on one half, AECO AI narrative copy and Ammar Al Assam pull-quote box on the other
A D&M bar chart shows life sciences experiencing both the highest disruption concern (57%) and the highest industry-enhancement belief (75%), illustrating a dual AI sentiment.
Grouped bar chart comparing disruption vs enhancement belief across D&M sub-sectors, with life sciences highlighted
This page covers the design and manufacturing sector's AI narrative, featuring a pink/blue ridged hero and a quote from Blaine Buenger of Foth on navigating AI within regulated manufacturing contexts.
Pink/blue ridged 3D hero on one half, D&M AI narrative copy and Blaine Buenger pull-quote box on the other
A media and entertainment chart shows M&E experiencing the highest AI disruption levels and simultaneously the greatest perceived AI benefit across all surveyed sectors.
Full-width M&E dual-axis chart comparing disruption and benefit levels, with M&E as the highlighted outlier category
The M&E sector narrative explores AI's creative and operational impact, featuring a red cable-knot hero, an Untold Studios solution spotlight, and quotes from Veerendra Patil and Dongsoo Han.
Red cable-knot 3D hero on one half, Untold Studios case study box and two pull-quote boxes (Patil/Han) on the other
A stacked-bar chart shows that organizations 'approaching their AI goal' dropped sharply from 48% in 2024 to 31% in 2025, with early- and mid-stage adoption categories increasing, per Dr. Max Clark.
Full-width stacked horizontal bar chart comparing 2024 and 2025 AI journey stage distributions, with Dr. Max Clark pull-quote inset
This page provides narrative context for the AI journey stage regression, featuring a pink/lilac satin-fold hero and a quote from Jun Xue on recalibrating AI ambitions to realistic roadmaps.
Pink/lilac satin-fold 3D hero on one half, AI journey decline narrative copy and Jun Xue pull-quote box on the other
A five-panel chart shows investment intentions dipping 9–13% across most technology categories, with AI holding up best at only a 9% decline.
Five-panel side-by-side percentage-change metrics comparing technology investment intentions year-over-year, with AI highlighted as the most resilient
This page contextualizes AI's relative investment resilience amid broader pullbacks, with a red cube-field hero and quotes from Mohamad Kassir and Lars Albjerg of Novo Nordisk.
Red cube-field 3D hero on one half, investment resilience narrative and two pull-quote boxes (Kassir/Albjerg) on the other
This section divider introduces Insight 5: 'Cost, tech, and talent are top concerns,' displayed with the giant yellow '05' numeral on a black background.
Black full-bleed background with yellow 'INSIGHT 05' tag top-left, large insight title center, and giant stacked '05' numerals on the right
Cost control is the leading business challenge for 33% of surveyed leaders globally, with Wei Feng Lu of Morimatsu commenting on how cost pressures are reshaping capital allocation.
Orange fan-ribbon 3D hero on one half, 33% leading-challenge statistic callout and Wei Feng Lu pull-quote box on the other
A global bar chart ranks the top five business challenges: Cost (33%), Tech/AI (31%), Talent (26%), Sustainability (24%), and Innovation (22%).
Full-width horizontal bar chart ranking five global challenges with percentage labels and color-coded bars
This page elaborates on technology/AI and talent as the second and third leading global challenges, contextualizing how they interact with cost pressures across industries.
Green wave 3D hero on one half, tech/talent challenge narrative with supporting statistics on the other
An AMER split-pie chart shows US and Canada are primarily cost-concerned, while Brazil and Mexico are more focused on AI/tech as their leading business challenge.
Two-by-two country split-pie chart comparing cost vs AI concern proportions, with Vinicius Prata pull-quote inset
An APAC split-pie chart shows Australia, Singapore, and India as cost-oriented while South Korea, Japan, and China are more tech/AI-focused.
Multi-country APAC split-pie chart grid comparing cost vs tech proportions across six markets
This page narrates the APAC regional challenge landscape, featuring an orange fan hero and a quote from Sharmy Francis of InfraBuild on cost pressures in Australian infrastructure.
Orange fan 3D hero on one half, APAC narrative copy and Sharmy Francis pull-quote box on the other
An EMEA split-pie chart shows Turkey as the most cost-focused market (41% vs 21% tech), while Spain is the most tech-focused, revealing significant intra-regional variation.
Multi-country EMEA split-pie chart grid with Turkey and Spain highlighted as opposite poles
This page covers the EMEA regional challenge narrative, featuring a blue cube hero and a quote from Gregory Zatka of EuroAirport on managing infrastructure costs amid regulatory complexity.
Blue cube 3D hero on one half, EMEA challenge narrative copy and Gregory Zatka pull-quote box on the other
An AECO split-pie chart shows construction services as least concerned about AI and most concerned about cost among all AECO sub-sectors.
AECO sub-sector split-pie chart grid comparing cost vs AI concern proportions across construction, architecture, engineering, and other sub-sectors
The AECO challenge narrative features a gold paper-fold hero, a Robert Hicks of Skanska quote, and a solution spotlight on Norconsult's Sotra suspension bridge project achieving a 99.5% reduction in drawings.
Gold paper-fold 3D hero on one half, Norconsult case study box and Robert Hicks pull-quote box on the other
A chart reveals supply-chain diversification has dropped from 76% to 65% despite rising fragility signals, indicating organizations are struggling to diversify even as risk increases.
Full-width supply-chain trend chart with diversification declining line vs fragility rising line, featuring a purple cube-field hero
Digitally mature companies are 41% more likely to have diversified their supply chains, establishing digital capability as a key resilience driver, supported by a Wei Feng Lu quote.
Two-group bar chart comparing supply-chain diversification rates between digitally mature and less mature organizations, with Wei Feng Lu pull-quote inset
This section divider introduces Insight 6: 'Leaders are cautious in the near term,' displayed with the giant yellow '06' numeral on a black background.
Black full-bleed background with yellow 'INSIGHT 06' tag top-left, large insight title center, and giant stacked '06' numerals on the right
Leaders report a 10-point increase in uncertainty about the global landscape alongside a 12-point decrease in preparedness, signaling growing organizational anxiety amid external headwinds.
Orange pixel-slope 3D hero on one half, two contrasting change-callout tiles (+10 uncertainty / −12 preparedness) and narrative body copy on the other
A crossover chart shows uncertainty rising from 55% to 65% while preparedness falls from 73% to 61%, with the two lines crossing—a visual representation of the leadership confidence deficit—supported by an Ammar Al Assam quote.
Full-width dual-line crossover chart with uncertainty rising and preparedness falling from 2023 to 2025, with Ammar Al Assam pull-quote inset
Digitally mature organizations show 76% preparedness versus only 47% for less mature peers, reinforcing digital transformation as the primary resilience buffer, with a quote from Brad Sonter of Cox Architecture.
Green fold 3D hero on one half, two contrasting preparedness bars (76% vs 47%) and Brad Sonter pull-quote box on the other
An AMER range plot shows the US recording the biggest decline in preparedness while Canada records the biggest decrease in uncertainty, reflecting divergent responses to regional headwinds.
Full-width AMER country-level range plot with preparedness and uncertainty delta arrows for each country, labeled with change magnitudes
An APAC range plot reveals Japan as the least prepared country at 37%, while Singapore is the most uncertain at 81%, showing sharp intra-regional divergence.
Full-width APAC country-level range plot with preparedness and uncertainty range bars, Japan and Singapore flagged as outliers
This page provides the APAC regional context for preparedness and uncertainty, featuring a yellow glass-sphere hero and a quote from Andy Yu of Build King on managing uncertainty in Asian markets.
Yellow glass-sphere 3D hero on one half, APAC narrative copy and Andy Yu pull-quote box on the other
An EMEA range plot shows the Nordics experiencing the largest swing in both preparedness and uncertainty, indicating high volatility in Northern European business confidence.
Full-width EMEA country-level range plot with Nordics highlighted as the highest-swing market across both metrics
This page covers the EMEA preparedness narrative, featuring a blue spiral hero and a quote from Pierre-Yves Massille of Egis Group on strategic planning under European market uncertainty.
Blue spiral 3D hero on one half, EMEA preparedness narrative copy and Pierre-Yves Massille pull-quote box on the other
An AECO range plot shows architecture services experiencing a large shift in both preparedness and uncertainty, positioning it as the most volatile sub-sector within the built environment.
Full-width AECO sub-sector range plot with architecture services highlighted as the highest-swing sub-sector
This page narrates the AECO sector's cautious outlook, featuring a teal cube-grid hero and a quote from Oliver Hall of SAOTA on navigating design business uncertainty.
Teal cube-grid 3D hero on one half, AECO sector preparedness narrative and Oliver Hall pull-quote box on the other
This section divider introduces Insight 7: 'The search for talent intensifies, with a focus on AI skills,' displayed with the giant yellow '07' numeral on a black background.
Black full-bleed background with yellow 'INSIGHT 07' tag top-left, large insight title center, and giant stacked '07' numerals on the right
The share of leaders reporting difficulty finding skilled employees has surged from 45% to 61% globally, with Germany showing the most dramatic jump—from 28% to 61%—since 2024.
Blue pixel-cube 3D hero on one half, 45%→61% global trend callout and Germany-specific surge callout with body narrative on the other
A five-panel chart shows all skills-gap indicators trending up 14–16% year-over-year, while investment in continuous learning programs has declined 7%, creating a widening capability gap.
Five-panel metric chart with upward-trending skills-gap bars and a single downward continuous-learning bar highlighted in contrast
This page narrates the widening skills gap, featuring a purple fan hero and a quote from Christian Ahlers of Lindner Group on the urgency of reskilling in an AI-accelerated environment.
Purple fan 3D hero on one half, skills-gap narrative copy and Christian Ahlers pull-quote box on the other
A training-investment trend chart shows investment declining from 71% to 68% after a 2024 peak, with a Steelcase solution spotlight on workforce learning initiatives.
Training investment trend chart on one half, Steelcase solution spotlight box on the other, with body narrative copy
This page provides narrative context for declining training investment, with quotes from Michael Zeppieri of Skanska and Jeff Siegel of HNTB on the tension between cost pressures and workforce development needs.
Yellow cube 3D hero on one half, training decline narrative and two pull-quote boxes (Zeppieri/Siegel) on the other
A Sankey chart shows AI skills leading future hiring priorities with a +4.9% increase, while digital design skills slide and data safety skills drop from the hiring agenda.
Full-width Sankey-style hiring-priority flow chart with AI skills highlighted as the rising priority and digital design/data safety as declining, with Brad Sonter pull-quote inset
This page elaborates on the AI skills imperative, featuring a purple spiral hero and quotes from Veerendra Patil and Dr. Karen Blay of Loughborough University on integrating AI competencies into future workforce planning.
Purple spiral 3D hero on one half, AI skills narrative and two pull-quote boxes (Patil/Blay) on the other
An AECO range plot reveals civil infrastructure experiencing a dramatic technical skills shortage surge from 28% to 61%, a 118% increase, the sharpest rise in the built-environment sector.
Full-width AECO sub-sector range plot with civil infrastructure highlighted as the highest-surge sub-sector
This page narrates the AECO sector's skills crisis, featuring a blue spiral hero and a quote from Vinicius Prata on recruiting engineering talent for large-scale infrastructure programs in Brazil.
Blue spiral 3D hero on one half, AECO skills crisis narrative and Vinicius Prata pull-quote box on the other
A D&M range plot reveals industrial machinery experiencing the most dramatic skills shortage jump across the entire survey—rising from 25% to 65%, a 160% increase.
Full-width D&M sub-sector range plot with industrial machinery highlighted as the highest-surge sub-sector
The D&M skills narrative features a yellow cubes hero, a Hidenori Saito quote, and a solution spotlight on Revolution Workshop in Chicago as a workforce development model for advanced manufacturing.
Yellow cubes 3D hero on one half, Revolution Workshop case study box and Hidenori Saito pull-quote box on the other
An M&E range plot shows the games sector experiencing the biggest talent challenge surge, with skilled-employee difficulty rising from 36% to 62%.
Full-width M&E sub-sector range plot with the games sector highlighted as the highest-surge sub-sector
This page narrates the M&E sector's talent challenges, featuring a pink mountain hero and a quote from Veerendra Patil on the value of multiskilled artists who can bridge creative and technical AI roles.
Pink mountain 3D hero on one half, M&E skills narrative and Veerendra Patil pull-quote box on the other
This section divider introduces Insight 8: 'Investments remain strong but reflect uncertainty,' displayed with the giant yellow '08' numeral on a black background.
Black full-bleed background with yellow 'INSIGHT 08' tag top-left, large insight title center, and giant stacked '08' numerals on the right
Sixty-six percent of leaders plan to increase investments, down from 80% in 2024, reflecting cautious optimism in a more uncertain global environment, with a quote from Wei Feng Lu of Morimatsu.
Orange sunset-ridge 3D hero on one half, 66% statistic callout, year-over-year comparison, and Wei Feng Lu pull-quote box on the other
A stacked bar chart shows 66% of organizations plan to increase investments (vs 80% last year), with the 'stay the same' category growing significantly from 16% to 24%.
Full-width stacked horizontal bar chart comparing 2024 and 2025 investment intention distributions across increase/same/decrease categories
An AMER bar chart shows Canada and the US experiencing the largest investment decline, with the US dropping from 90% to 73% and Canada from 73% to 58%, per a quote from Blaine Buenger.
Full-width AMER country-level bar chart with US and Canada decline highlighted, Blaine Buenger pull-quote inset
An APAC chart shows China as the only country increasing future investment intentions (70% to 72%), while Japan and South Korea have both dropped to 49%, with a Yongsik Jeong quote.
Full-width APAC country-level bar chart with China as sole positive outlier and Japan/South Korea declines highlighted, Yongsik Jeong pull-quote inset
An AECO sector chart shows architecture services and oil & gas experiencing the sharpest declines in investment intentions, with a Sharmy Francis quote on infrastructure investment caution.
Full-width AECO sub-sector bar chart with architecture services and oil & gas highlighted as steepest-decline sub-sectors, Sharmy Francis pull-quote inset
A comparison bar chart shows organizations pulling back on expansion: entering-new-markets intentions fell from 75% to 67%, and plans for new services dropped from 77% to 69%.
Side-by-side comparison bar chart showing 2024 vs 2025 expansion intention percentages for entering-new-markets and new-services categories
This page contextualizes the expansion pullback, noting digitally mature organizations remain more aggressive at 77% entering new markets versus 57% for less mature peers, with a Wei Feng Lu quote.
Pink mesh-cube 3D hero on one half, expansion narrative with maturity-segmented comparison bars and Wei Feng Lu pull-quote box on the other
The conclusion calls on leaders to focus on the long-term benefits of digital transformation as the proven path through near-term headwinds of cost pressure, AI uncertainty, and talent scarcity.
Full-bleed pink/red pillar-landscape 3D hero with black overlay text box containing conclusion narrative and forward-looking call to action
The methodology page details the research design: n=5,560 quantitative survey respondents collected May–August 2024 via a 20-minute Qualtrics survey, plus 34 qualitative executive interviews conducted October–November 2024.
Blue crystal 3D hero on one half, methodology details including sample size, dates, instrument, interview count, and respondent demographics on the other
Six donut charts show the full respondent breakdown: AECO (1,965), D&M (1,925), and M&E (1,670) industries, and APAC (2,152), EMEA (2,471), and AMER (937) regions, with sub-industry and country splits within each donut.
Six-donut chart grid (three industry + three region) with sub-category slices labeled within each donut
The glossary defines seven key terms used throughout the report: AI Leaders, Data Effective, Digital Maturity, Industry Categories, Leaders/Experts, Regions, and Sustainability.
Clean two-column definition layout with bold term headings and body definition text, minimal white background
This page features portrait photographs and name/title attributions for the first 12 of 31 qualitative interview participants, including Andy Yu, Brad Sonter, Ammar Al Assam, Mohamad Kassir, Pierre-Yves Massille, Vinicius Prata, Gregory Zatka, Blaine Buenger, Jeff Siegel, Sharmy Francis, Christian Ahlers, and Anna Noneder.
Three-by-four portrait grid with participant photos, names, titles, and organizations, set against a yellow dimpled-sphere hero accent
This page features portrait photographs and name/title attributions for the remaining 19 interview participants, including Dr. Karen Blay, Brian Alting, Wei Feng Lu, Lars Albjerg, Marcelo Piller, Dr. Max Clark, Eng. Tarek ElGamal, Yongsik Jeong, Nitesh Alagh, Robert Hicks, Michael Zeppieri, Linn Areno, Amarnath Patnam, Oliver Hall, Hidenori Saito, Fumihiro Ojima, Jun Xue, Veerendra Patil, and Dongsoo Han.
Multi-row portrait grid with participant photos, names, titles, and organizations for the remaining 19 interviewees
The final page presents Autodesk's corporate description, legal disclaimers regarding forward-looking statements, and a contact address (state.of.design.and.make@autodesk.com) for the research series.
Clean black-and-white editorial layout with Autodesk corporate description text, legal boilerplate, and contact email, plus Autodesk logo
Common questions about this slide and the underlying presentation content.
Yes. The layout system—section-divider spreads, insight narrative pages, regional data pages, and pull-quote formatting—is designed as a modular editorial framework that can be adapted for any industry research report by swapping content, hero imagery, and color accents to match your brand.
The report contains 96 pages formatted as landscape-orientation slides (2338×1400 px WebP), covering a cover, contents, about, introduction, eight insight sections with supporting data and narrative pages, a conclusion, methodology, respondent breakdown, glossary, acknowledgements, and an about/legal closing page.
The report uses a premium black-and-electric-yellow brand palette paired with cinematic full-bleed 3D-rendered hero images (abstract paper folds, fabric spirals, mesh sculptures, pixel-cube fields), bold sans-serif display typography, and clean minimal data visualizations—creating an authoritative, consulting-firm-grade editorial aesthetic.
The report features a diverse visualization palette including bubble charts, Sankey-style flow diagrams, multi-line trend charts, range plots, split-pie (donut) charts, stacked horizontal bar charts, area charts, side-by-side grouped bar charts, and crossover dual-line charts—all styled with teal/green primary accents and categorical color coding.
The report is published annually by Autodesk, Inc. as part of their 'State of Design & Make' longitudinal research series; the 2025 edition is the third consecutive year of the study, enabling year-over-year trend comparisons from 2023 to 2025.
The report covers three industry groups—Architecture, Engineering, Construction & Operations (AECO); Design & Manufacturing (D&M); and Media & Entertainment (M&E)—across three global regions: Asia-Pacific (APAC), Europe, the Middle East & Africa (EMEA), and the Americas (AMER), with country-level breakdowns within each region.
The typographic system and layout are language-agnostic: the large-display headings, pull-quote boxes, and data visualization structure accommodate translated text without redesign, making the format well-suited for localized versions in European, Asian, and Middle Eastern markets.
The report addresses eight strategic themes: the ROI of digital transformation, sustainability as a profit driver, AI as the leading sustainability enabler, the AI hype-cycle reality check, cost/tech/talent as top business concerns, near-term executive caution and uncertainty, the intensifying AI-skills talent war, and investment trends reflecting global uncertainty.

Create Your Own Slides
Turn your ideas into professional presentations in seconds with 2slides AI.
Reference professional designs, choose your style, and generate slides with perfect text rendering. Powered by Nano Banana—start creating your presentation now.
Your AI Agent for slides. Save time, shine faster with intelligent presentation creation.


© 2026 2slides. All rights reserved.