
所屬合集: 投資人簡報案例 · 澳洲上市公司法說會簡報範例
Xero H1 FY2027 Results Presentation is the English-language "H1 FY27 Investor briefing" lodged with the ASX on 12 November 2026, covering the six months ended 30 September 2026. Presented by CEO Sukhinder Singh Cassidy and CFO Claire Bramley, it reports Xero's first half including a full six months of Melio, upgrades the FY27 outlook, announces an up to A$1bn on-market buy-back, and devotes a section to AI strategy. All currency amounts are in NZ dollars unless otherwise stated, as the notice on slide 2 says.
以這份簡報的封面作為風格參考,用您自己的內容產生幻燈片。 也可以在下方任選一頁,以它的版面作為參考。
快速導航
標籤
分享幻燈片
Xero H1 FY2027 Results Presentation is the English-language "H1 FY27 Investor briefing" lodged with the ASX on 12 November 2026, covering the six months ended 30 September 2026. Presented by CEO Sukhinder Singh Cassidy and CFO Claire Bramley, it reports Xero's first half including a full six months of Melio, upgrades the FY27 outlook, announces an up to A$1bn on-market buy-back, and devotes a section to AI strategy. All currency amounts are in NZ dollars unless otherwise stated, as the notice on slide 2 says.
每張幻燈片頁面的詳細視圖,包括版面、關鍵內容和視覺元素。
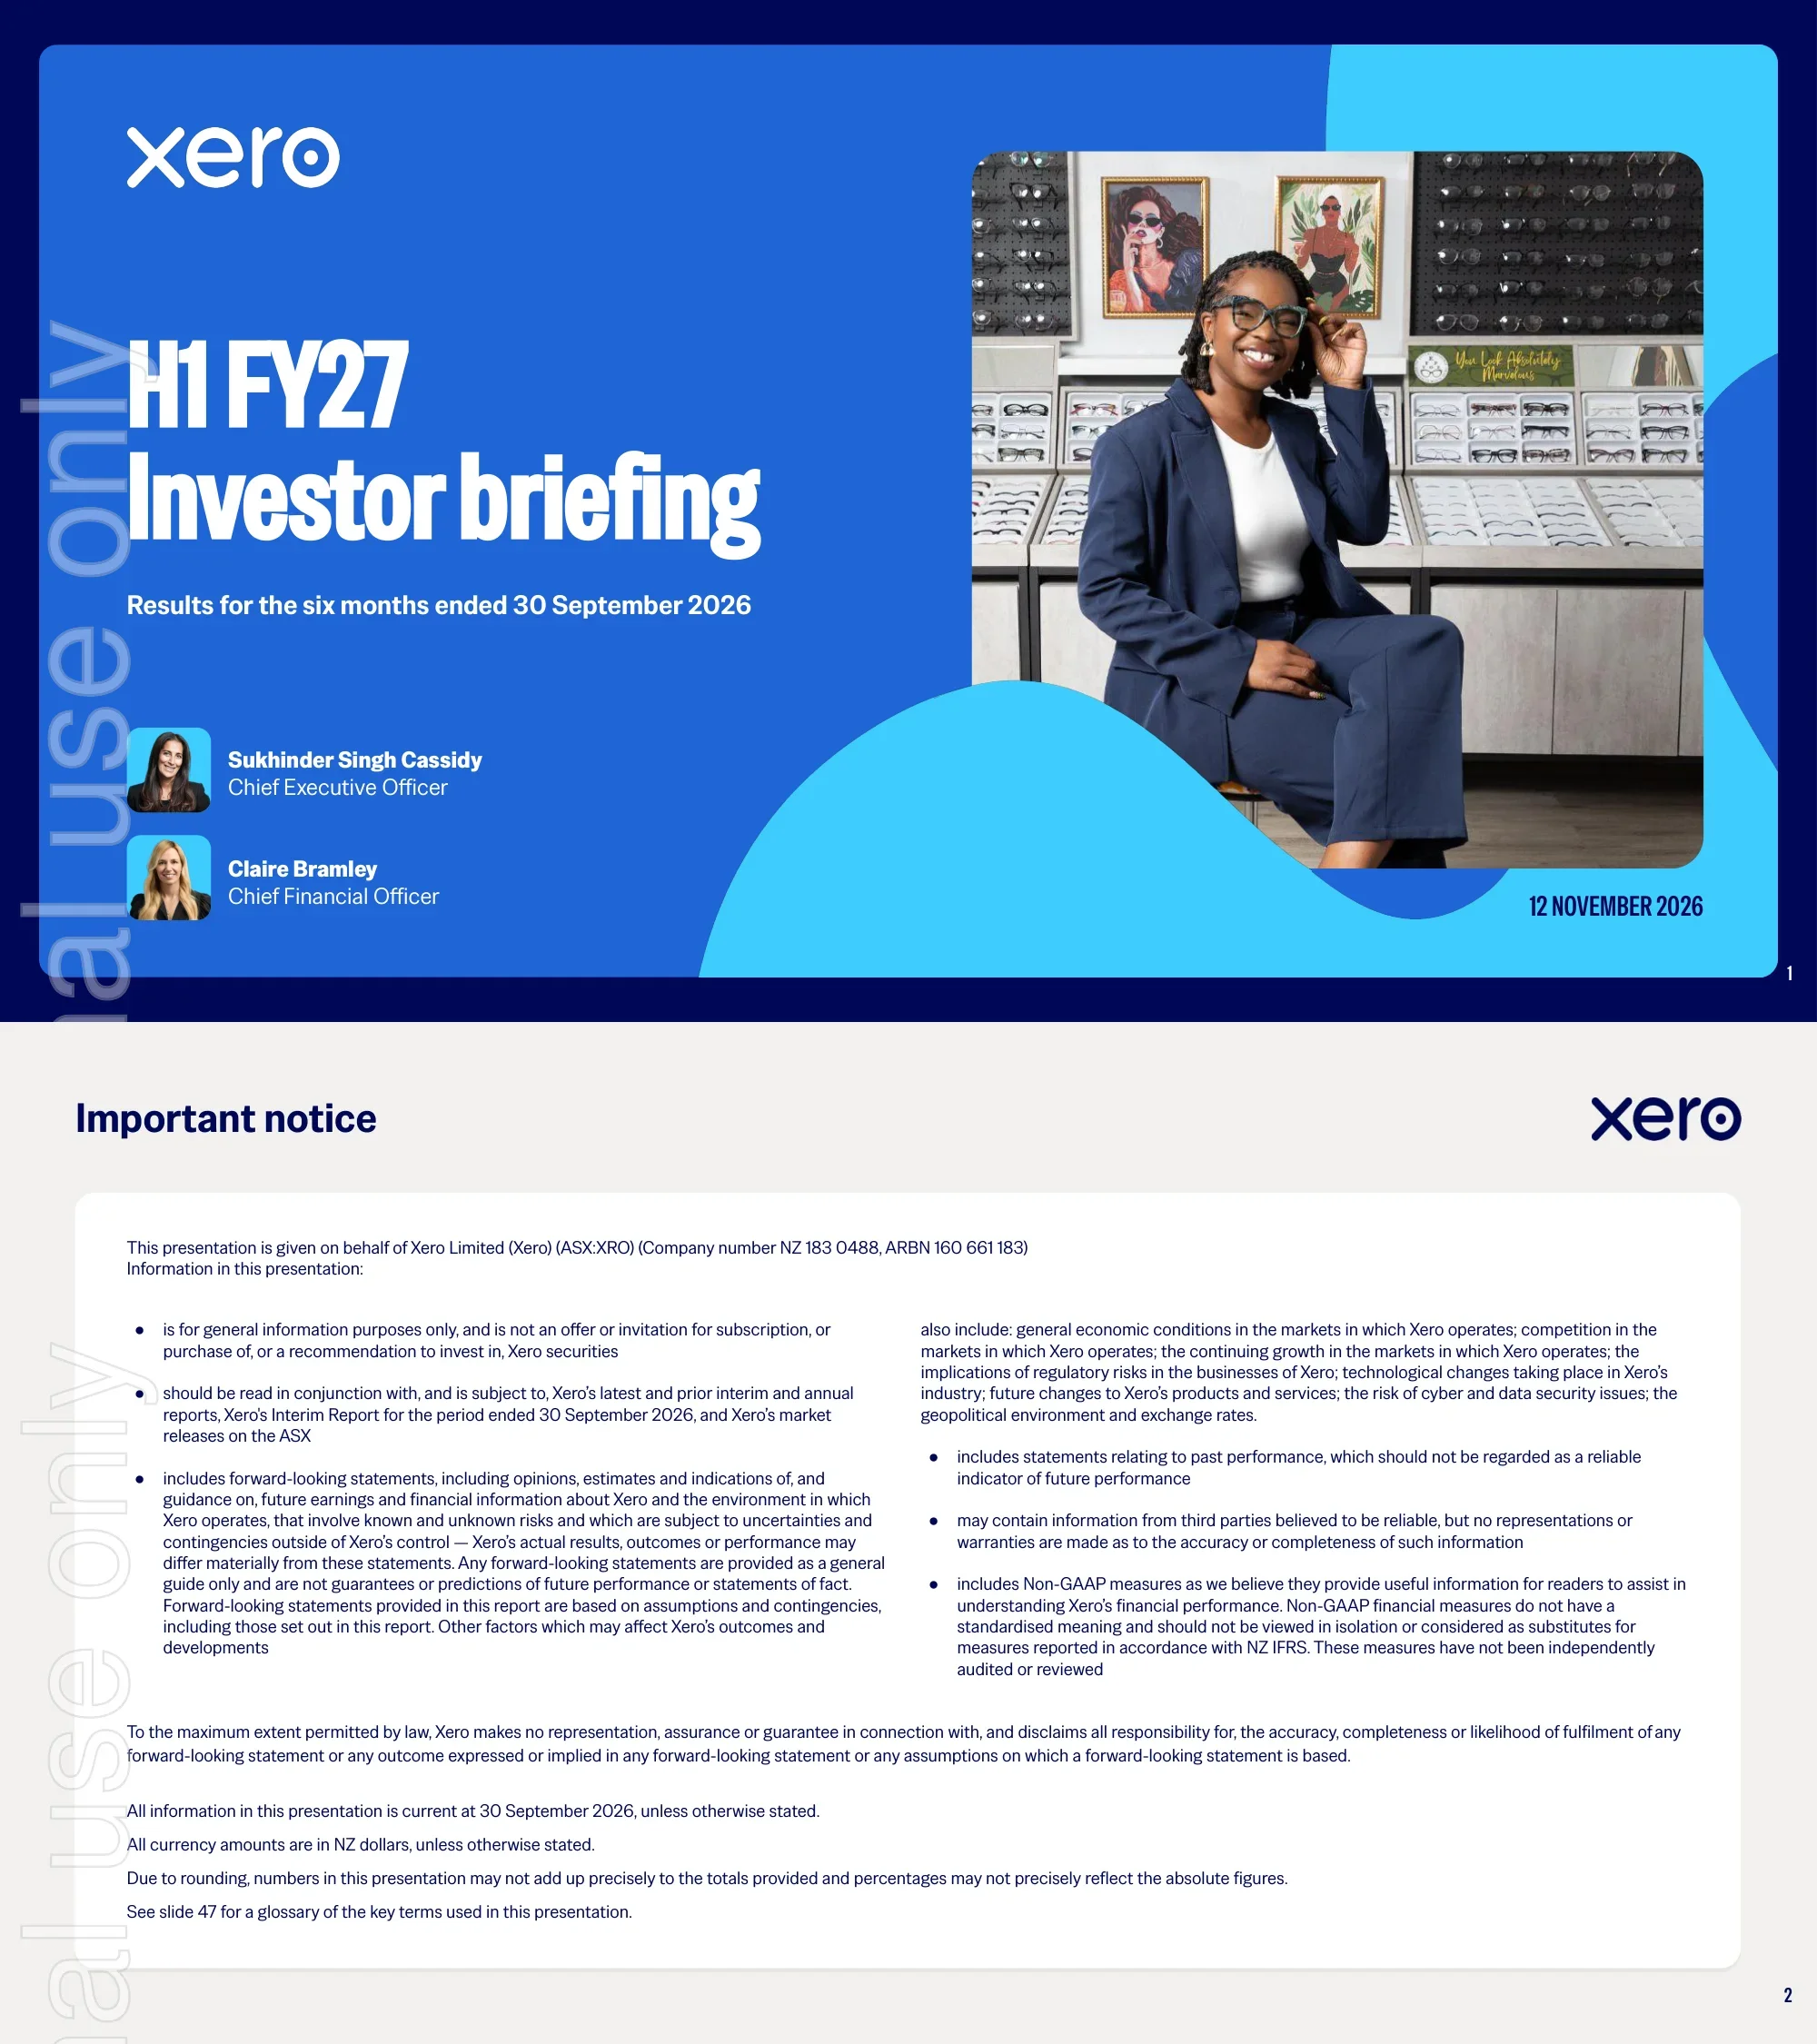
Cover slide for Xero's H1 FY27 Investor briefing, covering results for the six months ended 30 September 2026. It names the presenters, Chief Executive Officer Sukhinder Singh Cassidy and Chief Financial Officer Claire Bramley, and is dated 12 November 2026.
Bright blue cover with the Xero logo top left, a large white title and subtitle at left, and a rounded photo of a smiling optician-shop owner at right framed by light-blue organic shapes. Two small headshots with names and titles sit bottom left.
Legal notice given on behalf of Xero Limited (ASX:XRO). It says the information is general only and not an offer, includes forward-looking statements and past performance, and includes non-GAAP measures not independently audited or reviewed. It states that information is current at 30 September 2026, that all currency amounts are in NZ dollars unless otherwise stated, and that numbers may not add due to rounding. A glossary is referenced on slide 47.
White rounded panel on a light grey background with two text columns of bullet points, followed by full-width paragraphs of disclaimers at the bottom.
Three themes summarise the half: strong revenue and adjusted EBITDA growth (FY27 Outlook upgraded), translating to strong free cash flow (pro-forma Rule of 40 in FY27, one year early, and an up to A$1bn on-market buy-back), and scaling 3x3 plus AI adoption as a trusted partner for more than 5.1m SMBs and the accounting and bookkeeper community. Footnotes point to slides 20, 21 and 23.
Dark navy slide with three equal rounded cards, each with an illustration, a heading, a supporting line and light-blue pill callouts at the bottom.
Headline KPIs: operating revenue $1,745m (+27% pro-forma, +46% reported, +22% constant currency), adjusted EBITDA $362m (+23% pro-forma, +3% reported), and free cash flow growth of +32% pro-forma with a 36.1% Rule of 40 (22.5% constant-currency revenue growth plus 13.6% FCF margin; reported Rule of 40 is 54.9%). A footnote says reported FCF was $238.1m, down 26% on $321.1m, largely due to Melio. Pro-forma means Xero and Melio combined for the full period in H1 FY25 and H1 FY26.
Three KPI cards with navy headers and large cyan percentages above mint highlight boxes containing the key dollar figure, plus a full-width pro-forma definition bar and four numbered footnotes.
Revenue grew 46% reported and 27% pro-forma: reported $996m (H1 FY25), $1,194m (H1 FY26) and $1,745m (H1 FY27); pro-forma $1,108m, $1,378m and $1,745m. Adjusted EBITDA was $313m, $351m and $362m reported (+3% YOY in H1 FY27) and $252m, $295m and $362m pro-forma (+23%).
Two side-by-side bar charts, each split by a dashed purple line into Reported and Pro-forma groups, with value bubbles above bars and labelled pills underneath.
Reported free cash flow was $209m (21.0% margin) in H1 FY25, $321m (26.9%) in H1 FY26 and $238m (13.6%) in H1 FY27; pro-forma FCF rose from $80m to $181m to $238m (+32% YOY). The Rule of 40 stacked chart shows pro-forma 31.8%, 34.9% and 36.1%, and reported 43.9%, 44.5% and 54.9%. A callout says FY27 Rule of 40 is expected to be around 40%.
Left panel is a bar chart of FCF in dollars and margin; right panel is a stacked bar chart splitting Rule of 40 into constant-currency revenue growth and FCF margin, with a light-blue guidance callout.
Regional scorecards: Australia revenue +23% with +91k net customer additions; UK +24% with +85k, driven by Making Tax Digital (MTD) for IT; US +51% pro-forma with +31k customers (about 5,000 are a reclassification) and Bill Pay live alongside Xero Payroll powered by Gusto. Lower tiles cover the go-to-market playbook (Xerocon London and Denver with about 3k attendees, Xero Coaches), focused AI bets (XeroForce in beta, Claude, ChatGPT and Gemini connectors, a Claude plugin) and a 550+ leader summit.
A navy band holds three country cards with flags and large cyan-highlighted figures, below which sit three mint cards with bullet lists. Four footnotes explain the metrics.
A before and after grid compares product availability before the FY25-27 strategy with today (H1 FY27) across Australia, UK and US. Products are grouped as Accounting (bookkeeping, tax, analytics and insights), Payments (invoice payments, Bill Pay) and Payroll (payroll, workforce management). Cells are marked Live, Early stage or Not offered, with AI-enhancement icons on many of the live cells today. The message is that Xero is positioned as the OS for SMBs.
Matrix with product rows on the left, a grey Before panel in the middle and a mint-outlined Today panel on the right, linked by a chevron; legend at the bottom.
US pro-forma revenue grew from $158m to $241m to $365m (+51% YOY in H1 FY27), with ARPC growth of 38%, 48% and 28%. Melio payments revenue rose from $75m (H1 FY24) to $283m (H1 FY27), a 56% CAGR, with Xero embedded BillPay annualised TPV of about US$1bn, take rate +21bps and TPV +25% YoY. US brand spend is expanding across YouTube, streaming audio and podcasts, with unaided awareness up 4ppts.
Three cards: a combined bar and line chart for US revenue and ARPC growth, a bar chart with check-mark bullets for Melio, and a brand card with a photo and channel icons.
Customers using GenAI features reached about 1m on a rolling 12-month basis by September 2026, with monthly active orgs up about 9x YoY. Top features: Auto Bank Rec with about 90% return customers, JAX chat with about 6x monthly customers over 12 months, and Smart Doc Capture with about 4.5x monthly customers in its first six months or so since launch.
Left white panel with a line plus bar chart (Sep-25 to Sep-26); right light-blue panel with three navy stat tiles, each beside a small product screenshot.
Section divider introducing the financial results section, presented by Chief Financial Officer Claire Bramley.
Dark navy slide with the Xero logo, a large white title at left, a presenter headshot with name and title, and light-blue organic shapes on the right.
Revenue rose 46% (27% pro-forma) to $1,745m, with AMRR of $3.8b, up 29% pro-forma. Customers grew 12% (11% pro-forma) to 5.15m. ARPC rose 25% (+20% constant currency) to $62.21, with Melio Payments contributing $5.81 and 46% of the uplift. Four-year bars run from H1 FY24 to H1 FY27.
Three navy summary headers over three bar charts (revenue, customers, ARPC) with value bubbles and YoY labels; the ARPC bar is stacked to show the Melio contribution in purple.
A three-step narrative on a pro-forma basis. Payments and other revenue grew to 22% of revenue in H1 FY27 (from 15% in H1 FY25) of $1,745m. Total payment value rose from $26b to $31b to $38b (+23% YOY), made up of Xero BillPay $21b and Xero Invoicing $17b in H1 FY27. ARPC including Melio rose to $62.2 (+16% YOY).
Three cards connected by arrows: a stacked revenue-mix chart, a stacked TPV chart and a single-series ARPC bar chart.
Pro-forma gross profit rose 22% to $1,327m ($910m, $1,089m, $1,327m over three halves) while pro-forma gross margin fell from 82.1% to 79.1% to 76.0%, largely a mix effect as Melio payments revenue rose from 10% to 13% to 16% of Group revenue. A waterfall bridges gross margin from 88.5% in H1 FY26 to 76.0%: Subscription (0.4%), including a one-time cloud infrastructure investment, Melio and payments (11.5%), and Other (0.6%).
Left panel combines gross profit bars with a margin line and a Melio share row beneath; right panel is a waterfall chart with a callout about one-time cloud costs.
An ARPC bridge from $55.44 at 31 March 2026 to $62.21 at 30 September 2026, an increase of $6.77 (up 12%). Drivers: direct payments (Melio momentum contributing $1.57 to the Group), price changes (AU and UK effective July and September, NZ and US to come through in H2), product mix (mildly positive; strong in the US, offset by UK MTD headwinds), platform attach and other (25% invoice TPV growth) and FX movements (weaker NZD, AUD in particular).
Horizontal bridge: start and end bars in navy with values at the right, five driver rows between them each with a navy label, bullet explanation and a coloured contribution arrow keyed to a legend.
Xero subscription MRR churn is shown from H1 FY20 to H1 FY27: headline churn reached 1.19% and underlying cohorted churn 0.83%, with a COVID-19 dip highlighted. International headline churn is 1.57% versus 1.14% underlying; ANZ is 0.89% headline versus 0.72% underlying. The slide attributes higher international churn to a heavier direct-channel weighting and ANZ's strong partner channel. Churn excludes Melio.
Left panel is a line chart with solid headline and dashed underlying series; right panel has two paired bar charts for International and ANZ with explanatory grey boxes below.
Operating expenses as a share of operating revenue, excluding M&A costs, fell from 78.8% in H1 FY24 to 71.1%, 72.8% and 68.6% in H1 FY27 (down about 10ppts). Revenue per FTE rose from $337k to $444k, $513k and $696k (+36% YOY, +27% pro-forma; up over 100% since H1 FY24), with pro-forma FTE flat versus H1 FY24.
Two bar charts with large directional arrows drawn over them (green down arrow for opex ratio, blue up arrow for revenue per FTE) and navy takeaway headers.
Sales and marketing is $529m (+40% YOY, 30.3% of revenue, efficiency improved 1.4pp; $59m from Melio). Product design and development is $459m (+36%, 26.3%, improved 1.9pp; $68m from Melio; 43.9% capitalisation rate, down 3.5pp). G&A is $209m (+36%, 12.0%, improved 0.9pp; $48m from Melio). Commentary cites performance marketing, product velocity and AI tool efficiencies, and Melio's structurally higher G&A.
Three columns, each with a navy headline, a dashed line of expense as a percent of revenue above bar charts with Melio contribution in a lighter segment, and bullet commentary below.
Pro-forma adjusted EBITDA by half: $252m (H1 FY25), $259m, $295m, $402m (H2 FY26, 55% YOY), $362m (H1 FY27, 23% YOY) and a guided H2 FY27 range of $518m to $558m (+29% to +39% YOY). FY27 adjusted EBITDA guidance is $880m to $920m, reflecting significant operating leverage.
Single six-bar chart divided by dashed lines into three fiscal years, with the final H2 FY27 bar shown as a gradient range and a light-blue guidance callout above.
FY27 operating revenue is now expected between $3,770m and $3,830m (previously $3,620m to $3,730m), mainly on stronger Melio payments and a weaker NZD; constant-currency pro-forma growth is expected at 24% to 27%. FY27 adjusted EBITDA is expected between $880m and $920m (prior $860m to $920m), with D&A around $475m. Xero expects a pro-forma Rule of 40 outcome of around 40% for FY27, earlier than its previous aspiration.
Three stacked navy bands, each with a green check-mark badge, a bold guidance headline with cyan figures and supporting text, and a closing line referring to slide 43.
Xero sees the opportunity for FY28 revenue to be more than $4.6bn excluding revenue synergies (previously more than $4.2bn) and still aspires to a greater-than-Rule-of-40 outcome in FY28. Melio is expected to reach adjusted EBITDA breakeven on a run-rate basis in H2 FY28, defined as at least one month of positive adjusted EBITDA contribution. Footnotes cite about US$70m anticipated FY28 revenue synergies and the currency conversion assumptions.
A navy panel with two cyan-highlighted statements above a mint panel with an icon of a magnifying glass over a chart, followed by five numbered footnotes.
Net cash position table in $000s: total cash and short-term deposits $1,149,559 at Sep-26 versus $1,934,143 at Mar-26, convertible notes $1,639,054 and a revolving credit facility of $354,390, giving net debt of $843,885 (from $383,361). The waterfall shows $238m of FCF generation offset by a $664m SBC dilution offset programme, with TTM net debt to pro-forma adjusted EBITDA rising from 0.5x to 1.1x. The remaining US$200m of the RCF was repaid after 30 September, leaving it fully undrawn.
Left panel is a table with highlighted subtotal rows and lettered notes; right panel is a waterfall chart with ratio chips beneath.
The Board announced an up to A$1bn on-market buy-back over a 12-month programme, funded by excess cash and expected free cash flow, with balance sheet strength maintained and a healthy net debt to adjusted EBITDA ratio. The programme includes an amount to offset dilution from FY28 share-based compensation. A flow diagram shows available capital going to product development, GTM/CAC and then free cash flow, split between offsetting share based compensation and returning capital to shareholders.
Left panel of bold-highlighted bullets; right panel is a mint and navy flow diagram looping from available capital through investment priorities to the dashed buy-back box.
Section divider introducing the AI themes and wrap-up section, presented by CEO Sukhinder Singh Cassidy.
Blue cover-style slide with the Xero logo, a large white title, presenter headshot and a rounded photo of two men in dark clothing, framed by light-blue shapes.
Global SaaS TAM is shown growing about 4x from roughly $750b today to roughly $3.3t by 2035 (SaaS plus AI), with estimates sourced to a 2025 Gartner report and expressed in US$ per the footnote. Customer value is framed as get help, get time back, manage their business smarter and unlock new business growth. Competitive advantages are grouped by layer: GTM, Vertical Platform, Infrastructure and Data (20 years of data).
Three cards: a two-bar TAM chart with a 4x arrow, four rounded pill value propositions with icons, and a layered list of competitive advantages with check marks.
A Xero survey of non-customer small businesses in AU, UK and US (June to August 2026, n=2,619) shows medium or high AI adoption rising with business size, from micro (0-1 employees) to medium and large (20+). In a brand association survey, 40% of respondents say Xero uses AI to automate tasks and save time, ahead of Peer 1 at 34% and Peers 2 to 5 at 29% to 26%. The slide calls Xero number one for time saving in accounting SaaS (AU, UK).
Left panel has three horizontal stacked bars by business size; right panel is a ranked horizontal bar chart with Xero highlighted in blue against grey peers.
Four customer testimonials under the themes saving countless hours (MATAX, US), supercharging skills with technology (Martine, Australia), unlocking capacity (The Vault Bookkeeping, Australia) and accuracy you can trust (Dial A Rod Engineering Services, UK). Most quotes concern the auto bank rec feature, with highlighted phrases such as sometimes even more than half the time.
Three quote cards across the top and one wide quote card below, each with a navy label, centred quote text with coloured highlights, a flag and decorative stickers.
Three power-user signals: about 5.5x higher AI adoption among Ultimate-tier customers than Ignite/Early tier customers; customers using Xero via AI assistants (Claude, ChatGPT, Microsoft 365 Copilot) up 3.6x from May to September 2026, with about 40% month-on-month growth; and more than 100 XeroForce workflows serving thousands of SMBs, up 9x from April to September 2026. XeroForce is in early beta testing.
Three equal cards each with a navy heading, a small statistic, and a mini bar chart with a multiple callout in a pill.
Architecture of the Xero AI platform: JAX packaged solutions (interface layer with Xero Blue, XPH and LLMs; intelligence layer invoking agents such as ABR and Books Health) and Xforce as an end-to-end solution (XeroForce, AI teammate, custom teammate and a template library of pre-built workflows). Below sit a services layer (Xero MCP, Xero APIs, third-party MCPs), Xero OS (bank feeds, tax integrations, payment rails) and apps outside Xero, all supported by a Forward Deployed Engineers service model.
Centred layered architecture diagram with numbered badges, two top columns, full-width service layer and infrastructure row, and three numbered captions underneath.
Introducing Xforce by Xero (beta), AI solutions designed with accounting partners including Azets and Sumer (United Kingdom), Liston Newton Advisory (Australia), and Nexia (Christchurch) and Shepherd Hensman (New Zealand). The packaged offering spans Platform, Skills, Services, Xero OS, 3P Apps and FDEs, and is built with Xero Forward Deployed Engineers and partner consultants.
Mint banner across the top above three cards: a partner logo list with locations, a stacked list of offering pills with descriptions, and a product screenshot with a hand emoji.
The Xero AI platform diagram is repeated with three numbered monetisation routes: bundles (in-product features and add-ons), consumption (credits, API usage, workflows) and solutions (Xforce including FDEs and AI teammates). The slide title notes positive early signals but no figures are shown.
Centred platform diagram with numbered mint badges pointing at JAX, the services layer and Xforce, and a white strip of three monetisation options below.
Five closing takeaways: strong revenue growth across all regions; consistent execution drives durable EBITDA growth; FCF generation provides capital flexibility; trusted partner for accounting businesses and small businesses in the AI journey; and strong momentum entering the next strategic period.
Dark navy slide with five numbered columns, each with an illustrated icon tile at the top, a large cyan numeral and a short highlighted statement.
Section divider opening the appendix, which contains regional customer data, segment results, unit economics, reconciliations, guidance assumptions, exchange rates and definitions.
Blue cover-style slide with the Xero logo, a large white title and a rounded photo of a woman arranging flowers, framed by light-blue shapes.
A five-layer view of Xero's position: a GTM layer (SMBs and accounting businesses, with general AI assistants as a new distribution channel alongside about 5m+ Xero customers), a vertical platform layer (accounting, payroll, payments, ecosystem), LLMs (Anthropic, OpenAI and Google as an input), a data layer (20 years of enriched, verified data) and an infrastructure layer (bank feeds, tax APIs, payment rails, a deterministic engine to detect, record, reconcile and comply). Competitive advantages are listed at right.
Horizontal layered stack with layer names on the left, coloured bars in the centre and a right column of check-marked advantages.
Four columns pair a competitor concern with Xero's counter: native AI start-ups, LLM providers, seat-based models and vibe-coding solutions. Arguments include Xero's global scale and deeper data context, that LLMs are probabilistic and not a system of record, that Xero is not seat-based and AI pricing mixes subscription and consumption, and that SMBs are time-poor and Xero maintains deep infrastructure. The TAM figure of about US$750b expanding to US$3.3tn with AI is cited to Gartner.
A four-column comparison matrix with a pink row for the area of concern and a mint row for Xero's counters, using navy column headers.
Closing customer balance from H2 FY24 to H1 FY27: 4.16m, 4.19m, 4.41m, 4.59m, 4.92m and 5.15m (+12% YOY in H1 FY27). H1 FY27 by region: Australia 2,192K, New Zealand 656K, United Kingdom 1,404K, US 455K and Rest of World 439K. A callout notes the removal of 160k long idle subscriptions in H1 FY25, with underlying growth of 10%.
Stacked column chart with five colour-coded regional segments per half-year, total bubbles with YoY growth above each column and a legend at left.
ANZ segment: $795m revenue (+20% YOY, +15% constant currency), 2.85m customers (+7%, 97k net additions) and ARPC of $54.57 (+18%, +10% constant currency). Australia: revenue $670m (+23%, +17% CC) and 2.19m customers (+9%, +91k), with the Ultra subscription live for more complex SMBs and under 1k customers. New Zealand: revenue $125m (+6%) and 656k customers (+3%, +6k net adds), reflecting deep market penetration.
A navy segment summary panel at left and two country cards at right, each with bullet commentary and green revenue and blue customer metric boxes.
International segment: $950m revenue (+79% reported, +33% pro-forma), 2.30m customers and ARPC of $71.67 including Melio (or $58.73 excluding). UK revenue $419m (+24%, +20% CC) with 1.40m customers (+16%, +85k). US revenue $365m (+51% pro-forma) and 455k customers (+18% pro-forma), with Melio revenue up 57% pro-forma. Rest of World revenue $165m (+23%) and 439k customers (+11%).
Navy segment summary panel at left and three region cards at right (UK, US, Rest of World) with bullet text and mint revenue and blue customer boxes.
Table of US revenue composition in NZ$: H1 FY27 reported total revenue $365m (subscription, invoicing and other $82m; Xero BillPay $180m; syndication $103m; payments revenue $283m), US gross margin 33% and gross profit $119m. Total Xero BillPay TPV was $20.6b with a gross take rate of 0.87%. Direct US customers were 455k with ARPC of $106 per month. Prior-period columns (FY24 to FY26) are pro-forma and unaudited.
Wide data table with lettered row markers, a highlighted H1 FY27 reported column, navy total rows and callout notes at top right and bottom right.
Total LTV is up 8% to $22.7b, with LTV per customer of $4,456, CAC per gross add of $740, CAC months of 13.1 and LTV/CAC of 6.0 (International steady). A waterfall bridges LTV from $20.96b at Mar-26 through new subs +$0.90b, ARPC +$1.75b, churn ($1.06b), gross margin ($0.48b) and FX +$0.61b to $22.67b at Sep-26. Melio is excluded from SaaS metrics.
Four navy KPI tiles across the top and a waterfall chart below with green increases, light-blue decreases and navy totals.
Heat-map table of SaaS metrics for ANZ, International and Group across H2 FY25 to H1 FY27. For Group in H1 FY27: ARPC $56.40 (excluding Melio's $5.81), CAC months 13.1, churn 1.19%, net additions 226,000, LTV per customer $4,456, LTV/CAC 6.0 and total LTV $22.67b. ANZ H1 FY27 shows ARPC $54.57, churn 0.89% and LTV/CAC 11.9; International shows ARPC $58.73, churn 1.57% and LTV/CAC 3.5.
Matrix of metric rows against four periods for each of three segment groups, using progressively darker green, blue and navy shading toward the latest period.
A line-by-line reconciliation in $000s. H1 FY27 reported net profit after tax is $18,529, with adjustments for FX financing revaluations, revaluation of contingent consideration, M&A and other transaction costs, convertible note revaluations and Melio fair-value acquired amortisation, giving adjusted NPATA of $81,149 and adjusted EPSA of $0.48 (H1 FY26: $123,290 and $0.77). Notes explain the effective tax rate effects of US tax recognition and why Xero views adjusted NPBTA as a better reflection of underlying performance. Small print is only partly legible at this resolution.
Two large reconciliation tables (H1 FY26 and H1 FY27) with rotated column headers and highlighted adjusted columns, and two light-blue note boxes underneath.
Revenue guidance $3,770m to $3,830m is supported by a balance of ARPC and customer growth (including some initial AI monetisation), strong US payments momentum (62% pro-forma growth in H1 FY27) and an FX benefit. Adjusted EBITDA guidance $880m to $920m assumes announced price rises, payments growth, cost discipline and lower Melio losses. The capitalisation rate is expected within the 40% to 45% long-term range and D&A around $475m. Currency assumptions: NZD/AUD 0.820, NZD/GBP 0.435, NZD/USD 0.585 and NZD/CAD 0.810.
Two columns, each with a navy guidance header and bullet assumptions; a currency assumption table sits at bottom left.
Pro-forma adjusted P&L ($NZm): revenue $1,378m to $1,745m, gross profit $1,089m to $1,327m (76.0% margin), operating income $93m to $130m and adjusted EBITDA $295m to $362m (20.7% margin) for H1 FY26 to H1 FY27. The pro-forma FCF bridge starts from reported FCF of $321,098k (H1 FY26) and $238,088k (H1 FY27), applying adjustments to reach pro-forma FCF of $180,535k and $238,088k, a margin of 13.6% in H1 FY27 and a pro-forma Rule of 40 of 36.1%.
Two tables with navy headers: a pro-forma P&L at left and a free cash flow bridge with lettered note markers at right, plus a light-blue notes panel.
Four-period income statement summary in $000s, H1 FY24 to H1 FY27. H1 FY27 operating revenue $1,745,305, gross profit $1,326,707 (76.0% margin), operating expenses excluding M&A costs $1,196,941 (68.6% of revenue), operating income $124,499, EBITDA $347,548, adjusted EBITDA $361,553 (20.7% margin) and net profit $18,529.
A single wide table with alternating shaded rows, bold subtotals, italic percentage rows and the latest column highlighted in light blue.
Exchange rate table for NZD against AUD, CAD, EUR, GBP, SGD and USD, showing 2026 average rates for the six months to 30 September, closing rates at 31 March and 30 September, and 2025 average and closing comparatives. For example NZD/AUD averaged 0.823 (2026) versus 0.916 (2025) and NZD/USD 0.583 versus 0.593.
Grid table with a navy 2026 header and a mint 2025 header, alternating shaded rows for each currency pair.
Three-column glossary defining terms used in the deck: adjusted EBITDA, AMRR, ARPC, CAC months, CAGR, churn, constant currency, 3x3 strategy, customers, EPSA, free cash flow, GAAP, GTM, JAX, JTBD, LLMs, lifetime value, operating income, pro-forma, Rule of 40, SMBs, syndication, TAM and underlying cohorted churn. The 3x3 strategy is the completion of three jobs (Accounting, Payments and Payroll) across three markets (Australia, UK and US). The text is very small and only partly legible.
White rounded panel containing three dense columns of bold term headings with short paragraph definitions.
Definitions for the US pro-forma disclosure: subscription, invoicing and other revenue, syndication payments revenue, Xero BillPay payments revenue, payments revenue, total Xero BillPay TPV, gross TPV take rate, total US direct customer revenue, direct US customers and direct US customer ARPC. Small print is only partly legible at this resolution.
White rounded panel with two text columns of bold headings and short definitions, with the right-hand third of the panel left empty.
Closing slide with the Xero logo and investor and media contacts: Nicole Mehalski, Investor Relations, and Simon Fitzgerald, Communications, each with an email address and phone number.
Dark navy slide with large light-blue organic shapes at the corners, centred logo and a two-column contact block separated by a thin vertical line.
關於此幻燈片和基礎簡報內容的常見問題。
It is Xero's English-language "H1 FY27 Investor briefing", lodged with the ASX on 12 November 2026. It covers the six months ended 30 September 2026 and is presented by CEO Sukhinder Singh Cassidy and CFO Claire Bramley.
The important notice on slide 2 says all currency amounts are in NZ dollars unless otherwise stated. Exceptions are marked on the slides, for example the A$1bn buy-back, US$ figures for Melio BillPay TPV and the Gartner TAM estimate.
Xero's financial year ends 31 March, so FY27 runs from 1 April 2026 to 31 March 2027. H1 FY27 is the first half, the six months ended 30 September 2026, and H2 FY27 is the second half ending 31 March 2027. The deck's ARPC bridge starts from 31 March 2026, the FY26 year end, and the cover states the period ended 30 September 2026.
Operating revenue was $1,745m (+46% reported, +27% pro-forma), adjusted EBITDA was $362m (+3% reported, +23% pro-forma) and free cash flow was $238m (+32% pro-forma). Customers rose 12% to 5.15m and ARPC rose 25% to $62.21.
Pro-forma refers to performance as if Xero and Melio had been combined for the full comparison periods (H1 FY25 and H1 FY26). Slide 44 reconciles the pro-forma adjusted P&L and free cash flow, and the statements are unaudited.
FY27 operating revenue is expected at $3,770m to $3,830m and adjusted EBITDA at $880m to $920m, with a pro-forma Rule of 40 outcome of around 40%. For FY28 the deck sees the opportunity for revenue above $4.6bn excluding synergies and expects Melio to reach run-rate adjusted EBITDA breakeven in H2 FY28.
Slides 24 to 31 show about 1m customers using GenAI features, survey data on SMB AI adoption, customer quotes, the Xero AI platform (JAX and Xforce), the Xforce beta launch with accounting partners, and monetisation through bundles, consumption and solutions. Slide 35 sets out Xero's response to AI threats.
Yes. It follows a classic structure: cover, legal notice, highlights, financial results, outlook, capital management, strategy section, then an appendix with detailed tables and a glossary. It uses KPI cards, paired bar charts, waterfalls and heat-map tables in a consistent navy, blue and mint style. It is informational only and not investment advice.

Create Your Own Slides
Turn your ideas into professional presentations in seconds with 2slides AI.
參考專業設計,選擇您的風格,產生具有完美文字渲染的投影片。由 Nano Banana 提供支援—立即開始建立您的簡報。


