
所屬合集: 投資人簡報案例 · 印度上市公司法說會簡報範例
Vedanta Limited Q2 FY27 (2QFY27) Earnings Presentation — the Indian diversified natural-resources group's results for the quarter and half-year ended 30 September 2026, filed with BSE/NSE on 28 October 2026. India's fiscal year FY27 runs from April 2026 to March 2027. Covers record quarterly revenue of ₹25,812 crore (+57% YoY), EBITDA of ₹9,938 crore (+106% YoY) at a 60% margin (excluding copper), PAT of ₹6,202 crore (+151% YoY), net debt cut to ₹3,675 crore (0.1x net debt/EBITDA), Zinc India record volumes and lower cost, the commissioning of Gamsberg Phase 2 at Zinc International, FACOR's underground chrome ore start, the copper business, ESG/CSR updates, FY27 guidance, capex tables and segment summaries. All amounts are in the deck's own units (₹ crore, US$). This is the post-demerger Vedanta Limited (demerger effective 1 May 2026), presented on a continuing-operations basis.
以這份簡報的封面作為風格參考,用您自己的內容產生幻燈片。 也可以在下方任選一頁,以它的版面作為參考。
快速導航
標籤
分享幻燈片
Vedanta Limited Q2 FY27 (2QFY27) Earnings Presentation — the Indian diversified natural-resources group's results for the quarter and half-year ended 30 September 2026, filed with BSE/NSE on 28 October 2026. India's fiscal year FY27 runs from April 2026 to March 2027. Covers record quarterly revenue of ₹25,812 crore (+57% YoY), EBITDA of ₹9,938 crore (+106% YoY) at a 60% margin (excluding copper), PAT of ₹6,202 crore (+151% YoY), net debt cut to ₹3,675 crore (0.1x net debt/EBITDA), Zinc India record volumes and lower cost, the commissioning of Gamsberg Phase 2 at Zinc International, FACOR's underground chrome ore start, the copper business, ESG/CSR updates, FY27 guidance, capex tables and segment summaries. All amounts are in the deck's own units (₹ crore, US$). This is the post-demerger Vedanta Limited (demerger effective 1 May 2026), presented on a continuing-operations basis.
每張幻燈片頁面的詳細視圖,包括版面、關鍵內容和視覺元素。
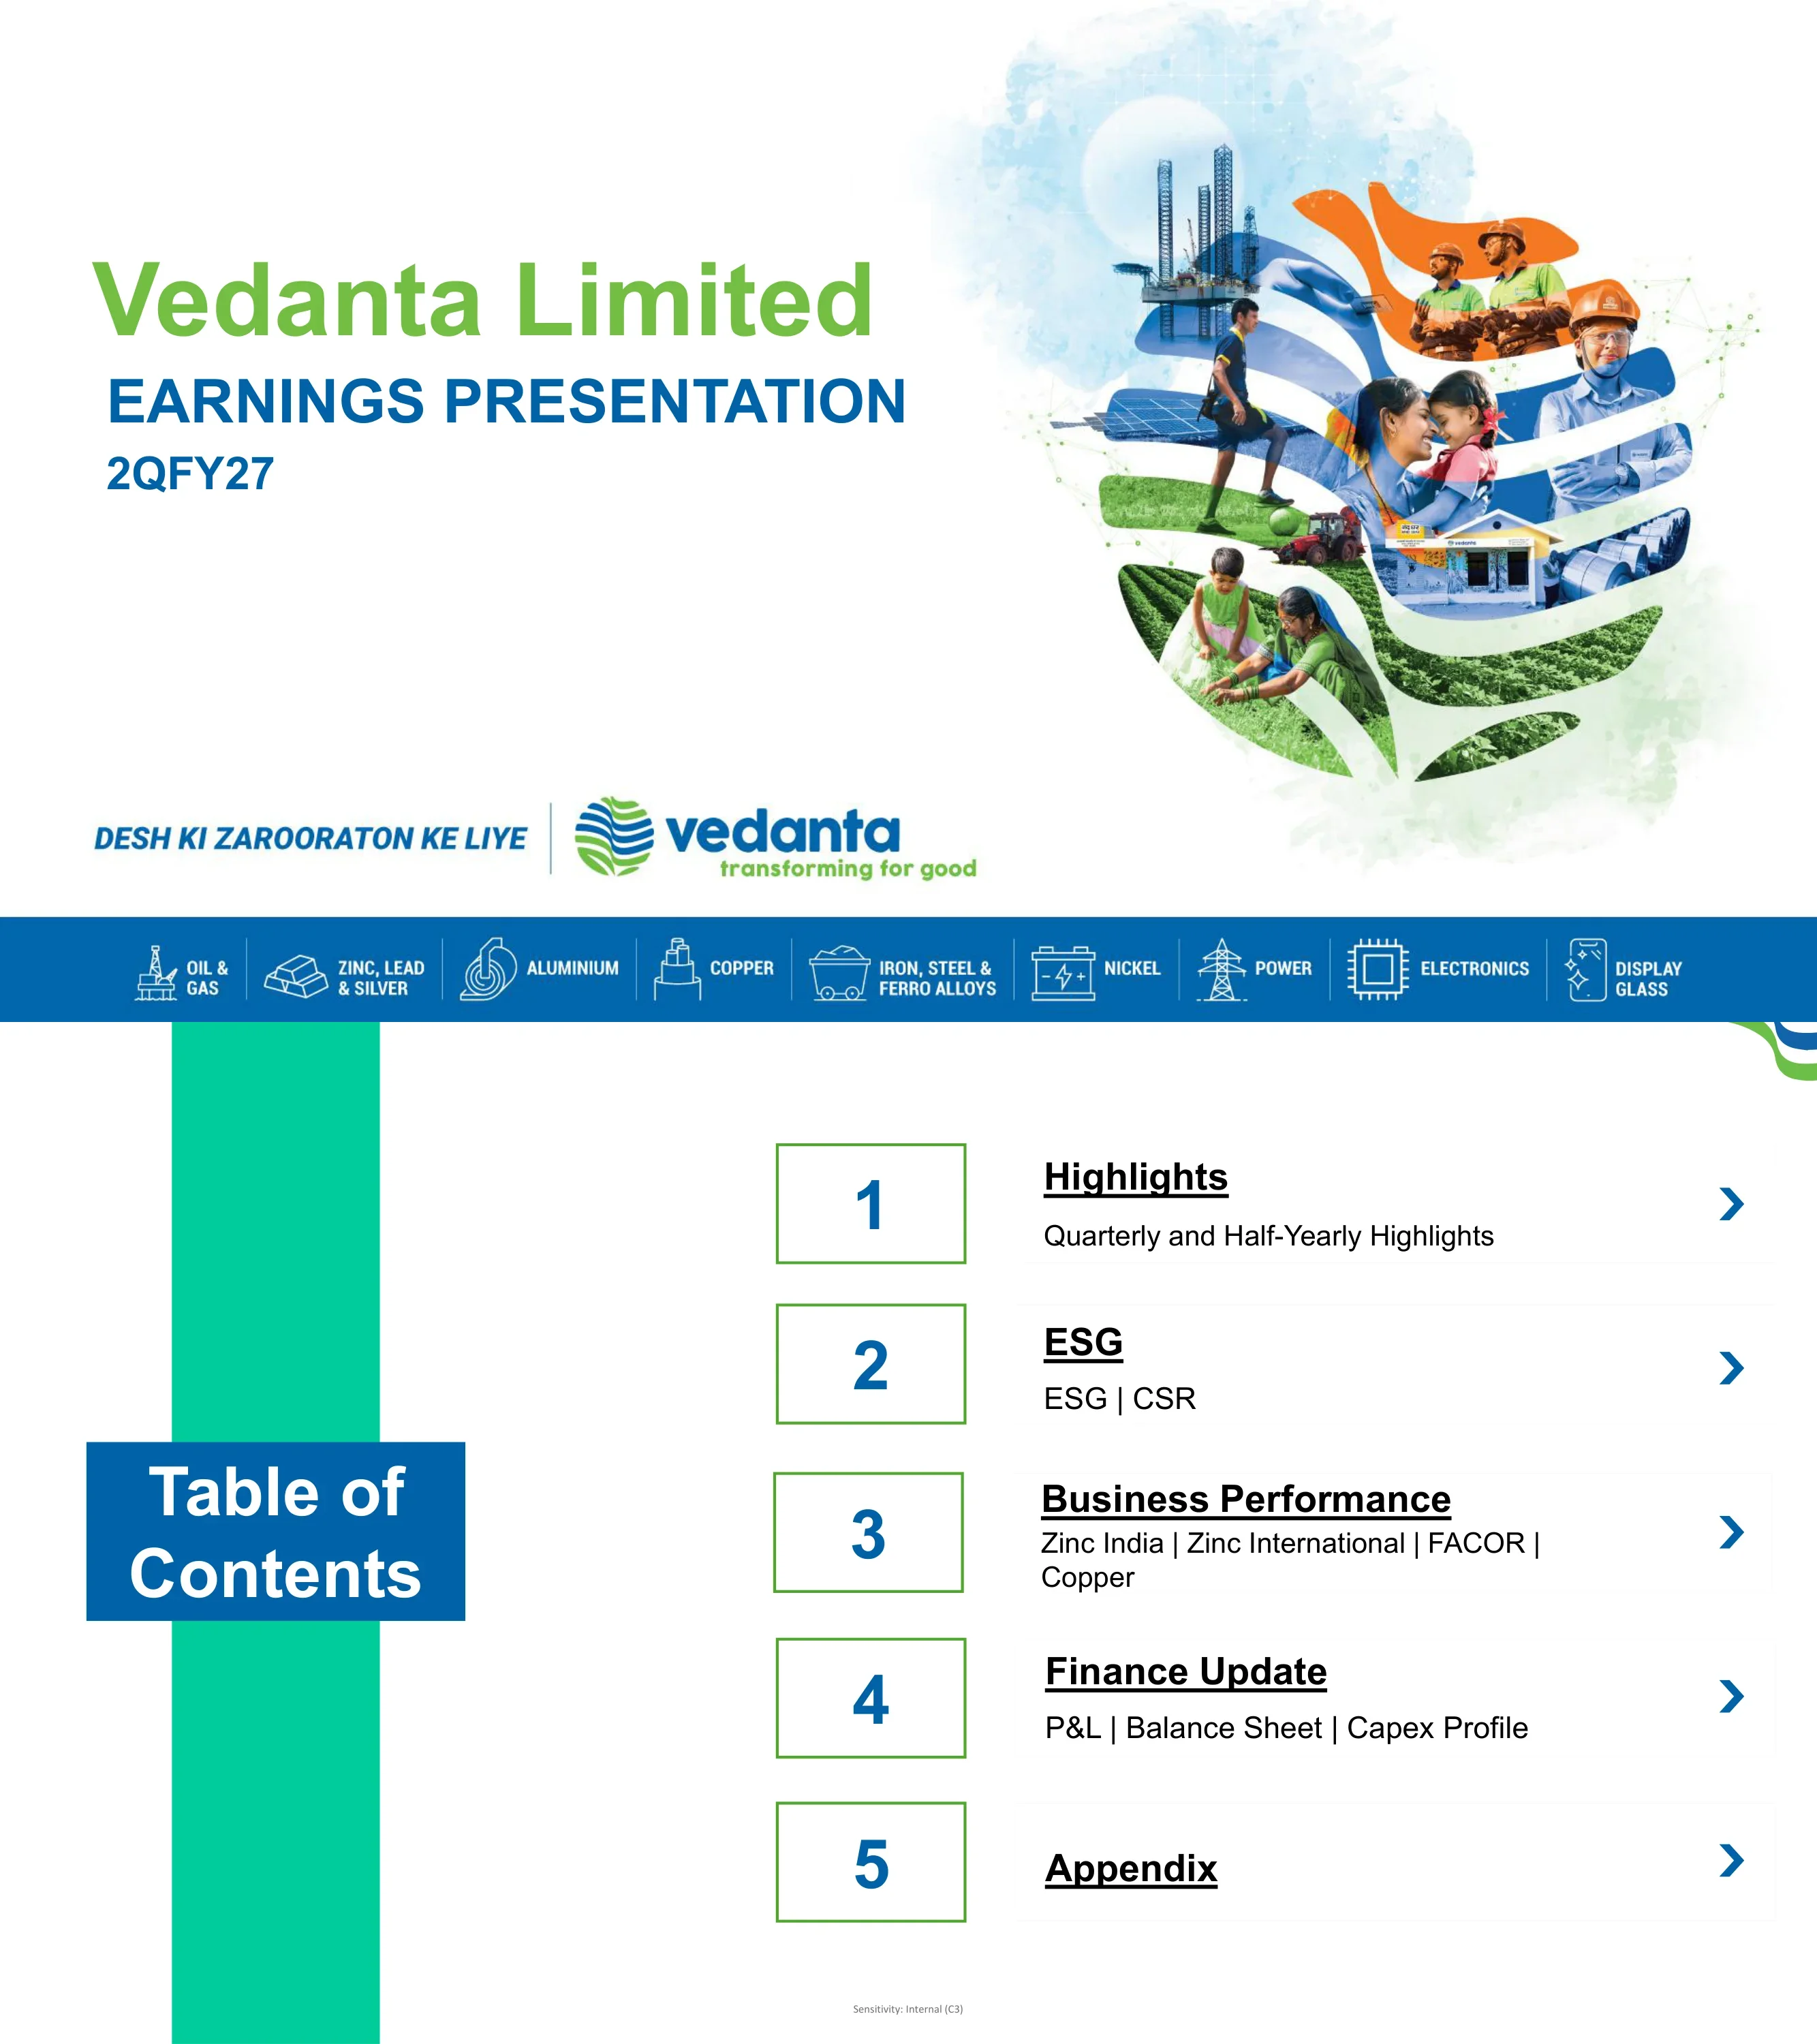
Cover slide with the title 'Vedanta Limited — Earnings Presentation 2QFY27', the tagline 'Desh ki zarooraton ke liye' and the Vedanta 'transforming for good' logo; a blue footer band lists the group's businesses: oil & gas, zinc-lead-silver, aluminium, copper, iron/steel/ferro alloys, nickel, power, electronics and display glass.
Left-aligned title block on white, large leaf-shaped photo collage on the right, full-width blue icon strip at the bottom
Five sections: 1 Highlights (quarterly and half-yearly), 2 ESG (ESG, CSR), 3 Business Performance (Zinc India, Zinc International, FACOR, Copper), 4 Finance Update (P&L, balance sheet, capex profile), 5 Appendix.
Vertical teal bar with a blue 'Table of Contents' label on the left; five numbered green-outlined boxes with section titles and chevrons on the right
Quarter KPIs: revenue ₹25,812 crore (+57% YoY, highest-ever), EBITDA ₹9,938 crore (+106% YoY, best-ever), PAT ₹6,202 crore (+151% YoY, highest-ever), EBITDA margin 60% (+1,055 bps YoY, excluding copper). Production: record 2Q mined metal at HZL 271 kt (+5%), silver 173 t (+20%), Zinc International 53 kt (-12%), record chrome ore 50 kt (+6%), ferrochrome 24 kt (+26%), record port dispatch 1.74 mt (+26%). Cost: HZL zinc ₹67,141/MT (-23%), FACOR ₹81,831/MT (-2%). Credit rating AA+/Stable from ICRA and CRISIL; net debt/EBITDA 0.1x; cash ₹26,622 crore; pre-capex FCF ₹5,803 crore. Side panel: growth capex ₹1,135 crore, Gamsberg Phase II commissioned, first ore from FACOR's Ostapal UG mines, first interim dividend ₹5/share, post-capex FCF ₹4,668 crore, and Vedanta Resources standalone net debt $5.2 bn at ~7% cost with average maturity over 4.5 years.
Blue left sidebar with milestone bullets; 3x3 grid of KPI tiles with green header pills on the right
Half-year KPIs: revenue ₹49,268 crore (+54% YoY), EBITDA ₹18,407 crore (+103% YoY), PAT ₹11,496 crore (+151% YoY), EBITDA margin 58% (+1,023 bps, excluding copper). Record 1H mined metal at HZL 539 kt (+3%), silver 321 t (+10%), Zinc International 102 kt (-13%), record chrome ore 202 kt (+31%), ferrochrome 53 kt (+13%), record ports discharge 4.19 mt (+32%); HZL zinc cost ₹73,789/MT (-15%), FACOR ₹78,940/MT. Pre-capex FCF ₹10,215 crore (post-capex ₹7,932 crore); capex ₹2,283 crore (Gamsberg Phase II, HZL 2x growth project, 450 KTPA ferrochrome); net debt ₹3,675 crore after deleveraging of ₹9,500+ crore in the half. Sidebar: demerger effective 1 May 2026 with four new entities listed on NSE and BSE on 15 June; Vedanta Resources raised $2.15 bn in bonds (avg 7.4%, 7.6 yrs) and a $1.85 bn term loan at SOFR+265 bps (3 yrs); VRL ratings S&P BB stable, Fitch BB stable, Moody's Ba3 positive — 'decadal high ratings'.
Same template as page 3: blue sidebar plus 3x3 KPI tile grid
Three pillars with photos: Transforming Planet — 120 MW RE-RTC (127 in Q1FY27) and GHG intensity 3.36 tCO2e/t-metal (3.68 in Q1); Transforming Workplace — 22% women in workforce and LTIFR 0.50 (0.49 in Q1); Transforming Communities — 0.46 million families skilled and 9.04 million women and children benefitted.
Three dashed-border cards side by side, each with a photo, icons and two metrics
Four numbered initiatives: 01 ESG Digital Transformation (ESG project tracker covering 1,500+ projects), 02 Climate & Carbon Data Automation (automated Scope 1, 2 and 3 accounting), 03 Critical Risk Management enhancement (role-specific checklists, five critical risk categories), 04 Sustainability Culture (Vedanta Sustainability Month 2026: 200+ events, 32,000+ people engaged, 2,400+ employees trained via VEDAS, 40+ board and senior leaders trained). A bottom strip lists five key outcomes delivered in Q2 FY27.
Four colored columns (green, blue, orange, green) each with a numbered circle, image, icon bullets and an impact box; outcome strip across the bottom
Planet: HZL six-year contract with MFL India for 30 electric trucks; Nicomet cut GHG emissions 50% (8.6 to 4.58 tCO2) by halving steam use; HZL greenbelt partnership with ICFRE Arid Forest Research Institute; HZAPL at 100% renewable power. Workplace: HZL vehicle-pedestrian safety rules and 360° blind-spot cameras on 121 LHDs; FACOR's 37th Suraksha Sankalp; HZL ICMM leadership masterclasses. Communities: Nicomet supported 778 students; HZL Shiksha Sambal camp reached 1,600+ students (programme spans 76 schools, 47,000+ students); FACOR reached 450+ beneficiaries.
Three column cards with a photo on top and justified bullet text below, tinted green/blue/green
H1 FY27 CSR highlights: 2.81 million beneficiaries, 3,211 Nand Ghars developed, ₹217.2 crore CSR spent. Footprint of 3,500+ villages across 17 states and 8 aspirational districts, plus VZI in South Africa. Beneficiaries by theme: healthcare, children's well-being and education 1.77 Mn; women empowerment, skilling and livelihoods 68.1 K; community infrastructure, water and sanitation 0.50 Mn; environment, sports, culture and animal welfare 0.47 Mn; Anil Agarwal Foundation programmes 0.22 Mn (included above). Cover of the 'Chronicles of Change' CSR newsletter, edition 5, and a note on a unified volunteering portal; financial and programmatic numbers marked as under audit.
Highlight ribbon at top; India/Africa map at left; icon-pair rows with values in the centre; newsletter cover image at right
Record 2Q mined metal of 271 kt (+5% YoY) and record 1H mined metal for the sixth consecutive year; best-ever 2Q refined metal of 264 kt (+7%); 2Q silver 173 tonnes (+20%), contributing c.45% of 1H profitability. Zinc COP (excluding royalty) $703/t in 2Q (29% better YoY) and $776/t in 1H (23% better). Renewable power at 27% of consumption, zinc alloy plant at 100% renewable; 250 KTPA integrated zinc expansion engineering and procurement largely complete. Charts: mined metal 258/268/271 kt (2QFY26/1QFY27/2QFY27), 523/539 kt (1H); refined metal 246/260/264 kt, 496/524 kt; COP $994/851/703 and $1,002/776; saleable silver 144/149/173 t and 293/321 t.
Two bullet panels on top; three chart panels below (mined metal, refined metal with COP line, saleable silver)
Gamsberg MIC production 49/45/46 kt (2QFY26/1QFY27/2QFY27) and 94/92 kt (1H FY26/1H FY27); Gamsberg COP including TcRc $1,282/1,549/1,533 per tonne and $1,172/1,541 for the halves. Highlights: record total ore mined of 1.88 million tonnes; R&R of 269 Mt of ore containing 20 Mt of metal with a 33-year life of mine; BMM produced 7.1 kt MIC in Q2, up 144% QoQ. Gamsberg Phase 2 started in Sep'26 with hot commissioning and stabilization in progress; first ore charge in August 2026 and first MIC in September 2026.
Left: stacked column chart and line chart panels; right: two bullet panels for highlights and growth
Concentrator Phase 2: 4 MTPA ROM and 200 KTPA MIC production; first MIC achieved in September 2026. The concentrator is commissioned and stabilizing at 400 TPH average throughput (70% of rated capacity), 88% recovery and 49% concentrate grade. 350+ jobs at full-scale operations; TSF Phase II construction at 46%.
Bullet list on the left; 2x2 photo grid of the concentrator under a green-to-navy banner on the right
Ferrochrome production 19/29/24 kt (2QFY26/1QFY27/2QFY27), 47/53 kt for 1H; cost of sales $962/810/856 per tonne and $917/831 for 1H; ROM production 47/153/50 kt and 155/202 kt. Highlights: ferrochrome 24 kt (+26% YoY), second-highest Q2; RoM 50 kt (-67% QoQ, +6% YoY) after restarting Kalarangiatta mine in Nov'25, highest-ever Q2 RoM; cost $856/MT (-11% YoY) with 100% captive ore; NSR up 2% QoQ and 8% YoY; EBITDA $8 Mn. Growth: underground chromite ore production started in Q2'27; 330 KTPA smelter expected in operation in H2'28.
Three stacked chart panels on the left (columns, two line charts); highlights and growth-project panels on the right
Copper India achieved its highest-ever quarterly cathode production in Q2'27, with a 65% renewable energy share (68 lakh units of green power) and a record-time CCR shutdown. Copper International (Fujairah) sales fell due to supply-chain disruption from the closure of the Strait of Hormuz; operations revived, targeting a 20+ kt quarterly run rate by Q3FY27. Strategic: VCI rod mill 74% complete, full completion by Dec'26; preliminary work started on the KSA Jabal-Sayid Site-1 exploration block. Charts: cathode 40/41/46 kt (84/87 kt in H1); rod 45/52/44 kt (annual CCR shutdown); sales 45/53/53 kt (97/106 kt in H1); EBITDA -2.0, -1.1, 8.2, 9.1 $Mn over 1QFY26–2QFY27; Copper International rod 22/10/6 kt (geopolitical tensions).
Operational and strategic bullet panels on top; Copper India multi-chart panel and Copper International chart panel below
Section divider introducing the finance section for 2QFY27.
White rounded card with logo and title on the left, copper-wire photo on the right, over a blurred copper background
Eight KPI cards: revenue ₹25,812 crore (+57% y-o-y), EBITDA ₹9,938 crore (+106%), EBITDA margin 60% (+1,055 bps, excludes copper), PAT ₹6,202 crore (+151%), net debt ₹3,675 crore (reduced by >₹9,500 crore since March), pre-capex FCF ₹5,803 crore (+32%), net debt/EBITDA 0.1x (from 0.3x in 1QFY27), cash and cash equivalents ₹26,622 crore (+134%).
2x4 grid of tab-style cards with icon, label, large figure and colored bottom bar
EBITDA rose from ₹4,817 crore to ₹9,938 crore (+106% YoY): LME/Brent/premium +3,324 and forex +1,048 (market and regulatory ₹4,372 crore) give rebased EBITDA of 9,189; then volume +553, cost +132, marketing and others +64. Exchange rate 95.57 vs 87.31.
Horizontal waterfall chart with dashed bracket showing the YoY change
EBITDA rose from ₹8,469 crore to ₹9,938 crore (+17% QoQ): LME/Brent/premium +365 and forex +131 (market and regulatory ₹496 crore) to rebased 8,965; volume +591, cost +661, marketing and others (279). Exchange rate 95.57 vs 94.58.
Same waterfall template as page 16
Net debt fell from ₹8,299 crore (30 Jun'26) to ₹3,675 crore (30 Sep'26), a reduction of ₹4,624 crore, with ND/EBITDA improving from 0.3x to 0.1x. Drivers: cash flow from operations (7,309), working capital (121), capex 2,762 (project capex 1,304; sustaining capex 1,458), others 45; FCF post capex ₹4,668 crore.
Waterfall chart with boxed callout at top and a small capex breakdown table
Net debt/EBITDA 0.1x; net debt ₹3,675 crore, down ₹4,624 crore QoQ on operating cash flow; finance cost ~8.3% (YTD average, closing ~8.27%); cash ₹26,622 crore; ICRA and CRISIL AA+/Stable. Debt table ($bn / ₹'000 crore): term debt 2.88/27.61, working capital 0.17/1.60, short-term borrowing 0.11/1.08, total consolidated debt 3.16/30.30, cash 2.78/26.62, net external debt 0.12/1.17, group-company debt 0.26/2.50, total net debt 0.38/3.67. Term debt is 61% INR and 39% USD/foreign currency. USD–INR ₹95.92 on 30 Sep 2026.
Bullet list on the left; striped data table with highlighted totals on the right
Section divider opening the appendix.
Logo and 'Appendix' title on a white left panel; large aerial night photo of a processing plant on the right
Zinc India: mined metal 1,140–1,160 kt, finished metal 1,090–1,110 kt, silver 670–690 tonnes, CoP $825–850/t (excluding royalty), capex $0.5–0.6 bn. Zinc International: Gamsberg 250–270 kt, BMM 30–35 kt, CoP $1,500–1,550/t, capex $0.12 bn. Copper: cathode 195–205 kt, rod India 210–220 kt, rod international 80–90 kt. Port business: discharge 8.8–9.0 MMT, dispatch 8.9–9.1 MMT. FACOR: ferrochrome 105–115 kt, capex $0.11 bn.
Five dotted-border guidance cards with circular icons, two per column plus one
US$ mn projects (approved / spent to FY26 / spent 1H FY27 / unspent at 30 Sep 2026): Gamsberg Phase II 595/483/61/51; iron ore project 37/27/0.5/9.5; copper rod plant KSA 31/7/12/12. ₹ crore projects: 250 KTPA integrated zinc smelter at Debari 12000/621/772/10607; tailing reprocessing plant at Rampura Agucha 3823/426/265/3132; fertilizer plant 1850/1325/117/408; FACOR 150 to 450 KTPA ferro chrome 2650/1060/176/1414. Figures are cash outflows excluding IDC.
Two stacked tables with a highlighted 'Approved Capex' column
Table (₹ crore, 2QFY27 / 1QFY27 / 2QFY26): revenue 25,812 / 23,456 / 16,445; other operating income 544 / 749 / 291; EBITDA 9,938 / 8,469 / 4,817; D&A -1,339 / -1,192 / -1,124; finance cost -696 / -662 / -761; investment income 495 / 483 / 343; other Fx -8 / 91 / -68; tax -2,188 / -1,895 / -736; PAT from continuing operations 6,202 / 5,294 / 2,471 — up 151% YoY and 17% QoQ. Commentary: D&A up 19% YoY on higher HZL production; interest cost down 9% YoY; interest income up 44% YoY; ETR 26%. Figures are continuing operations on a like-for-like basis; SEBI-reported results also include discontinued operations.
Commentary bullets on the left; financial table with shaded current-quarter column on the right
₹ crore debt / cash / net debt by entity at 30-Sep-26, 30-Jun-26 and 30-Sep-25. At 30-Sep-26: Vedanta Limited standalone 14,775 / 7,996 / 6,779; Zinc India 6,171 / 17,439 / (11,268); Zinc International 2,266 / 488 / 1,778; THLZV 5,004 / 14 / 4,990; Fujairah 1,237 / 292 / 945; consolidated 30,297 / 26,622 / 3,675 (vs 8,299 at 30-Jun-26 and 16,644 at 30-Sep-25). Also lists Avanstrate, VGCB, Vedanta Copper International, Facor and others.
Wide three-period table with alternating blue and grey header groups
Long-term debt of $2.88 bn ($1.31 bn standalone, $1.57 bn subsidiaries) as of 30 Sep 2026, funded 41% bonds INR, 20% term loan INR, 39% term loan Fx and 0.1% bonds Fx. Maturities of ₹27.61K crore ($2.88 bn) in ₹'000 crore: FY27 5.0, FY28 7.3, FY29 7.5, FY30 and beyond 7.8, split between standalone and subsidiaries.
Donut chart on the left, stacked column chart on the right, separated by a dashed line
2QFY27 vs 2QFY26: mined metal 271 vs 258 kt (+5%); saleable metal 264 vs 246 (+7%); refined zinc 212, lead 51, silver 173 t (+20%). Revenue ₹14,525 crore (+76%), EBITDA ₹9,243 crore (vs 4,434); 1H revenue 27,510 and EBITDA 17,339. Zinc CoP without royalty ₹67,141/MT ($703, -29%), with royalty $1,228; zinc LME $3,825 (+35%), lead $1,857, silver $62.6/oz (+59%); wind power 155 million units.
Quarter and half-year comparison table with shaded current-period columns
2QFY27: BMM mined metal 7 kt (-37% YoY), Gamsberg 46 kt (-6%), total 53 kt (-12%); 1H total 102 kt (-13%). Revenue ₹1,730 crore (+40%), EBITDA ₹550 crore (+47%); CoP $1,678/MT (+13%); 1H EBITDA 800 (+1%).
Single comparison table
FACOR 2QFY27: ore 50 kt, ferrochrome 24 kt (+26%), revenue ₹320 crore (+49%), EBITDA ₹77 crore (vs 21), margin $339/MT. Copper 2QFY27: cathodes 46 kt (+17%), rods India 44 kt (-2%), rods international 6 kt (-73%), revenue ₹9,280 crore (+41%), EBITDA ₹80 crore (vs -13), copper LME $14,104/MT (+44%).
Two stacked comparison tables
Zinc India 2QFY27 sales: refined zinc 214 kt (+6%), refined lead 51 kt (+14%), total zinc-lead 265 kt (+8%), silver 173 tonnes (+17%). Zinc International: zinc concentrate 50 kt (-7%), lead concentrate 5 kt (-28%), total 55 kt (-9%).
Single table split into two business blocks
2QFY27 sales: ferrochrome 24 kt (+23%); copper cathodes 7 kt; copper rods India 46 kt (+3%); copper rods international 6 kt (-74%). Port business dispatch 1,739 (+26%) and discharge 1,827 (+22%), labelled MMT; 1H dispatch 3,391 and discharge 4,185.
Single table with three business blocks
₹1 depreciation of INR/USD adds ~₹350–375 crore to yearly EBITDA. Commodity sensitivity at 2Q FY27 average prices: zinc $3,825/t, +$100/MT adds ₹975–1,000 crore; lead $1,857/t, +$100 adds 175–200; silver $63/oz, +$1/oz adds 200–225; copper $14,104/t, +$1,000 adds 100–125. A $25/t change in Zinc India CoP moves EBITDA ~225–250; Zinc International ~65–90 (₹ crore).
Three stacked tables with green header rows
As on 30 September: Vedanta Resources owns 54.72% of Vedanta Ltd; Sterlite Copper (including Nicomet) is a division. Subsidiaries: Zinc India (HZL) 60.71% (listed), Zinc International 100% (Skorpion 100%, BMM & Gamsberg 74%), FACOR 99.99%, Vedanta Copper International 100%, Fujairah Gold 100%, Vizag General Cargo Berth 100%, Avanstrate Inc. 98.42%, Vedanta Displays 100%, Vedanta Semiconductors 100%.
Top-down org chart with green listed and blue unlisted boxes and ownership percentages
Earnings conference call on 28 October 2026 from 4:30 PM to 5:00 PM IST, with universal dial-in, India toll-free and international toll-free numbers for several countries, an online registration link, and a note that the call recording will be on the company website on 29 October 2026.
Bordered table with event, dial-in and country-number columns
Standard legal disclaimer covering unverified public information, forward-looking statements and their uncertainties (metal prices, exchange rates, regulation), no offer of securities, and a note that comparative periods are aligned to continuing businesses for like-for-like comparison.
Full-width justified text paragraphs under a heading with a green accent bar
關於此幻燈片和基礎簡報內容的常見問題。
It is Vedanta Limited's 34-page investor presentation for the quarter ended 30 September 2026 (2QFY27), filed with BSE/NSE on 28 October 2026. It covers highlights, ESG and CSR, segment performance for Zinc India, Zinc International, FACOR and Copper, a finance update, FY27 guidance and an appendix of tables.
Indian fiscal years run April to March, so FY27 covers April 2026 to March 2027 and Q2 FY27 is July to September 2026. The half-year (1H FY27) covers April to September 2026.
Per the deck: revenue ₹25,812 crore (+57% YoY), EBITDA ₹9,938 crore (+106% YoY), a 60% EBITDA margin excluding copper, and PAT from continuing operations of ₹6,202 crore (+151% YoY). Net debt fell to ₹3,675 crore and net debt/EBITDA to 0.1x.
No. The demerger became effective on 1 May 2026 and the new entities listed on 15 June. This presentation covers Vedanta Limited as it now stands — Zinc India (HZL), Zinc International, FACOR, Copper and other subsidiaries — on a continuing-operations basis; the separately listed entities publish their own presentations.
Financials are in Indian rupees, mostly ₹ crore (1 crore = 10 million). Costs and commodity prices are often in US$ per tonne, and project capex for international assets is in US$ million. The deck cites USD–INR of ₹95.92 on 30 September 2026.
Yes. The original PDF and an editable PPTX conversion are available, so you can reuse the KPI tile grids, EBITDA bridge waterfalls, segment chart panels and data tables. The PPTX is machine-converted, so check fonts and chart objects before reusing it.
The 2Q and 1H highlights grids (pages 3–4), the financial snapshot cards (page 15), the EBITDA bridges and net-debt walk (pages 16–18), the FY27 guidance cards (page 21) and the entity structure chart (page 32) work well as patterns for any quarterly results deck.
Page 21 guides Zinc India mined metal of 1,140–1,160 kt at a CoP of $825–850/t, Gamsberg 250–270 kt, copper cathode 195–205 kt, ferrochrome 105–115 kt, and port discharge of 8.8–9.0 MMT, along with capex ranges per business.
Original corporate filing with the cover letter; this gallery copy has the cover letter pages removed.

Create Your Own Slides
Turn your ideas into professional presentations in seconds with 2slides AI.
參考專業設計,選擇您的風格,產生具有完美文字渲染的投影片。由 Nano Banana 提供支援—立即開始建立您的簡報。


