
所屬合集: 投資人簡報案例
Unimicron Q3 2026 Earnings Presentation is a short, nine-slide bilingual (Chinese/English) deck titled "Unimicron 2026 Q3 Earnings Conference" (欣興電子2026第三季度法人說明會), filed on Taiwan's Market Observation Post System (MOPS) on 11 November 2026 for the investor conference (法說會). It is a compact financial deck with no strategy or outlook narrative: a disclaimer, a sales and gross margin trend, three financial statements, and two sales breakdowns. Amounts are in NT$ (New Taiwan dollars) millions.
以這份簡報的封面作為風格參考,用您自己的內容產生幻燈片。 也可以在下方任選一頁,以它的版面作為參考。
快速導航
標籤
分享幻燈片
Unimicron Q3 2026 Earnings Presentation is a short, nine-slide bilingual (Chinese/English) deck titled "Unimicron 2026 Q3 Earnings Conference" (欣興電子2026第三季度法人說明會), filed on Taiwan's Market Observation Post System (MOPS) on 11 November 2026 for the investor conference (法說會). It is a compact financial deck with no strategy or outlook narrative: a disclaimer, a sales and gross margin trend, three financial statements, and two sales breakdowns. Amounts are in NT$ (New Taiwan dollars) millions.
每張幻燈片頁面的詳細視圖,包括版面、關鍵內容和視覺元素。
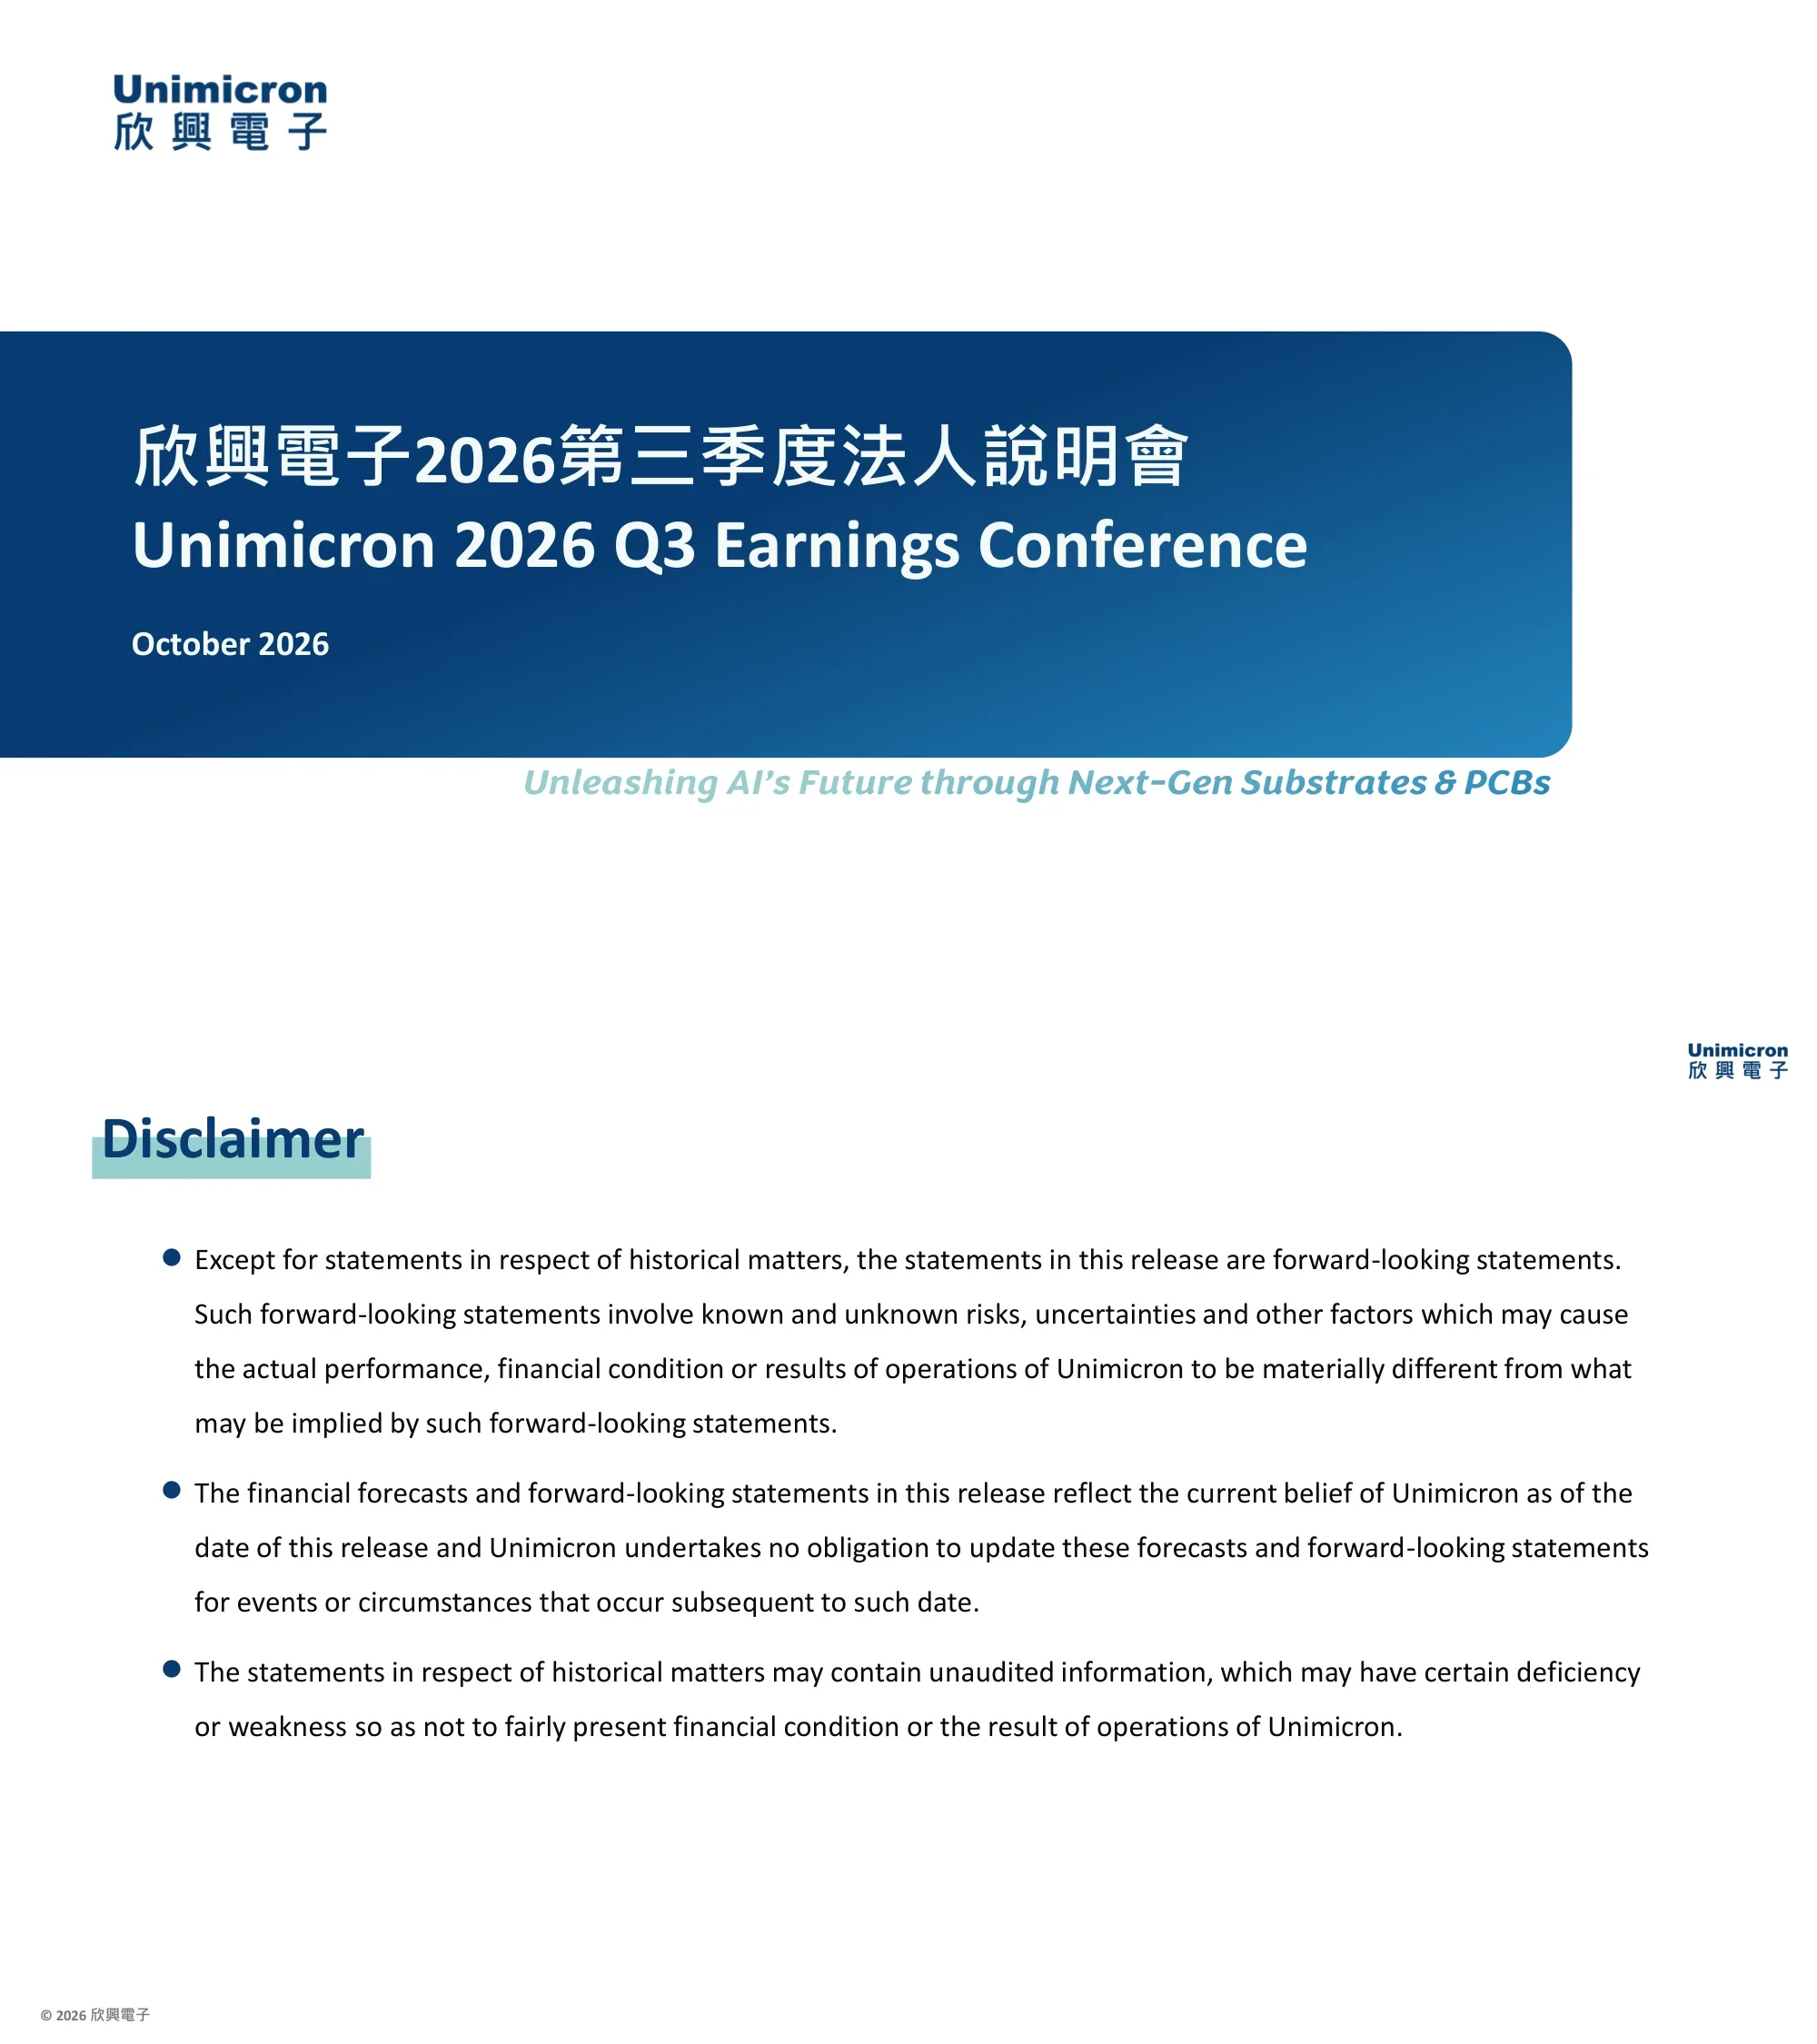
The cover announces the Unimicron 2026 Q3 Earnings Conference in Chinese (欣興電子2026第三季度法人說明會) and English, dated October 2026. The tagline reads "Unleashing AI's Future through Next-Gen Substrates & PCBs". No figures appear on this slide.
White page with the Unimicron / 欣興電子 logo at top left and a large dark-to-light blue gradient banner with rounded right edge holding the white two-line title and date. The tagline in teal italic sits below the banner.
Three bullets state that, apart from historical matters, the statements are forward-looking and subject to known and unknown risks that could make actual results differ materially. Forecasts reflect Unimicron's belief as of the release date, with no obligation to update them. Historical statements may contain unaudited information that may not fairly present the financial condition or results.
Text-only slide with a teal-highlighted heading, three round-bulleted paragraphs, a small logo top right and a copyright footer at bottom left.
Quarterly consolidated sales (NT$ in millions) rise from 29,381 in 4Q24 to 30,090, 32,466, 33,994, 34,691, 37,446 and 42,890, reaching 52,650 in 3Q26. Gross margin moves from 11.6% in 4Q24 to 13.4%, 13.1%, 13.4%, 15.8%, 18.0%, 24.8% and 28.8% in 3Q26. Both sales and margin accelerate over the last three quarters.
Combination chart: blue gradient columns for sales (left axis 0 to 60,000) with a gold GM% line (right axis 0% to 40%) over eight quarter labels. Sales values sit inside the bars and GM% labels above them.
Q3-26 net sales were NT$52,650 million (up 23% QoQ, 55% YoY), with gross profit of 15,189 (28.8%), operating income of 10,528 (20.0%) and income before tax of 13,163 (25.0%). Net income was 10,420 (19.8% of sales), of which 10,052 is attributable to shareholders of the parent. EBITDA was 19,790 (38% of sales), and basic and diluted EPS were 6.36 and 6.32. Q2-26 comparison: net income 13,342, EPS 8.45 basic; Q3-25: net income 2,451, EPS 1.44 basic. Net non-operating income was 2,635 versus 8,925 in Q2-26.
Dense financial table with Q3-26, Q2-26 and Q3-25 columns, each paired with a percent-of-sales column, plus QoQ % and YoY % columns. The Q3-26 column is outlined by a rounded blue frame, and subtotals are in bold.
At 30 September 2026 total assets were NT$399,844 million, up from 313,243 at 30 June and 266,881 at 31 March. Cash rose to 159,694 (39.9% of assets) from 93,096 and 60,179. Shareholders' equity was 182,071 (45.5%) against 127,720 (40.8%) at 30 June. Net inventory turnover was 58 days and net accounts receivable turnover 68 days.
Three-date table (SEP.30, JUN.30, MAR.31 of 2026), each with an amount and percent-of-total column, listing assets then liabilities and equity. The SEP.30 column is framed in blue, with turnover days at the bottom.
Q3-26 net cash from operating activities was NT$11,799 million (7,490 in Q2-26; 2,233 in Q3-25). Investing used 10,685, including 10,098 on fixed assets and investment property. Financing provided 65,198, including a cash capital increase of 43,246, offset by cash dividends of 3,151. Cash increased by 66,433 to 160,406 at period end, with 712 cash classified as held for sale (disposal group) shown separately.
Three-column table (Q3-26, Q2-26, Q3-25) grouped into operating, investing and financing sections with bold subtotals, ending with change in cash and cash at end of period. The Q3-26 column is outlined in blue.
Substrates were 62% of Q3-26 sales of NT$52,650 million, up from 61% in 2Q26 and 57% in 3Q25. HDI was 27%, PCB 9% (13% in 3Q25), FPC 1% and other 1%. By technology, substrate sales grew 26% QoQ and 69% YoY, HDI 22% and 52%, PCB 18% and 12%, while FPC fell 20% QoQ and 23% YoY.
Three stacked columns (3Q25, 2Q26, 3Q26) with totals above and percentage labels per segment in gold, navy, blue, light teal and grey. A right-hand legend lists each technology with QoQ and YoY columns.
AI Data Center was 68% of Q3-26 sales, up from 61% in 2Q26 and 49% in 3Q25, growing 35% QoQ and 115% YoY. IoT was 18% (31% a year earlier), communication 5%, automotive 4% and others 5%. Growth rates: IoT -5% QoQ and -9% YoY, communication +28% and +14%, automotive +23% QoQ and -10% YoY.
Same stacked-column format as the previous slide (3Q25, 2Q26, 3Q26) with segment percentages and a right-hand legend giving QoQ and YoY change for each application.
The closing slide shows only the company website address, https://www.unimicron.com/. It contains no further content.
Nearly blank white slide with the underlined navy URL centered, the logo top right and a copyright footer.
關於此幻燈片和基礎簡報內容的常見問題。
It is the Unimicron 2026 Q3 Earnings Conference deck (欣興電子2026第三季度法人說明會), filed on Taiwan's Market Observation Post System (MOPS) on 11 November 2026 for the investor conference (法說會). The cover is bilingual Chinese and English and the rest of the deck is in English. The cover is dated October 2026.
It has nine slides: cover, disclaimer, a sales and gross margin chart, income statement, balance sheet, cash flow statement, sales by technology, sales by application, and a closing website slide. It is a short, numbers-only deck without a separate outlook or strategy section.
Consolidated sales were NT$ (New Taiwan dollars) 52,650 million with a gross margin of 28.8%, compared with NT$42,890 million and 24.8% in Q2 2026 and NT$33,994 million and 13.4% in Q3 2025.
Q3-26 operating income was NT$10,528 million (20.0% of sales), net income NT$10,420 million, and basic EPS NT$6.36 (diluted 6.32). EBITDA was NT$19,790 million, 38% of sales.
By technology in 3Q26: substrate 62%, HDI 27%, PCB 9%, FPC 1%, other 1%. By application: AI Data Center 68%, IoT 18%, communication 5%, automotive 4%, others 5%.
No. None of the nine slides presents guidance, a forecast or a business outlook. The only forward-looking reference is the disclaimer slide, which describes the risks around forward-looking statements.
Total assets were NT$399,844 million, cash NT$159,694 million (39.9% of assets) and shareholders' equity NT$182,071 million (45.5%). The cash flow slide shows a NT$43,246 million cash capital increase in Q3-26.
The structure is a useful reference: title, disclaimer, trend chart, three statements with the current period highlighted in a frame, then mix charts. The content belongs to Unimicron, so use it for study and layout inspiration rather than republishing it as your own.

Create Your Own Slides
Turn your ideas into professional presentations in seconds with 2slides AI.
參考專業設計,選擇您的風格,產生具有完美文字渲染的投影片。由 Nano Banana 提供支援—立即開始建立您的簡報。


