
所屬合集: 投資人簡報案例 · 日本上市公司法說會簡報範例
Tokai Carbon Co., Ltd. (TSE: 5301) Q3 FY2026 earnings presentation covering January–September 2026 results. Tokai Carbon reports on a December fiscal year, so FY2026 runs January–December 2026 and Q3 is the nine-month cumulative period (with July–September as the third quarter). This is a Japanese-language deck (original title: 2026年12月期第3四半期決算説明会資料, dated November 6, 2026) published on TDnet, the Tokyo Stock Exchange timely disclosure system. Nine-month net sales rose 15.3% to ¥273,674 million and operating profit rose 32.0% to ¥27,507 million, with EBITDA of ¥55,261 million and an EBITDA margin of 20.2%. The deck breaks results down across carbon black, fine carbon (semiconductor-use solid SiC focus rings and graphite parts), smelting & lining, graphite electrodes and industrial furnaces, and includes cash flow, balance sheet, a five-year KPI table and quarterly segment data with the full-year forecast.
以這份簡報的封面作為風格參考,用您自己的內容產生幻燈片。 也可以在下方任選一頁,以它的版面作為參考。
快速導航
標籤
分享幻燈片
Tokai Carbon Co., Ltd. (TSE: 5301) Q3 FY2026 earnings presentation covering January–September 2026 results. Tokai Carbon reports on a December fiscal year, so FY2026 runs January–December 2026 and Q3 is the nine-month cumulative period (with July–September as the third quarter). This is a Japanese-language deck (original title: 2026年12月期第3四半期決算説明会資料, dated November 6, 2026) published on TDnet, the Tokyo Stock Exchange timely disclosure system. Nine-month net sales rose 15.3% to ¥273,674 million and operating profit rose 32.0% to ¥27,507 million, with EBITDA of ¥55,261 million and an EBITDA margin of 20.2%. The deck breaks results down across carbon black, fine carbon (semiconductor-use solid SiC focus rings and graphite parts), smelting & lining, graphite electrodes and industrial furnaces, and includes cash flow, balance sheet, a five-year KPI table and quarterly segment data with the full-year forecast.
每張幻燈片頁面的詳細視圖,包括版面、關鍵內容和視覺元素。
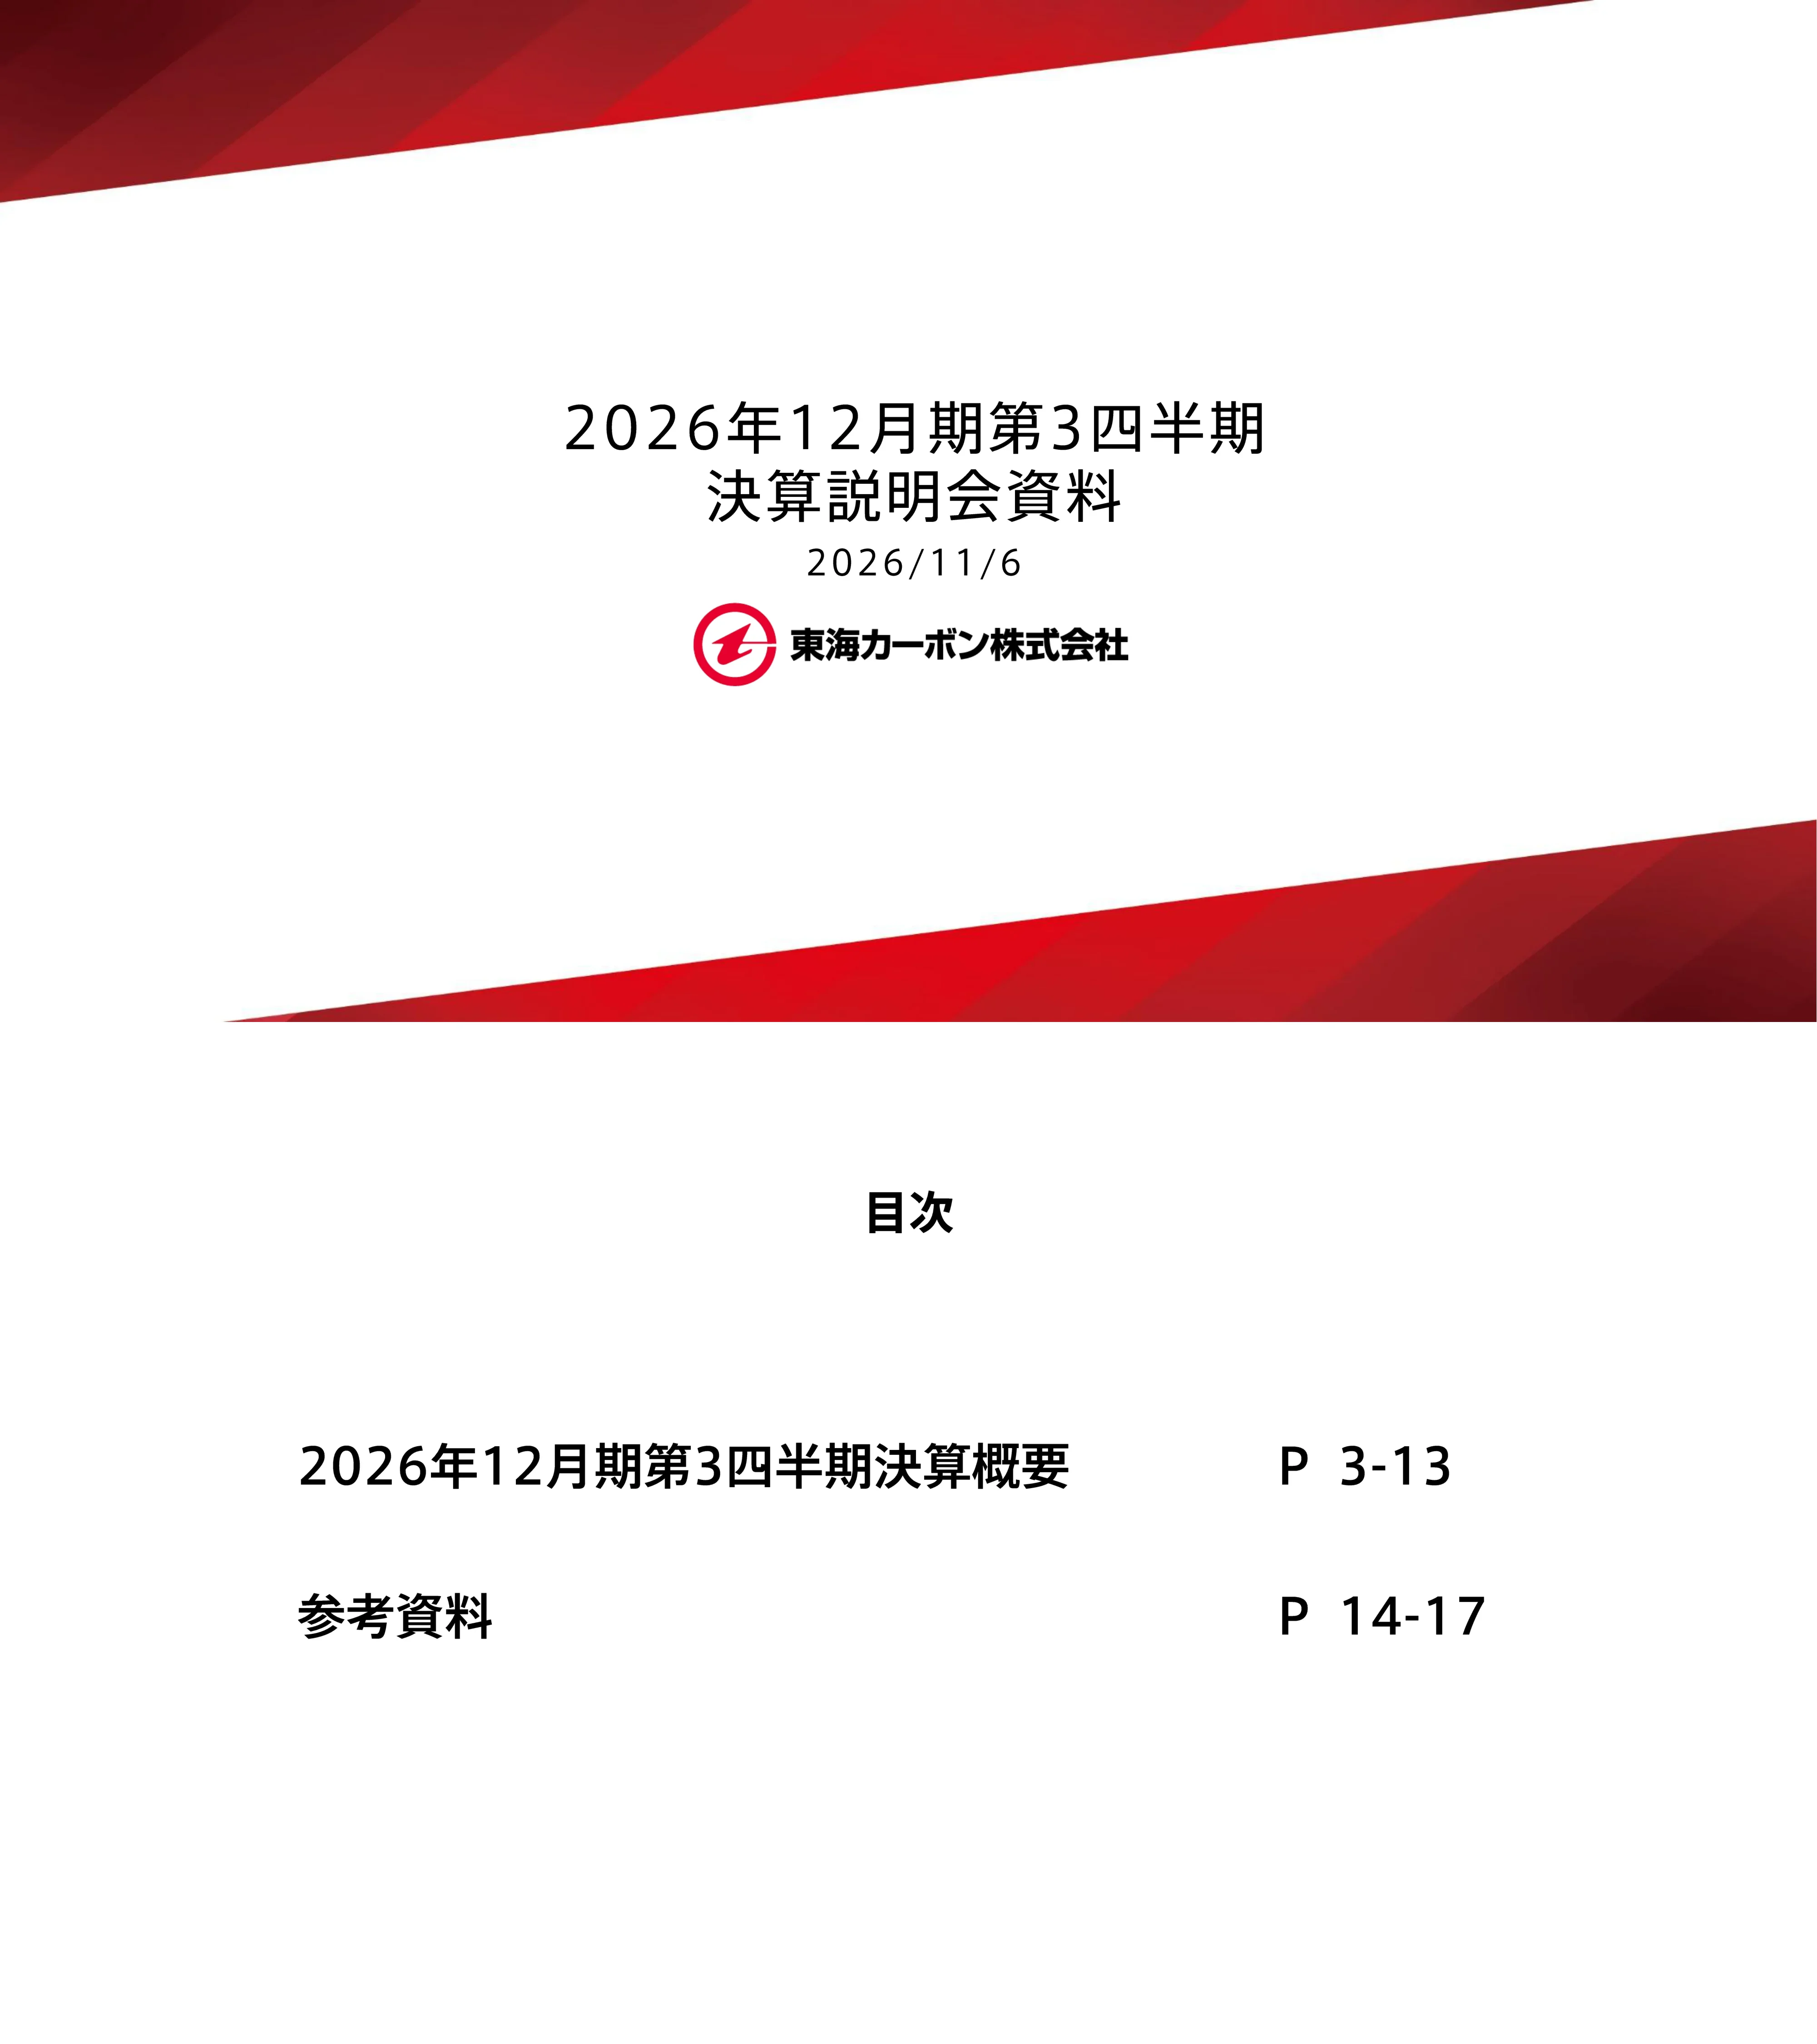
Title slide in Japanese: 2026年12月期第3四半期 決算説明会資料 (Q3 FY12/2026 earnings briefing materials), dated 2026/11/6, with the Tokai Carbon Co., Ltd. (東海カーボン株式会社) logo.
Centered title block on white with diagonal red gradient bands across the top-left and bottom-right corners; company logo below the date.
Two sections: Q3 FY2026 results overview (pages 3–13) and reference materials (pages 14–17).
Minimal white slide with a centered heading (目次) and two left-aligned entries with right-aligned page ranges.
Section opener for the results summary (決算概要) of the third quarter of the fiscal year ending December 2026.
White slide with left-aligned small subtitle and large bold heading, red diagonal band along the bottom.
KPI dashboard and topics. Net sales ¥273.6 billion (2,736億円, +15.3%), driven by consolidation of the Bridgestone-group carbon black subsidiary in Thailand and a large rise in SiC product volumes for memory semiconductors, partly offset by tire customers' production cuts and the sale of the German graphite electrode subsidiary. Operating profit ¥27.5 billion (275億円, +32.0%), helped by smelting & lining license income, higher industrial furnace revenue, graphite electrode restructuring and the US market reversal, offset by higher depreciation from the new Thai carbon black plant. EBITDA ¥55.2 billion (552億円, +26.0%), EBITDA margin 20.2% (+1.7pt). FCF ¥15.5 billion (155億円, +203億円) as large capex ran its course and cross-shareholdings were sold. Adjusted net D/E 0.22x. Credit ratings JCR A+ and R&I A, both with stable outlook. Topics: memory semiconductor and MLCC markets stay strong (solid SiC focus ring volumes growing on NAND moving beyond 300 layers and DRAM moving to the early 10nm class; MLCC capacity investment driving industrial furnace orders and heating element demand); US graphite electrode prices turned up from Q3, supported by US reciprocal tariffs and anti-dumping duties on Indian electrodes; full production and shipment of aluminum smelting cathodes for Middle East special demand, and RuC (Ready-to-use Cathode) assembly at a Chinese smelter on track with further lining license income expected; share price hit an all-time high at one point and price-to-book stayed above 1x. Footnote: 2025 figures were retrospectively revised after finalizing provisional purchase accounting for KBR, Inc. and MWI, Inc.
Two-column layout: left half is a grid of grey KPI tiles (sales, operating profit, EBITDA, EBITDA margin, FCF, adjusted net D/E, credit ratings) with large numbers and plus/minus driver notes; right half is a 'Topics' panel with three red-headed themes and bullet text.
Headline: double-digit growth in net sales, operating profit, ordinary profit and EBITDA; EBITDA margin held at the long-term vision target of 20% thanks to structural reform. Table (¥ million, Jan–Sep 2025 vs Jan–Sep 2026): net sales 237,336 → 273,674 (+36,337, +15.3%); operating profit 20,832 → 27,507 (+6,674, +32.0%); ordinary profit 20,592 → 26,148 (+5,555, +27.0%); net income attributable to owners of parent 16,129 → 16,259 (+129, +0.8%); EBITDA 43,864 → 55,261 (+11,397, +26.0%); EBITDA margin 18.5% → 20.2% (+1.7pt). Average FX for January–September: 2025 USD1=¥148.23, EUR1=¥165.54; 2026 USD1=¥158.54, EUR1=¥184.12. EBITDA defined as operating profit + depreciation + goodwill amortization.
Two bold headline bullets above a five-column comparison table with the current period column shaded pink; FX rate box at bottom right and footnotes at bottom left.
Smelting & lining grew profit on license income and Middle East special demand; fine carbon grew on strong focus ring demand; the other main segments also grew, lifting consolidated operating profit 32%. Jan–Sep 2026 vs 2025 (¥ million): carbon black sales 129,366 (+18,440), OP 12,430 (+752), EBITDA 23,197 (+3,903); fine carbon sales 52,391 (+10,314), OP 8,020 (+1,722), EBITDA 15,950 (+2,148); smelting & lining sales 50,588 (+8,991), OP 4,053 (+3,315), EBITDA 7,520 (+3,816); graphite electrodes sales 26,610 (down 1,540), OP 2,168 (+524), EBITDA 6,122 (+759); industrial furnaces sales 8,285 (+1,139), OP 2,153 (+836), EBITDA 2,613 (+989); others sales 6,432 (down 1,009; friction materials 6,244, anode materials and other 187), OP 24, EBITDA 540; adjustments OP down 1,343. Totals: sales 273,674, OP 27,507 (10.1% of sales, +1.3pt), EBITDA 55,261 (20.2%, +1.7pt).
Two headline bullets above a dense nine-column table grouped into sales, operating profit and EBITDA blocks, each with prior period, current period (pink) and change; black triangles mark negatives.
Sales rose despite lower volumes from tire makers' production adjustments, thanks to the new Thai subsidiary consolidated in Q4 2025; profit rose despite higher depreciation from the new Thai plant. Sales ¥110,925 million → ¥129,366 million (+18,440, +16.6%); operating profit ¥11,678 million → ¥12,430 million (+752, +6.4%); ROS 10.5% → 9.6%. Sales bridge: volume +8,366, price +4,014, FX +6,060. Operating profit bridge: volume +1,015, margin +1,215, FX +929, other down 2,407.
Two narrative bullets on top; bottom row has a small results table (sales, OP, ROS) on the left and two waterfall charts (sales bridge, operating profit bridge) on the right.
Solid SiC focus ring unit sales kept expanding on strong memory semiconductor demand, at a record-setting pace, with the order backlog at a historic high. Sales and profit also benefited from a recovering SiC power semiconductor business for China. Sales ¥42,076 million → ¥52,391 million (+10,314, +24.5%); operating profit ¥6,297 million → ¥8,020 million (+1,722, +27.4%); ROS 15.0% → 15.3%. Sales bridge: volume +7,390, price +569, FX +2,355. Operating profit bridge: volume +2,033, margin +326, FX +780, other down 1,417.
Same segment template: narrative bullets, results table, sales and operating profit waterfall charts; purchase-accounting footnote at bottom.
A surge in cathode demand linked to tension in the Middle East led to full production and full shipment from Q3, with higher volumes plus lower unit cost from high utilization (fixed-cost absorption). License fee income from the next-generation low-environmental-impact RuC (Ready-to-Use Cathode) also supported growth. Sales ¥41,596 million → ¥50,588 million (+8,991, +21.6%); operating profit ¥738 million → ¥4,053 million (+3,315, +448.9%); ROS 1.8% → 8.0%. Sales bridge: volume +2,512, price +1,373, FX +5,106. Operating profit bridge: volume +1,034, margin +2,001, FX +375, other down 94.
Segment template with narrative bullets, results table and two waterfall charts; the OP waterfall starts from a small base and climbs steeply.
US electric-arc-furnace steel output was solid and Japan dipped only slightly, but sales fell because the German subsidiary was sold and deconsolidated from Q2 2025. Profit rose on the US price reversal from Q3 and restructuring effects such as exiting the loss-making German unit. Sales ¥28,150 million → ¥26,610 million (down 1,540, down 5.5%); operating profit ¥1,643 million → ¥2,168 million (+524, +31.9%); ROS 5.8% → 8.1%. Sales bridge: volume +1,385, price down 1,606, FX +1,273, other down 2,592. Operating profit bridge: volume down 50, margin +44, FX +150, other +381.
Segment template with narrative bullets, results table and two waterfall charts; negative bars shaded pink.
Industrial furnace orders kept rising with MLCC capacity expansion, and heating element demand for new installations and periodic replacement was solid; the order backlog fills production capacity into next year, so the company is focused on supply and delivery management. Resistor sales for power infrastructure were also firm on global grid investment. Sales ¥7,145 million → ¥8,285 million (+1,139, +16.0%); operating profit ¥1,316 million → ¥2,153 million (+836, +63.6%); ROS 18.4% → 26.0%. Sales bridge: volume +204, price +551, FX +384. Operating profit bridge: volume +599, margin +193, FX +89, other down 45.
Segment template with narrative bullets, results table and two waterfall charts.
Main cash flow items (¥ million, Jan–Sep 2025 vs 2026). Operating cash flow 34,247 → 35,818: pre-tax profit 25,639 → 28,323; depreciation 19,696 → 24,371; goodwill amortization 3,334 → 3,382; receivables 1,232 → down 10,284; inventories down 224 → down 7,508; payables down 2,570 → +4,126 (working capital outflow ¥13.6 billion (136億円) vs ¥1.5 billion a year earlier); taxes paid and other down 12,860 → down 6,592. Investing cash flow down 39,048 → down 20,286, with capex down 33,790 → down 20,730; free cash flow +¥15.5 billion (155億円) vs minus ¥4.8 billion a year earlier, including ¥3.5 billion from selling cross-shareholdings. Financing cash flow down 4,310 → down 16,197: borrowings incl. CP +8,941 → down 6,239; bonds issued/redeemed 14,787; dividends down 6,404 → down 7,249; share buybacks 0 → down 15,003; subsidiary buybacks down 4,778 → none (prior year: Tokai Carbon Korea buyback; voting stake now 52.6%). Cash at period end 54,193 → 62,660.
Full-width table with indented line items, prior period in grey and current period in pink, and a right-hand commentary column with bracketed notes.
Main balance sheet items (¥ million, end-Dec 2025 vs end-Sep 2026). Total assets 664,033 → 683,561; current assets 258,828 → 277,776 (cash 90,156 → 93,470; notes and receivables 66,781 → 76,846; inventories 93,297 → 100,130); fixed assets 405,204 → 405,784 (PP&E 290,429 → 282,361; intangibles 61,520 → 55,639; investments and other 53,255 → 67,783). Liabilities 311,187 → 327,929 (current 126,726 → 121,708; non-current 184,460 → 206,221). Net assets 352,846 → 355,632 (shareholders' equity 183,111 → 177,156; accumulated other comprehensive income 135,246 → 139,415; non-controlling interests 34,488 → 39,060). Commentary: cash-to-monthly-sales 3.1x (3.3x); inventories +¥6.8 billion; PP&E down ¥8.0 billion; intangibles down ¥5.8 billion; net interest-bearing debt ¥113.2 billion (+¥5.3 billion); interest-bearing debt ¥206.7 billion (+¥8.6 billion); direct financing ratio 63.9% (61.6%), long-term ratio 71.1% (65.6%); short-term credit lines ¥74.0 billion with ¥6.0 billion drawn; CP program ¥60.0 billion with ¥42.0 billion issued; equity ratio 46.3% (47.9%), adjusted 51.4% (53.2%); net D/E 0.36x (0.34x), adjusted 0.22x (0.21x). Adjusted ratios reflect rating-agency equity credit for hybrid financing.
Indented balance sheet table on the left two-thirds with a right-hand commentary column split into asset, liability and equity notes.
Section opener for the appendix (参考資料).
White slide with a bold left-aligned title and red diagonal band at the bottom.
Five-year KPI table (¥ million; 2022 / 2023 / 2024 / 2025 / 2026 forecast). Net sales 340,371 / 363,946 / 350,114 / 322,960 / 386,000. Operating profit 40,588 / 38,728 / 19,386 / 25,850 / 35,000; ROS 11.9% / 10.6% / 5.5% / 8.0% / 9.1%. EBITDA 75,572 / 75,949 / 61,120 / 58,443 / 72,400; EBITDA margin 22.2% / 20.9% / 17.5% / 18.1% / 18.8%. Net income attributable to owners 22,418 / 25,468 / loss of 56,485 / 20,078 / 22,000; ROE 9.0% / 8.6% / n.a. / 6.6% / 6.8%. Adjusted ROIC 14.3% / 11.5% / 6.8% / 5.8% / 5.4%. Capex 48,150 / 53,316 / 56,715 / 36,854 / 43,100. Depreciation 27,460 / 29,065 / 33,028 / 27,700 / 33,300. R&D 3,171 / 3,605 / 4,284 / 4,319 / 5,200. Interest-bearing debt 171,452 / 166,642 / 191,241 / 198,111 / –. Net D/E 0.37 / 0.27 / 0.34 / 0.34 / 0.33; adjusted 0.22 / 0.15 / 0.20 / 0.21 / 0.20. Employees 4,378 / 4,427 / 4,625 / 4,436 / –. FX (JPY/USD) 131.43 / 140.56 / 151.58 / 149.71 / 159.25.
Clean full-width table with alternating pink row shading, years as columns and the forecast year on the far right; definitions in footnotes.
Quarterly sales and operating profit by segment (¥ million) for 2025 Q1–Q4 and 2026 Q1–Q3 plus Q4 forecast. 2026 net sales Q1 81,720 / Q2 92,007 / Q3 99,945 / Q4f 112,325 / full year 386,000 (2025 full year 322,960). Carbon black 38,730 / 44,750 / 45,885 / 51,633 / 181,000; fine carbon 16,401 / 16,614 / 19,375 / 18,308 / 70,700; smelting & lining 14,166 / 16,482 / 19,938 / 24,411 / 75,000; graphite electrodes 7,845 / 9,033 / 9,731 / 9,389 / 36,000; industrial furnaces 2,361 / 3,048 / 2,875 / 6,414 / 14,700; others 2,215 / 2,078 / 2,138 / 2,167 / 8,600. 2026 operating profit Q1 6,345 / Q2 8,756 / Q3 12,405 / Q4f 7,492 / full year 35,000 (2025: 25,850). By segment: carbon black 3,235 / 4,004 / 5,190 / 3,569 / 16,000; fine carbon 2,264 / 2,451 / 3,304 / 2,779 / 10,800; smelting & lining 658 / 1,362 / 2,032 / 546 / 4,600; graphite electrodes 251 / 540 / 1,376 / 731 / 2,900; industrial furnaces 327 / 886 / 940 / 846 / 3,000; others 126 / down 62 / down 39 / 175 / 200; adjustments down 518 / down 426 / down 399 / down 1,156 / down 2,500. Q3 2026 operating profit of ¥12,405 million was the highest quarter shown.
Wide table with grey 2025 block and red 2026 block, each split into quarters plus a full-year column; sales rows on top, operating profit rows below.
Forward-looking statements are based on information available at the date of release and assumptions about uncertain factors; actual results may differ materially due to economic conditions, raw material prices, supply-demand and market conditions, and exchange rates, among others. Numerical targets, reference values and investment amounts express the vision and medium-term strategy and are not earnings forecasts; the company has no obligation to update them. Official forecasts are those disclosed in the kessan tanshin under Tokyo Stock Exchange rules. IR contact: Corporate Planning Department, TC-IR.new@tokaicarbon.co.jp.
Bordered text box with four square-bullet disclaimer paragraphs and a smaller bordered contact box underneath.
Back cover with the Tokai Carbon logo, the tagline 'Building a Future of Technology and Trust' and the name TOKAI CARBON CO., LTD.
Centered logo and wordmark on white, framed by thin red gradient bars at top and bottom.
關於此幻燈片和基礎簡報內容的常見問題。
The original deck is in Japanese (決算説明会資料, earnings briefing materials) and was published on TDnet, the Tokyo Stock Exchange timely disclosure system, on November 6, 2026 under securities code 5301. The page-by-page analysis on this page is written in English, with yen amounts kept in the company's own units (百万円 = ¥ million, 億円 = ¥100 million).
Tokai Carbon uses a December fiscal year, so FY2026 runs January–December 2026. The Q3 figures in this deck are nine-month cumulative results for January–September 2026, with the July–September quarter broken out on the quarterly segment page.
Net sales were ¥273,674 million (+15.3%), operating profit ¥27,507 million (+32.0%), ordinary profit ¥26,148 million (+27.0%), net income attributable to owners ¥16,259 million (+0.8%) and EBITDA ¥55,261 million (+26.0%), for an EBITDA margin of 20.2%.
Smelting & lining had the largest operating profit increase, up ¥3,315 million to ¥4,053 million on full cathode production for Middle East demand and RuC license income. Fine carbon added ¥1,722 million on solid SiC focus rings for memory chips, and industrial furnaces added ¥836 million on MLCC-related orders.
The appendix shows a FY2026 forecast of ¥386,000 million net sales, ¥35,000 million operating profit, ¥72,400 million EBITDA (18.8% margin) and ¥22,000 million net income attributable to owners, with an assumed rate of ¥159.25 per US dollar.
Through the fine carbon segment, which sells solid SiC focus rings and graphite parts used in semiconductor etch equipment, and through industrial furnaces and heating elements used to make MLCCs. The deck links focus ring demand to NAND moving past 300 layers and DRAM moving to the early 10nm class, and reports a record-high focus ring order backlog.
Graphite electrode sales fell 5.5% to ¥26,610 million because the German subsidiary was deconsolidated, but operating profit rose 31.9% to ¥2,168 million as US prices turned up from Q3, helped by US tariffs and anti-dumping duties on Indian electrodes, and as restructuring took effect.
Yes. The gallery page provides the original PDF and an editable PPTX conversion, so you can reuse layouts such as the KPI dashboard, segment tables and sales and operating profit waterfall bridges for your own earnings presentations.
Original Japanese-language filing on the TSE timely disclosure system, November 6, 2026.

Create Your Own Slides
Turn your ideas into professional presentations in seconds with 2slides AI.
參考專業設計,選擇您的風格,產生具有完美文字渲染的投影片。由 Nano Banana 提供支援—立即開始建立您的簡報。


