
Strategy (formerly MicroStrategy) Q2 2026 Financial Results — an 86-page earnings presentation delivered July 30, 2026, covering quarterly financials, the company's 843,775 BTC treasury, its Digital Credit Capital Framework, and the STRC preferred security
快速導航
標籤
分享幻燈片
Strategy (formerly MicroStrategy) Q2 2026 Financial Results — an 86-page earnings presentation delivered July 30, 2026, covering quarterly financials, the company's 843,775 BTC treasury, its Digital Credit Capital Framework, and the STRC preferred security
每張幻燈片頁面的詳細視圖,包括版面、關鍵內容和視覺元素。
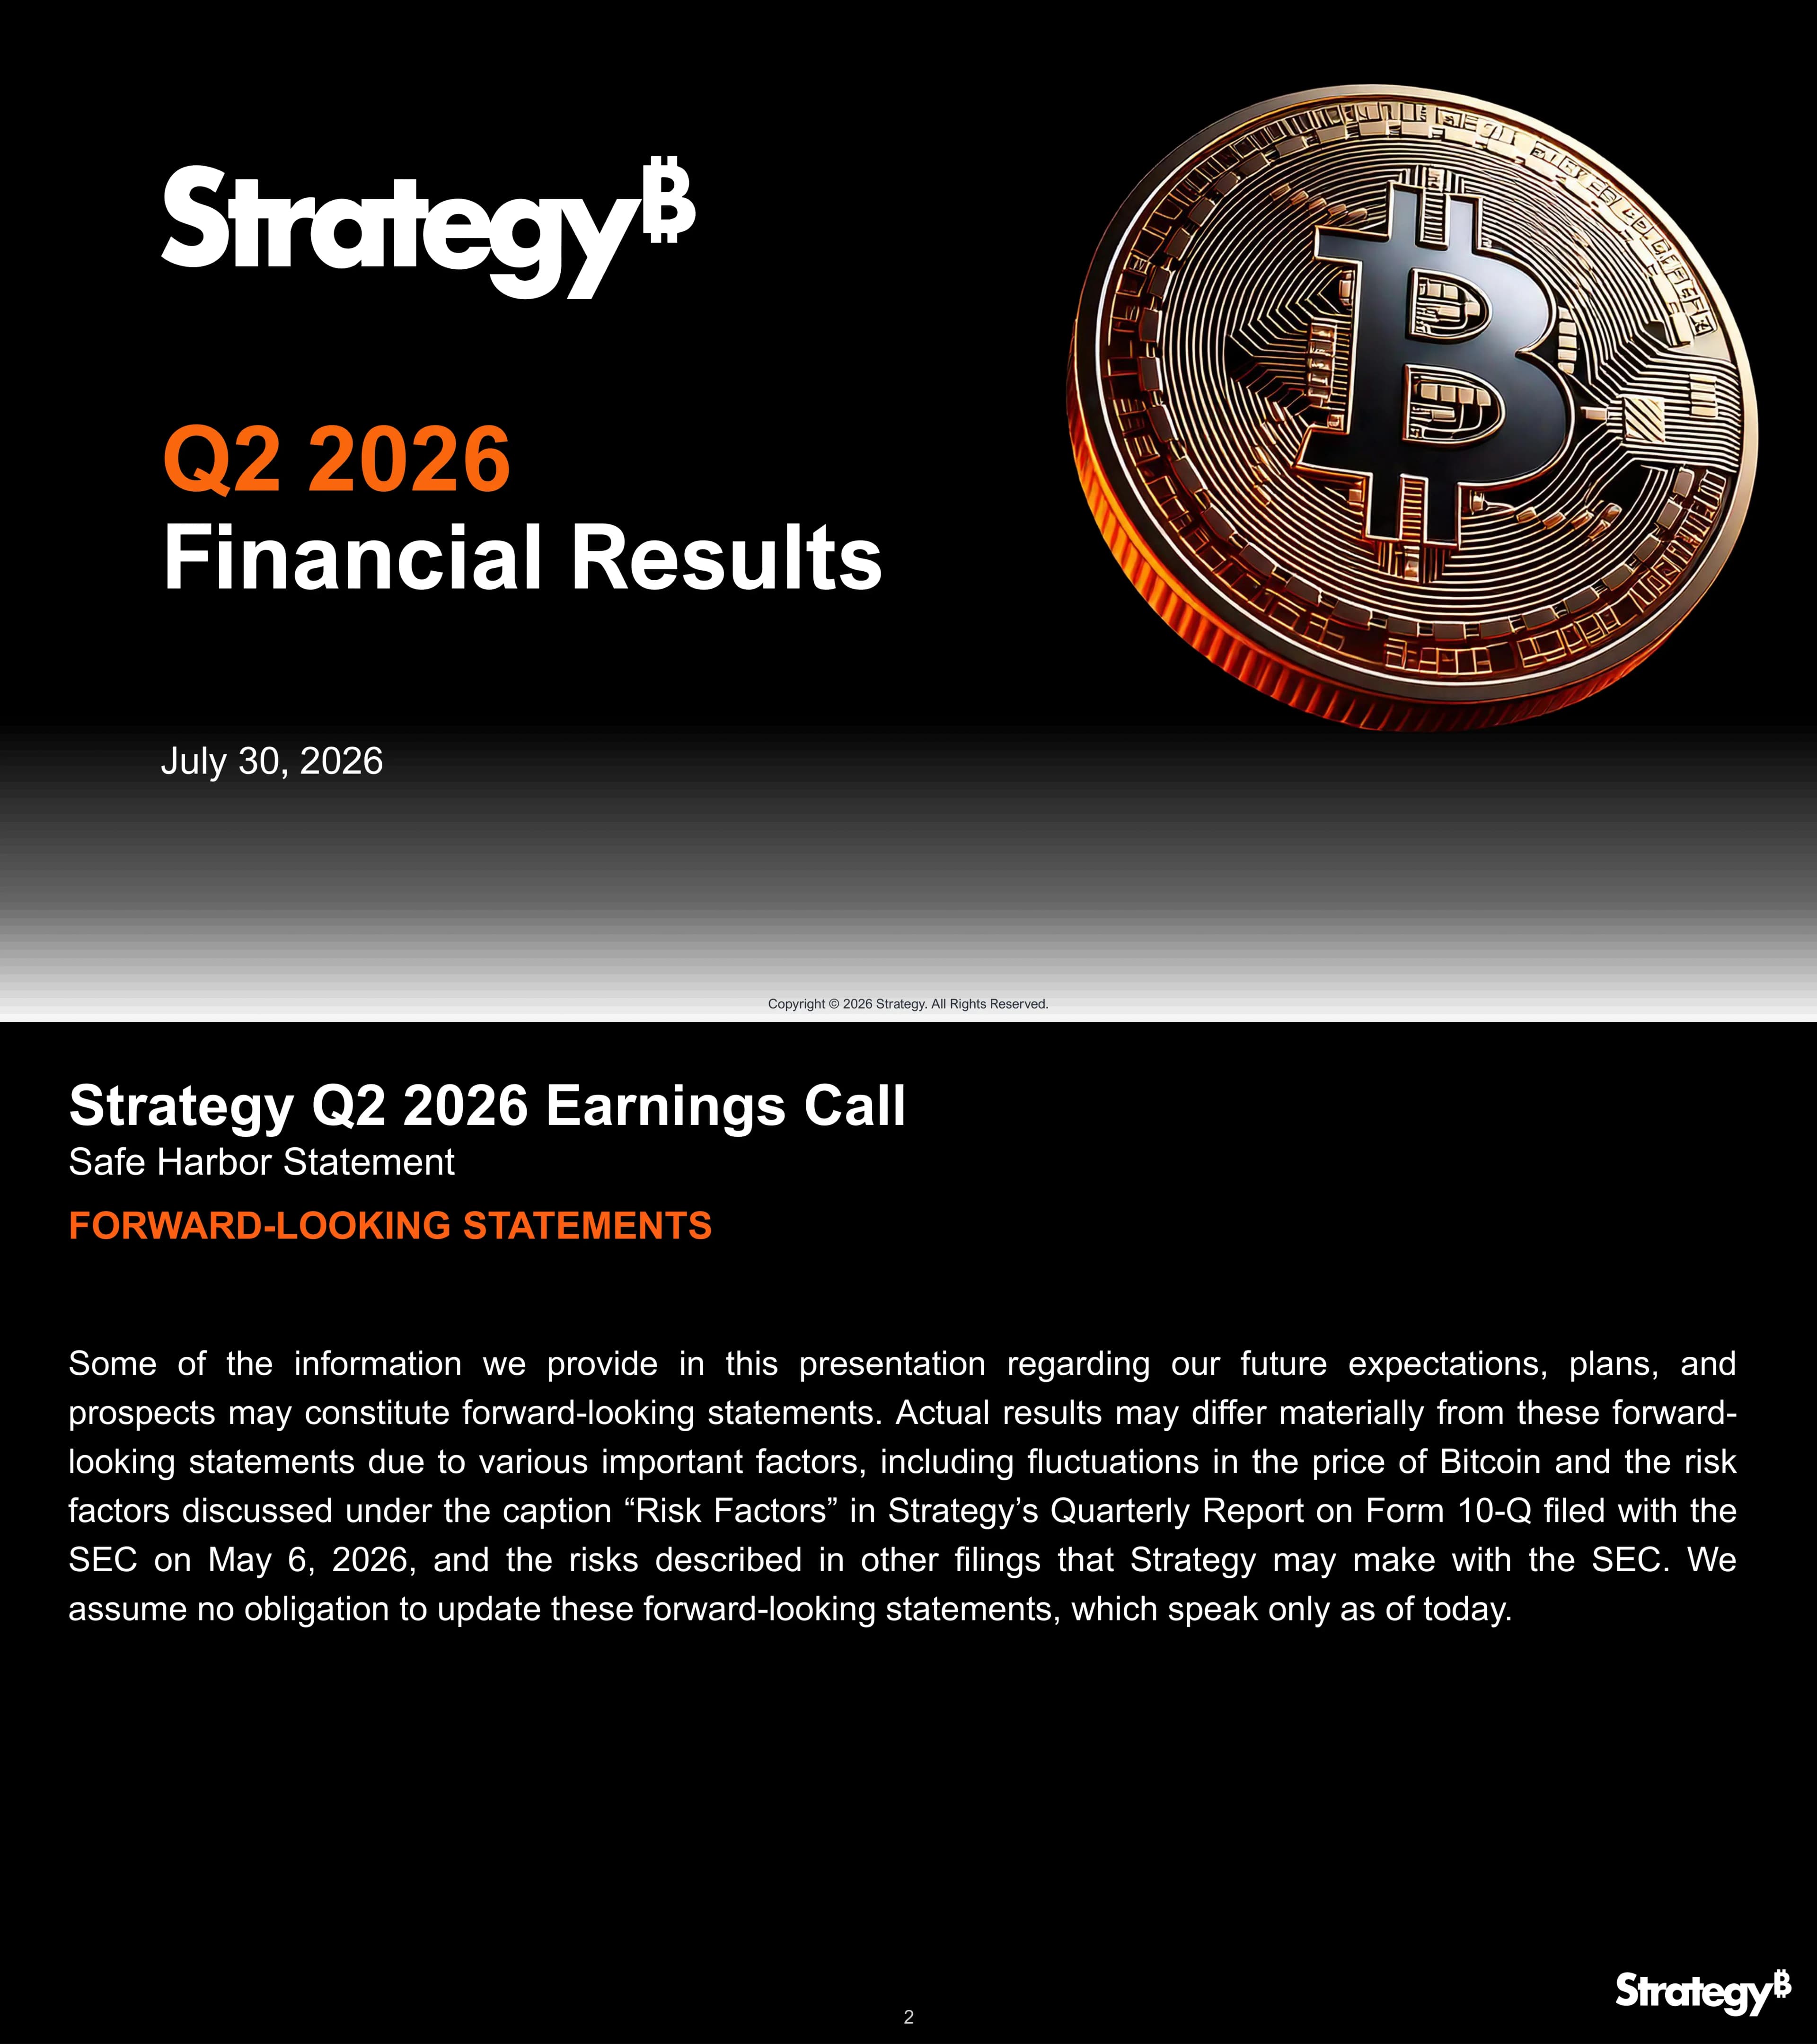
Title slide dated July 30, 2026, naming the quarter and the report type over a black field with the Strategy wordmark.
Full-bleed black cover; date line above a two-line title set flush left; copyright footer.
Forward-looking statement disclaimer noting that results may differ materially due to bitcoin price fluctuations and the risk factors in SEC filings.
Single dense text block under a bold heading; no graphics.
Section divider introducing the CFO and the financial results portion of the call.
Full-bleed divider: section title large, speaker name and title beneath.
Four headline figures: 843,775 bitcoin held (~4% of all BTC ever to exist), 203,683 sats per share, $38B market cap, and $17B raised year to date.
Four-up stat grid, each cell a large figure over a short label.
Column chart of quarterly bitcoin holdings from 38,000 to 843,775 BTC, with callouts for $55B BTC Reserve, $75K average purchase price and $64B total acquisition cost.
Wide ascending bar chart across the page bottom with a four-stat callout strip on the right.
Ranked comparison placing Strategy's 843,775 BTC ahead of IBIT, the United States, China, FBTC, GBTC, WBTC, Tether, cbBTC and BTCB.
Descending bar ranking with category bands for Strategy, ETFs, countries and DeFi.
Two-column balance sheet comparing 3/31 and 6/30: digital assets $51.6B to $49.7B, long-term debt $8.2B to $6.7B, preferred equity $9.0B to $14.4B.
Line-item table with two date columns and right-margin annotation callouts.
Waterfall bridging $51.6B at 3/31 to $49.7B at 6/30 through a -$6.9B price change, +$6.3B net purchases and a -$1.4B price change on those purchases.
Five-bar waterfall with a bitcoin count and market price strip beneath.
Mirror waterfall for quarter-to-date Q3: $49.7B to $54.8B via $135M of sale proceeds and a $5.2B fair-value gain as bitcoin moved from $58,714 to $64,900.
Four-bar waterfall matching the previous page's grid exactly.
Reserve of $58.5B against $36.3B net reserve, $15.4B preferred equity and $6.7B convertible debt, producing 5.4% net leverage and 1.51x amplification.
Four stacked bars on the left, two ratio callouts on the right.
Side-by-side of the current balance sheet at a $65K bitcoin price (18.5x BTC Rating) against a 95% price decline to $4K, where the rating still holds at 1.0x.
Two panels, each a paired bar of BTC Reserve against net debt, with a rating figure below.
Five-quarter table of operating income, net income and EPS, showing the swing from $14.0B operating income in Q2 2025 to $(8.3)B in Q2 2026 and EPS of $(24.45)/sh.
Three-row, five-column table with prior-year and prior-quarter columns labeled.
Three paired comparisons: BTC Yield 4.5% YTD versus 22.8% FY25, BTC Gain ₿29,997 versus ₿101,873, and BTC $ Gain $1.9B versus $8.9B.
Three side-by-side mini-charts across one row with a shared YoY sats-per-share callout.
Annual progression of bitcoin per share from 56,598 sats in 2020 to 203,683 sats as of July 26, 2026.
Seven-column ascending bar chart with year axis.
Quarterly detail of the same metric: 194,986 at 12/31/2025, 201,170 at 3/31/2026, 210,824 at 6/30/2026.
Three-bar chart at large scale, same styling as the annual view.
Analyst table listing firm, bitcoin price target, MSTR price target, rating and as-of date for Barclays, Benchmark, Bernstein, B.Riley, BTIG, Canaccord, Cantor and others.
Multi-column table sorted by firm, with paired price-target columns.
Section divider introducing the President and CEO and the capital markets portion of the call.
Full-bleed divider matching page 3.
Four-row quarter-over-quarter table: BTC holdings +11%, debt outstanding -18%, USD reserve +12%, bitcoin per share +5%.
Table with two date columns and a percentage-change column.
Conceptual map of capital pathways — selling MSTR to buy BTC or USD, selling BTC to buy debt or preferreds, and the reverse flows.
Flow diagram with paired action tiles arranged around a central axis.
Two paired bars: ₿174,895 purchased against ₿3,620 sold year to date, and $7,520M of STRC issued against $25M repurchased.
Two half-page panels, each a purchase bar against a much smaller sale bar.
Three-year stacked view of capital raised by instrument — $17.0B YTD 2026, $22.6B FY2025, $25.3B FY2024 — split across common equity, preferred equity and convertible debt.
Three stacked columns with percentage splits labeled inside each segment.
Seven-quarter stacked series from Q1 2025 to Q3 2026 QTD showing the mix shift toward preferred equity.
Stacked column chart with per-segment dollar labels.
Three-step value loop — sell digital credit, generate amplification, outperform bitcoin — flanked by three levers: lower cost of credit, higher digital credit sales, higher mNAV.
Numbered three-step cycle on the left, lever list on the right.
Section divider opening the capital framework segment.
Full-bleed divider, title only.
Single-statement page: the corporate objective is for STRC to trade at $99–$100 over time.
Centered statement page with no supporting graphics.
Five pillars: USD Reserve $3.75B, BTC Monetization, Digital Credit Repurchase $1.0B, MSTR Repurchase $1.0B, and a 12.00% STRC dividend reviewed monthly.
Five-column pillar layout, each with a headline figure and a qualifying line.
Dual-axis chart tracking the USD reserve to $3.75B and its duration to 2.1 years, against a stated one-year minimum coverage.
Area chart with a secondary duration line and date callouts along the series.
Three stated purposes for selling bitcoin: fund the USD reserve up to $1.25B, fund dividend and interest payments of $1.76B annually, and fund repurchase programs capped at $2.00B.
Headline statement above a numbered three-item list.
Line-by-line record of two sales — ₿32 on July 5 to inoculate the market and ₿3,588 on May 31 to fund preferred dividends — with cost basis, sale price, proceeds, realized loss and potential tax asset.
Seven-column transaction table with holdings context on the left.
Distribution of holdings across six price bands from $0–20K to $100K+, with $5.5B unrealized gain, $18.5B unrealized loss and $5.4B potential tax benefit at a $60K sale price.
Six-column histogram with average price and cost basis beneath each band.
Two-row table showing each sale as 0.001% and 0.104% of weekly bitcoin liquidity, with price change in the week of and week after each sale.
Compact table with four measurement columns.
Compares $26B of daily bitcoin liquidity against a $363M max weekly purchase, $56M LTM net purchase, $19M max weekly sale and $5M dividend obligations — all under 1.5% of average daily volume.
Five descending bars with percentage-of-volume labels beneath.
Side-by-side comparison of the $1B Digital Securities repurchase program and the $1B MSTR common repurchase program — market cap, authorization, trigger condition and rationale.
Two-column comparison table with a shared row spine.
Two operating modes — Climb (trading below par) and Cruise (steady growth) — each with its own set of levers from adjusting the USD reserve to managing capital markets policy.
Two-column playbook, each column a stacked list of levers under a mode heading.
Five input signals — trading levels, market yields, BTC market, USD reserve coverage and capital structure — feeding the dividend rate decision, held at 12.00% until STRC returns to health.
Five signal tiles in a row with the rate policy stated beneath.
Five numbered principles covering long-term MSTR value via BPS, growing STRC demand, reducing convertible debt, sizing the USD reserve, and adjusting amplification.
Numbered five-item grid, two rows.
Section divider introducing the Founder and Executive Chairman.
Full-bleed divider matching pages 3 and 17.
Sub-section divider opening the digital capital narrative.
Full-bleed divider, title only.
Screenshot-led page pointing to the refreshed public bitcoin metrics dashboard.
Headline over a full-width product screenshot.
Decade-long price line against its 200-week moving average, with bitcoin at a 1% premium and 92% of history spent above the current premium.
Full-width dual-line time series from 2016 to 2026 with a premium callout.
Five named macro pressures — AI capital expansion, trade tensions, Gulf War disruption, restrictive Fed policy, delays in regulatory clarity — framed as potential future catalysts.
Five stacked labels with a single interpretive line beneath.
Bitcoin price overlaid with the Fear and Greed Index from July 2025 to July 2026, with the index at 29 in Fear territory.
Dual-axis chart, price line over an index area series.
Bitcoin's share of total crypto market cap rising from 47% in November 2021 to 67% in 2026.
Single ascending line chart with endpoint annotation.
Adoption scores across the 25 leading global banks rising from 14% in December 2024 (spot ETFs) to 24% in December 2025 (stablecoins and digital credit) to 32% in July 2026 (tokenization).
Three milestone columns, each with a percentage and an era label.
Introduces a consortium of industry leaders committed to funding and supporting long-term bitcoin protocol security.
Statement page with a descriptive paragraph beneath the title.
Sub-section divider opening the digital credit narrative.
Full-bleed divider, title only.
Three stated focus areas for STRC: increasing liquidity, building an ecosystem of market participants, and decreasing volatility.
Three-column focus tiles under a single headline.
Four-quarter growth of STRC notional value from $2.8B at 9/30/2025 to $10.5B at 6/30/2026.
Four-column ascending bar chart with value labels.
Ranks STRC's 21.6% tax-equivalent yield and 13.6% effective yield against private credit, bank preferreds, junk bonds, investment grade, MBS, T-bills, commercial paper, money markets and bank accounts.
Eleven-column descending bar ranking with STRC occupying the first two positions.
Holdings tables showing STRC as the top position in the iShares Preferred and Income Securities ETF at 3.56% weight, ahead of Boeing, Wells Fargo and Alphabet preferreds.
Two side-by-side ETF holdings tables with company, ticker, market value and weight columns.
Maps STRC to five investor classes: institutional credit, retail, corporate treasuries, digital money and crypto native, and hybrid and equity investors.
Five audience tiles arranged around a central STRC label.
Broadridge data showing notional value outstanding growing from $5.0B to $10.5B, with the retail/institutional split moving from 29/71 to 22/78 and average account size rising for both.
Two paired bar charts side by side, each with a percentage split bar beneath.
Overlays the current recovery path against the post-IPO recovery, both tracking toward the $100 par objective.
Dual-line chart indexed on trading days with milestone date annotations.
Sets $10.5B of STRC notional and $9.2B market cap against a $1.2B dislocation, a $975M remaining repurchase authorization and a $58.5B reserve — the dislocation being 2% of the BTC reserve.
Five descending value bars with the repurchase context stated beneath.
Product page introducing the public credit tab and defining BTC Floor ARR as the lowest constant bitcoin return maintaining 1.0x coverage of net debt and preferreds.
Headline over a product screenshot with the definition as a footnote block.
Instrument-by-instrument table of convertible notes from 2028 through 2032 with notional, cumulative notional, duration, BTC Rating, BTC Risk, BTC Credit, market credit spread and spread premium.
Eight-column table grouped by instrument type.
Continuation of the capital structure table extending through the preferred instruments.
Same eight-column table grid continued.
STRC instrument summary — 13.6% effective yield, $58.5B of reserves at a 3.7x BTC Rating, -11.5% BTC Floor ARR and $251M average 30-day trading volume.
Four-stat instrument card with a disclosure block beneath.
Sub-section divider opening the equity narrative.
Full-bleed divider, title only.
Three stacked scenarios keyed to a -11.8% Floor ARR: both equity and credit thrive; equity may underperform bitcoin while dividends stay covered; equity underperforms while credit may perform.
Three stacked regime bands, each with a heading and an explanatory line.
Three investor lenses: bitcoin at a 0.6% premium to its 200-week moving average, digital credit yielding an 8.7% premium, and MSTR at a 5.5% premium to Net BPS.
Three-column investor tiles, each with a premium figure.
Bridges $58.5B of reserves less $36.3B of debt and preferreds to $2.0B of net reserves premium against a $38.3B fully diluted market cap, implying the credit business is valued at $2.0B.
Five-bar waterfall with the implied valuation called out.
Share of rolling windows in which MSTR outperformed bitcoin, rising from 47% at one month to 100% at four years, with window counts shown.
Seven ascending columns by holding period with a window-count row beneath.
Annualized performance since August 10, 2020: MSTR 42%, bitcoin 32%, Magnificent 7 23%, S&P 500 14%, gold 12%, real estate 8%, money 3%, bonds -4%, with total performance figures beneath.
Eight descending bars with a secondary total-performance row.
Four pillars: capital ($55B BTC, $3.75B USD, WKSI status), technology (35+ years of leadership), brand, and network.
Four-row pillar list, each with a label and a supporting line.
Three-part ambition — own the most capital (BTC), issue the strongest credit (STRC), create the best equity (MSTR) — with targets of 10-20% of reserves sold as digital credit annually, doubling BPS in seven years and 30% BTC ARR.
Three-column ambition tiles with target annotations beneath each.
Nine numbered principles from buying and holding bitcoin indefinitely through issuing innovative fixed income securities and promoting global adoption.
Nine numbered items in a multi-column grid.
Q&A divider naming the four participants: Michael Saylor, Phong Le, Andrew Kang and CJ (Chaitanya Jain).
Full-bleed divider with the participant list beneath the title.
Closing slide.
Full-bleed closing page, title only.
Appendix divider.
Full-bleed divider, title only.
Subscription services revenue growing from $40.8M to $62.9M across five quarters (+54% YoY), within $122.4M total revenue split 51% subscription services, 33% support, 13% other services, 3% product licenses.
Bar chart on the left, revenue mix donut on the right.
Explains why Strategy expects US return-of-capital treatment for ten years or more, producing tax-deferred dividends on the basis of negative tax earnings and profits.
Bulleted explanation block under a two-line heading.
Full share count reconciliation across nine dates from 12/31/2020 to 7/26/2026, walking Class A and Class B shares through every convertible tranche, STRK converts, options and unvested RSU/PSUs to 414,259 ADSO and 388,648 FDSO.
Dense reconciliation table, ten columns by roughly sixteen rows, with a four-item footnote block.
Defines Bitcoin Per Share in Sats, Assumed Diluted Shares Outstanding, Basic Shares Outstanding, Satoshi, BTC Yield, BTC Gain and BTC $ Gain.
Nested bullet hierarchy across a full text page.
Explains why the KPIs are used, how measurement periods nest inside reference periods, a worked BPS example, and the limitations management accounts for.
Continuous prose with bulleted limitation list.
States what the KPIs are not — not performance, valuation or liquidity measures — and explains the ASU 2023-08 fair value accounting that can decouple reported results from the KPIs.
Bulleted disclaimers followed by prose paragraphs.
Covers the effect of capital source on the KPIs, what happens if convertibles mature unconverted, perpetual preferred dividend obligations, and that past performance is not indicative of future results.
Continuous prose paragraphs, no graphics.
Documents the January 1, 2026 methodology change for BTC Yield, BTC Gain and BTC $ Gain — the nature of the change, the reason, the effect on previously reported figures, and how to read the new numbers.
Italicized sub-headings introducing each prose block.
Defines mNAV as market price per share divided by Net Bitcoin Per Share in USD, then defines Net BTC, Net BTC ($) and Fully Diluted Shares Outstanding.
Nested bullets with a three-level deduction list for Net BTC.
Explains accretion and dilution when mNAV is above or below one, what Net BPS measures relative to gross BPS, and how BPS ($) restates the metric in dollars.
Continuous prose paragraphs.
Lists the assumptions behind Net BPS — notional rather than liquidation amounts, in-the-money determination by market price, FX conversion timing, funding order — and states what the metrics are not.
Two bulleted blocks separated by prose.
Defines Amplification as BTC Reserve divided by Net Reserve, explains why it is generally above one and how bitcoin price moves it, then defines BTC Reserve, Net Reserve and USD Reserve.
Definition bullets interleaved with explanatory prose.
Defines BTC $ Income, BTC $ Value, BTC $ Equity, BTC Torque and BTC Multiple, then Tax-Equivalent Yield with its four stated assumptions including a 37% marginal rate.
Italic category headings above bold-term definition lines.
Defines BTC Rating, BTC Risk, MSTR Risk, BTC Credit, MSTR Credit, Duration, Macaulay Duration, MSTR Duration, Stochastic Duration, Effective Yield, Risk-Free Rate, BSE Annualized Return, historical volatility and Sharpe measures.
Fourteen consecutive bold-term definition lines.
Defines BTC ARR, BTC Volatility, BTC Price, BTC Capital, BTC Spread, BTC Reserve, BTC Factor, ADSO Market Cap, Equity Component %, BTC Breakeven ARR, BTC Floor ARR and BTC Hurdle ARR.
Three italic category groups, each with bold-term definition lines.
Final legal page stating that Strategy is not a registered money market fund, not an ETP or ETF, and that the material is informational only and not investment, tax, legal or accounting advice.
Three separated prose blocks with generous leading.
關於此幻燈片和基礎簡報內容的常見問題。
It is Strategy's (formerly MicroStrategy) Q2 2026 earnings presentation from July 30, 2026. Pages 1–16 are financial results presented by the CFO, 17–36 are capital markets strategy from the CEO, 37–67 are the digital products and business model narrative from the founder, 68–70 close the call, and 71–86 are an appendix of software results plus fourteen pages of KPI definitions and legal qualifications.
Yes — the reusable parts are structural, not thematic. The waterfall bridges on pages 8, 9 and 62, the five-quarter results table on page 12, the capital-raised stacked columns on pages 21 and 22, and the definition appendix pattern all transfer directly to any earnings deck. Strip the bitcoin specifics and you still have a complete quarterly reporting skeleton.
Directly. Page 12 states operating income of $(8.3)B, net income of $(8.6)B and EPS of $(24.45)/sh in a plain five-quarter table with no softening. The explanation comes before and after it — page 8 bridges the $2.0B decline in asset value, page 9 shows the $5.1B recovery quarter-to-date. That ordering is worth copying: put the number where people look for it, then spend pages explaining it.
Because the body relies on metrics that do not exist in standard accounting — Bitcoin Per Share in Sats, BTC Yield, Amplification, BTC Rating, BTC Floor ARR, mNAV. Pages 74–85 define each one, state what it is not, and disclose a methodology change effective January 1, 2026. If your deck coins its own metrics, this is the pattern that keeps it defensible.
A pure black ground with white Helvetica-style headings, amber reserved almost exclusively for bitcoin figures, and section dividers that run full-bleed with the speaker's name. It holds up across 86 pages because the chart grammar stays consistent — the same waterfall grid, the same descending bar ranking, the same four-up stat block reused rather than reinvented.
Page 8 and 9 for the paired waterfall; page 11 for the stress-test panel that runs a 95% price decline in public; page 49 for the yield comparison ranking; page 64 for the multi-asset performance bar chart; and page 73 for a share-count reconciliation table that manages ten columns without becoming unreadable.
Yes. The original PDF is the source of every page image shown here, and a converted PPTX is attached so you can open the layouts, lift a chart grid, or rebuild a page in your own brand colors.
Strategy's investor relations site hosts the original presentation and the accompanying 8-K and 10-Q filings, and the SEC's EDGAR database carries the same filings. Both are linked in the sources below. Several figures in the deck are stated as of the 8-K filed July 27, 2026, which is the right document to check them against.
Primary source for the original Q2 2026 earnings presentation, press release and webcast.
The 8-K and 10-Q filings the deck repeatedly cites, including the 8-K filed July 27, 2026.

Create Your Own Slides
Turn your ideas into professional presentations in seconds with 2slides AI.
參考專業設計,選擇您的風格,產生具有完美文字渲染的投影片。由 Nano Banana 提供支援—立即開始建立您的簡報。
Your AI Agent for slides. Save time, shine faster with intelligent presentation creation.




© 2026 2slides. All rights reserved.