
所屬合集: 顧問公司簡報範例
PwC Megatrends: Five global shifts reshaping the world we live in (November 2025 edition) — a 31-page consulting research report deck published by PwC that updates the firm's long-running Megatrends framework: Climate change, Technological disruption, Demographic shifts, Fracturing world and Social instability.
以這份簡報的封面作為風格參考,用您自己的內容產生幻燈片。 也可以在下方任選一頁,以它的版面作為參考。
快速導航
標籤
分享幻燈片
PwC Megatrends: Five global shifts reshaping the world we live in (November 2025 edition) — a 31-page consulting research report deck published by PwC that updates the firm's long-running Megatrends framework: Climate change, Technological disruption, Demographic shifts, Fracturing world and Social instability.
每張幻燈片頁面的詳細視圖,包括版面、關鍵內容和視覺元素。
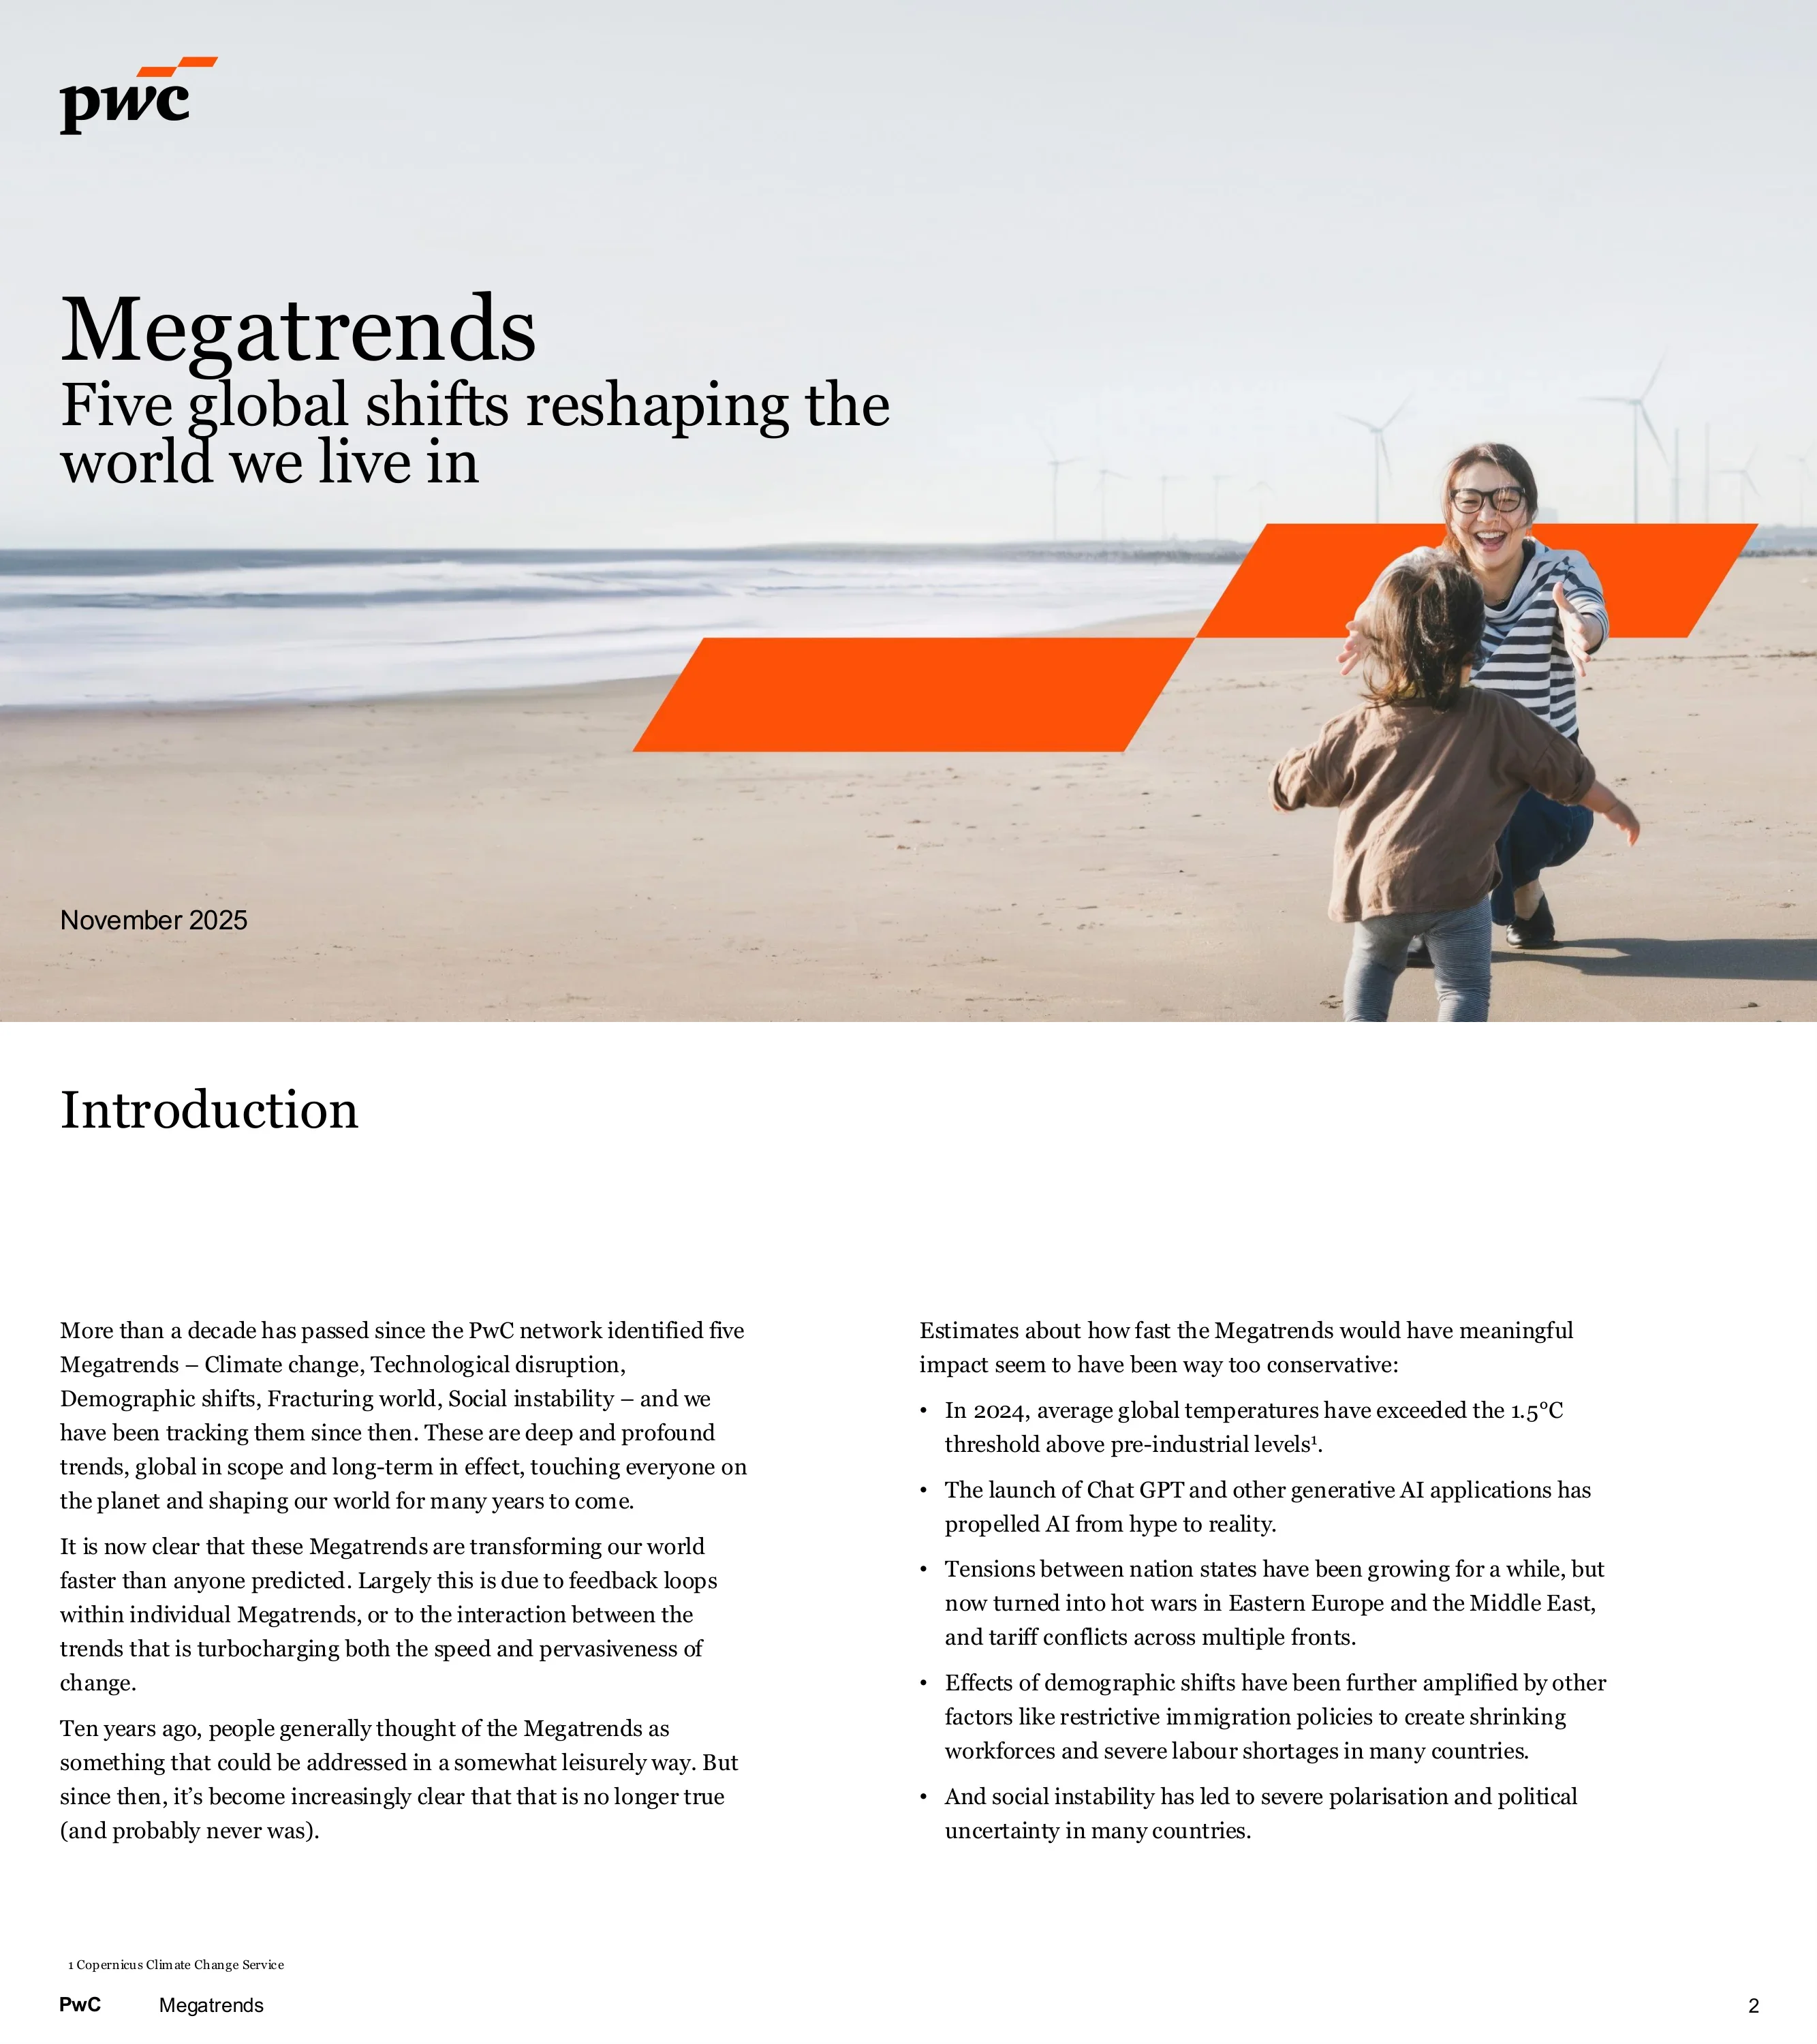
Cover slide for PwC's Megatrends report dated November 2025, showing a mother and child on a beach with wind turbines in the background.
Full-bleed photograph with PwC logo top-left, large serif title and subtitle on the left, date bottom-left, and two overlapping tangerine parallelogram brand shapes across the image.
Explains that the PwC network identified five Megatrends more than a decade ago (Climate change, Technological disruption, Demographic shifts, Fracturing world, Social instability) and that they are moving faster than predicted: in 2024 average global temperatures exceeded the 1.5°C threshold above pre-industrial levels (Copernicus); ChatGPT and generative AI moved AI from hype to reality; tensions turned into hot wars in Eastern Europe and the Middle East plus tariff conflicts; restrictive immigration amplified labour shortages; and social instability drove polarisation.
Serif title top-left, two-column body text with a bulleted list of five evidence points in the right column and a footnote at the bottom.
Argues the Megatrends are now felt as a stream of short-term crises (wars in Ukraine, Gaza and Sudan; tariff conflicts; Europe's energy costs; strained US power grids; semiconductor supply; the UK NHS crisis; wildfires; record heat waves in India; cost-of-living crisis; housing bubbles in Australia and New Zealand) and that governments, businesses and individuals must address short-term and long-term together and reinvent what they do.
Text-only two-column page continuing the introduction without a headline.
Agenda listing six sections: 1 Climate change, 2 Technological disruption, 3 Demographic shifts, 4 Fracturing world, 5 Social instability, 6 In closing.
Peach background with a large 'Contents' title bottom-left and a numbered list on the right; orange numerals and a line icon for each megatrend.
Section divider opening the climate change chapter.
Peach background with an oversized orange numeral '1' top-right and serif section title bottom-left.
States that while humanity tries to reduce carbon emissions, greenhouse gas levels are worsening, temperatures are rising and extreme weather is becoming more frequent and severe. Existential question: What will it take to solve the climate crisis before the damage is irreparable?
Left column with icon, chapter title, bold thesis statement and orange 'Existential question' label; right two-thirds filled by a photo with a notched corner.
Narrative says temperatures are expected to consistently reach 1.5°C above pre-industrial levels in the first half of the 2030s (IPCC 2023), that the transition will be disorderly, and that corporations will race for critical resources such as lithium and cobalt. Three charts: 'Temperature rise has been accelerating' (monthly global surface temperature anomaly by decade, with 2024-2025 running around 1.5°C and above, Copernicus/ECMWF ERA5); 'Rising sea levels endanger major cities and countries' listing cities expected to be at least partially submerged by 2030 without coastal defences (Amsterdam, Bangkok, Basra, Ho Chi Minh City, New Orleans, Venice) plus an IPCC SSP sea-level projection to 2100; and 'By 2050, an additional 1 billion people are expected to live with extremely high water stress' (WRI Aqueduct 4.0 world map).
Two-column narrative across the top; bottom row of three charts, each with an orange action title, a serif subtitle and a source note.
Organisations: business failure, resource insecurity and cost increase, supply chain disruption, job creation through climate tech investment. Governments: looming financial catastrophe, threat to food security and agricultural exports, mass migration, new economic dependencies (less on oil and gas exporters, more on hydrogen, lithium, nickel and cobalt). Individuals: loss of housing, increased cost of living, increased violence, healthcare risks such as zoonotic diseases and spreading malaria.
Full-width serif headline over a three-column matrix with orange column headers and bold-lead bullets.
Most of the world acknowledges the climate crisis and many countries are increasing renewable energy, but the transition is hard: some countries are delaying efforts, investment needs are huge, stranded-asset owners may block progress, key technologies are not at scale and regulation is hard to pass in polarised parliaments. Humanity is in a race against time.
Full-bleed photo with a large white text card on the right containing serif headline and two paragraphs.
Section divider opening the technological disruption chapter.
Peach background with oversized orange numeral '2' top-right and serif title bottom-left.
Transformative technology changes how we function and how we understand humanity; it enables huge value creation but harmful consequences are increasingly difficult to mitigate. Existential question: What does it mean to be human in a world in which technology increasingly overlaps with what humans do and creates massive unintended consequences?
Left text column with icon, title, bold thesis and orange existential question label; right photo panel.
Narrative covers AI, robotics, energy storage, DNA sequencing, synthetic biology, blockchain and materials science approaching tipping points; ChatGPT 3.5 (November 2022) accelerating an industrial revolution of knowledge work and agentic AI now doing work; value pools shifting from software, education and professional services to AI-driven players; and harms such as disinformation, mental health and job insecurity. Charts: 'The pace of technological innovation is increasing' — time to hit 50 million users: airlines 64 years, automobiles 62, telephone 50, electricity 46, credit cards 28, television 22, ATMs 18, computers 14, mobile phones 12, internet 7, Facebook 4, WeChat 1 year, ChatGPT under 2 months (Visual Capitalist); 'Technology is key for addressing challenges caused by Megatrends' — climate tech share of VC and PE investment rising from roughly 1-2% in 2014 to a peak around 13% in 2023 (PwC State of Climate Tech 2024, Pitchbook); 'Technology has serious unintended consequences' — employment share by AI exposure and complementarity for Great Britain, US, Brazil, Colombia, South Africa and India, with high exposure largest in Great Britain and lowest in India (IMF).
Two-column narrative on top; three charts below with orange action titles: horizontal bar chart, line chart with markers, stacked column chart.
Organisations: competitive differentiation, business failure for those that fail to transform with AI, concentration of power, mismatch between required and available (STEM) skills, increased fraud and cyber risk. Governments: struggling to evolve, creation of technology-based institutions, pressure to mitigate unintended consequences, changing economic dependencies on AI, 5G/6G, climate tech, nanotech and synthetic biology. Individuals: significant capacity enhancement, massive disruption of work, loss of privacy, increasing disinformation and fraud, growing mental health issues.
Serif headline over a three-column implications matrix with orange headers.
Technology has a meaningful positive impact (climate tech, health tech, 'Tech for Good'), but unintended consequences are not sufficiently considered in design and may outweigh the positives; slowing innovation would be disastrous for the other Megatrends.
Full-bleed office photo with a white text card on the right.
Section divider opening the demographic shifts chapter.
Peach background with oversized orange numeral '3' and serif title.
Median age is increasing in all countries at different rates, causing some social systems to break down and worker shortages, while other countries face un- and under-employment, emigration and strained safety nets. Existential question: How to help groups of people with different needs when money, experience, power, ambition and capacity are distributed differentially?
Left text column with icon and thesis; right aerial photo panel.
Narrative highlights age and population growth as the two most potent demographic forces: ageing societies face shrinking workforces and rising old-age dependency, while young, growing societies struggle with chronic youth unemployment and emigration. Charts (UN World Population Prospects 2024, PwC analysis): 'Median age in all countries around the globe is increasing, but at different rates' — 2020-2050 lines with South Korea, Italy, Japan and China rising toward the mid-50s by 2050 and Ethiopia, Nigeria, Niger and Congo staying near 15-25; 'In countries with high median age, the old-age dependency ratio is increasing quickly' — people 65+ per 100 aged 20-64 in 2020, 2030 and 2050 for the US, UK, Canada, France, China, Germany, Spain, Italy, Japan and South Korea, with South Korea, Japan, Italy and Spain approaching or exceeding 75 by 2050; 'In countries with low median age, the number of people ready to enter the workforce will grow massively' — stacked area charts of population by age group for Africa (rising toward about 2.5 billion by 2050) and India (2000-2050).
Left narrative column; right side has two charts on top (multi-line chart and grouped horizontal bar chart with flags) and two stacked area charts below, all with orange action titles.
Organisations: shifting consumption patterns (food at home, renovation, healthcare), skills mismatch, conflicts among five generations at work, lack of highly skilled people in young countries. Governments: capacity mismatch across countries, mass emigration or unrest, social polarisation, failing welfare systems and erosion of the tax base. Individuals: unaffordable retirement, shortage of essential services such as home care and construction, massive youth unemployment, extreme poverty.
Serif headline over a three-column implications matrix.
Public debate in ageing countries is broadening from pensions to worker shortages; some governments are building ties with young countries to attract talent and considering lowering the voting age. But localising supply chains worsens youth unemployment in young countries; fair migration practices and help building local economies are needed.
Full-bleed photo with white text card on the right.
Section divider opening the fracturing world chapter.
Peach background with oversized orange numeral '4' and serif title.
The world is becoming multi-nodal as more nation states compete for influence, with others aligning around them and some acting as destabilisers; countries are turning inwards to prioritise national resilience and localisation. Existential question: What does it mean to live and thrive in a multi-nodal world?
Left text column with fractured-globe icon and thesis; right photo panel.
Narrative describes a shifting world order with competing civilisational narratives, tariffs, election interference and hot wars, and a 'local first' and friend-shoring response. Charts: 'The number of state-based conflicts has risen significantly over the past decade' — conflicts and battle-related deaths 1946-2024 by conflict type (UCDP/PRIO); 'The transition from old world power to new world power: Rare Earth Elements are critical for high technology' — proved oil reserves 2021 share of global reserves: Venezuela 18%, Saudi Arabia 15%, Iran 12%, Canada 10%, Iraq 9%, Kuwait 6%, UAE 6%, Russia 5% (EIA); and rare earth reserves 2024 with world total over 90,000,000t: China 44,000,000t (48%), Brazil 21,000,000t (23%), India 6,900,000t (8%), Australia 5,700,000t (6%), Vietnam 3,500,000t and Russia 3,800,000t (4% each), United States 1,900,000t and Greenland 1,500,000t (2% each) (USGS 2025).
Two-column narrative on top; bottom row with a dual-axis area/line chart, a horizontal bar chart with flags and percentage droplets, and a donut chart with callouts.
Organisations: disrupted global supply chains, pressure for boycotts and taking a stand, conflicting rules, tariffs and sanctions, pressure to be deeply embedded in key countries. Governments: rising international conflict and struggling multilaterals, destabilisation by proxies and shadow actors, parochial political decisions, pressure to raise defence budgets at the expense of aid. Individuals: declining personal safety, more acute local concerns, loss of freedoms and transparency, increase in human rights abuses.
Serif headline over a three-column implications matrix.
Tariff conflicts, Brexit and the wars in Ukraine and Gaza have accelerated local-first strategies and supply chain redesign, but local-first makes it harder to tackle global challenges like climate change and mass migration; nation states need a new basis for international collaboration and redesigned multilaterals.
Full-bleed photo of national flags with white text card on the right.
Section divider opening the social instability chapter.
Peach background with oversized orange numeral '5' and serif title.
Massive pressure from social and economic asymmetry, polarisation and eroding trust leads to greater social unrest. Existential question: How to create a thriving economy and simultaneously remediate the significant social issues in the world?
Left text column with seesaw icon and thesis; right photo panel.
Narrative cites a Gallup 2024 finding that 60 per cent of people worldwide are struggling and 7 per cent suffering, and describes growing asymmetry, polarisation and declining trust. Charts: 'With labour wages stagnating and returns on assets exploding, wealth will increasingly concentrate in fewer and older people' — US 2009-2025 indexed to 2009=100, with the S&P 500 rising to roughly 650 versus house prices near 200 and manufacturing hourly earnings near 160 (FRED); 'Polarisation is increasing around the world' — V-Dem political polarisation 1990-2024 by region, with South America, North America and Asia rising sharply after 2010; 'The general population's trust in institutions remains at a low level' — 2025 Edelman Trust Barometer index, Global 28 at 56 in both 2024 and 2025, China highest (79 in 2024, 77 in 2025) and Japan lowest in 2025 at 37, with the UK at 39 in 2024.
Two-column narrative with bold lead words (Asymmetry, Polarisation, Trust); three charts below: indexed line chart, regional line chart and ranked trust index table with colour coding.
Organisations: reconcile divergent stakeholder expectations, pressure for transparency while managing reputational risk, care for employees holistically, invest in creating trust as an asset. Governments: erosion of the middle class, mass poverty in some nation states, real risk of unrest and political instability, devaluation of institutions, rising scepticism and populism. Individuals: declining ability to afford a decent life, shrinking upward mobility, difficulty trusting others, declining personal safety due to unrest.
Serif headline over a three-column implications matrix.
Social issues have come to the front of public conscience, but fixing them is harder given economic disparity, polarisation and low trust; business is increasingly expected to lead a new economic system that does well and does good, securing its own licence to operate.
Full-bleed photo of a team discussion with white text card on the right.
Section divider for the closing chapter.
Peach background with oversized orange numeral '6' and serif title.
Concludes that the five Megatrends each pose existential questions and could bring humanity to a tipping point, but their interaction makes them hardest to manage: each one exacerbates social challenges, which in turn make it harder to fight the others. 'We are in a race against time.' Includes the 2025 PwC copyright notice.
Left-column closing text; right-side diagram with Social Instability in a central hexagon connected to Climate change, Technological disruption, Fracturing world and Demographic shift in the four corners.
關於此幻燈片和基礎簡報內容的常見問題。
It is a 31-page report deck by PwC that revisits the five Megatrends the PwC network identified more than a decade ago: Climate change, Technological disruption, Demographic shifts, Fracturing world and Social instability. Each chapter states a thesis and an 'existential question', presents charts and evidence, lists implications for organisations, governments and individuals, and assesses how the world is responding. It closes by showing how the trends interact, with social instability at the centre.
Highlights include: average global temperatures exceeded 1.5°C above pre-industrial levels in 2024 and are expected to consistently reach 1.5°C in the first half of the 2030s; an additional 1 billion people are expected to live with extremely high water stress by 2050; ChatGPT reached 50 million users in under two months versus 64 years for airlines; China holds about 44,000,000t, or 48%, of world rare earth reserves; 60% of people worldwide are struggling and 7% suffering (Gallup 2024); and the Edelman 2025 global trust index sits at 56.
It is published by PwC, the global professional services network. PwC first identified its five Megatrends more than a decade ago and has tracked and periodically refreshed them since; this edition is dated November 2025 and reflects developments such as agentic AI, tariff conflicts and wars in Ukraine, Gaza and Sudan.
It follows a strict modular structure for each chapter: numbered section divider, a thesis slide with a bold existential question, an evidence page combining two-column narrative with three charts whose orange headlines state the takeaway (action titles), a three-column implications matrix, and a photo slide answering 'How is the world dealing with this Megatrend?'. The consistent grid, restrained colour palette and cited sources under every chart are hallmarks of Big Four report decks.
Charts draw on Copernicus/ECMWF ERA5 temperature data, IPCC AR6 sea-level scenarios, WRI Aqueduct 4.0 water stress, Visual Capitalist adoption data, PwC State of Climate Tech 2024 and Pitchbook, IMF research on AI exposure, UN World Population Prospects 2024, UCDP conflict data, US EIA oil reserves, USGS Mineral Commodity Summaries 2025, FRED, V-Dem via Our World in Data and the 2025 Edelman Trust Barometer.
Start with a clear chapter template (divider, thesis, evidence with action-titled charts, implications, response) and write each chart title as the conclusion it proves. 2Slides can turn a document, report or outline into a structured slide deck, so you can paste your research or upload a file and generate a first draft in this style, then refine the charts and wording.
Yes, as a structural idea. The three-column matrix with orange headers and bold-lead bullets is a simple, reusable way to translate any trend or risk into stakeholder-specific consequences. Recreate the layout with your own content rather than copying PwC's text or branding.
The original PDF is published by PwC at https://www.pwc.com/gx/en/issues/megatrends/assets/pwc-megatrends-november-2025.pdf. All rights to the content belong to PwC; this gallery page is provided as a reference for its findings and slide structure.
Original PDF of the report deck shown on this page.

Create Your Own Slides
Turn your ideas into professional presentations in seconds with 2slides AI.
參考專業設計,選擇您的風格,產生具有完美文字渲染的投影片。由 Nano Banana 提供支援—立即開始建立您的簡報。


