
所屬合集: 投資人簡報案例
Petrobras Q3 2026 Earnings Presentation — the English-language "3Q26 Performance" webcast deck of November 11, 2026, covering record oil production, raised 2026 production, Capex, opex and operating cash flow guidance, refining and sales results, cash generation, net debt and taxes paid; the deck was filed with the SEC as an exhibit to Form 6-K.
以這份簡報的封面作為風格參考,用您自己的內容產生幻燈片。 也可以在下方任選一頁,以它的版面作為參考。
快速導航
標籤
分享幻燈片
Petrobras Q3 2026 Earnings Presentation — the English-language "3Q26 Performance" webcast deck of November 11, 2026, covering record oil production, raised 2026 production, Capex, opex and operating cash flow guidance, refining and sales results, cash generation, net debt and taxes paid; the deck was filed with the SEC as an exhibit to Form 6-K.
每張幻燈片頁面的詳細視圖,包括版面、關鍵內容和視覺元素。
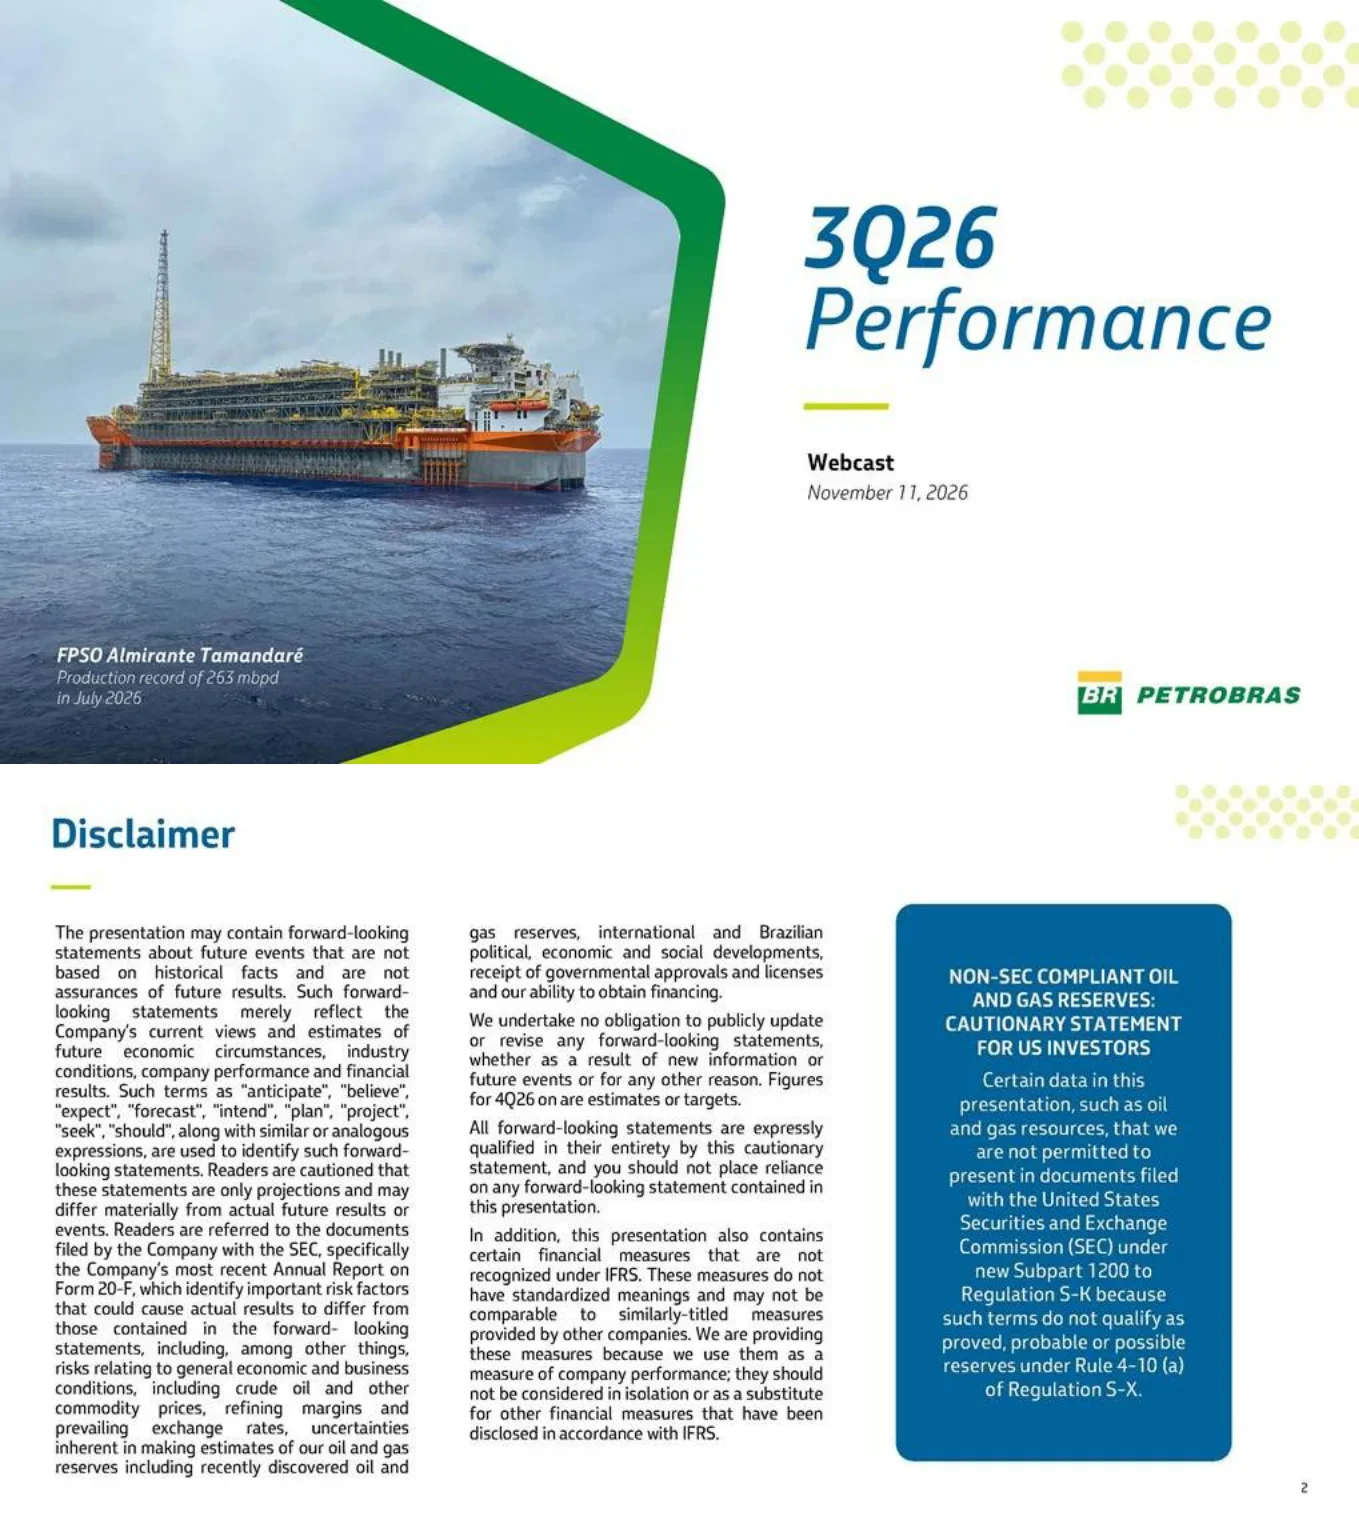
Title slide for the Petrobras webcast dated November 11, 2026. The photo caption reads FPSO Almirante Tamandaré, production record of 263 mbpd in July 2026.
Left half is a hexagon-cropped photo of an FPSO at sea with a green border; right half holds the title, a lime accent line, the webcast label and date, and the logo at bottom right.
Forward-looking statements notice referring readers to the company's most recent Annual Report on Form 20-F filed with the SEC, stating that figures for 4Q26 onward are estimates or targets and that some measures are not recognized under IFRS. A blue box carries the cautionary statement for US investors on non-SEC compliant oil and gas reserves.
Two dense text columns of legal copy on the left and centre, with a rounded blue call-out box on the right.
Records of 3.51 MM boed total own production (2.96 MM boed in the pre-salt) and 5.08 MM boed total operated production, plus Búzios surpassing 11 MM m³/d average natural gas exports. Exploration discoveries in the Equatorial Margin and Colombia, new blocks won in Brazil (21 blocks in ANP auctions), Ivory Coast, São Tomé e Príncipe and Ghana talks, and P-80 and P-82 sailing to Búzios with start-up scheduled for 2027.
Three-column grid of icon-headed sections (efficiency and technology, exploratory discoveries, new blocks and rights) with a full-width New Production Systems strip at the bottom.
Record diesel production of 769 mbpd, a refinery utilization factor of 99% (5 pp above 3Q25), and record domestic market sales of 1,854 mbpd; oil and oil product exports totaled 1,251 mbpd. Also covers sustainable fuel contracts and SAF at REDUC, monthly records in crude oil export (37.8 MM barrels) and CTV transfers (6.6 MM barrels), and the first Mar Aberto Program vessel, PSV Starnav Elektra.
Three-column layout with icon headings: oil product output and record sales on the left, sustainable fuels and recognition in the centre, logistics efficiency on the right.
Decarbonization items include the São Tomé CCS Pilot Project license and contracts, the Rota Verde Program fuel tests, and a CAP Pro W 30/45 R asphalt solution with 40% recycled asphalt. Also lists operating and installation environmental licenses (including P-80, P-82 and P-83) and the Excellence Center in Distributed Digital Innovation, citing more than 11,000 professionals, 14,000 applications and 45,000 automations.
Green graphic panel at left; decarbonization column and environmental licenses column in the upper area, with a full-width digital innovation and AI strip at the bottom.
A bar chart of own oil production in Brazil rises from 2,221 mbpd in 1Q25 to 2,832 mbpd in 3Q26, a +12.4% increase versus 3Q25 (2,520), with a monthly record of 2.91 MMbpd in September 2026. A table gives total own production of 3,512 mboed and total operated production of 5,082 mboed in 3Q26; the left column notes 11 platforms operated above original design capacity and a July 2026 record of 263 mbpd at Almirante Tamandaré.
Three icon-led text blocks on the left; on the right a seven-bar column chart with the last bar highlighted, a +12.4% callout, a record badge and a two-row data table beneath.
Authorization to increase production capacity by up to 282 mbpd across eleven platforms, with per-unit gains such as +45 mbpd at FPSO Alm. Tamandaré, FPSO Sepetiba and FPSO Alexandre de Gusmão, and an average gain of 87 mbpd in operated production during the year (based on October 2026 closing figures). Six additional units (P-79, P-80, P-82, P-83, P-84, P-85) are expected to add capacity, targeting an increase of 10% to 20% with up to 260 mbpd.
Framed panel of platform thumbnails with capacity gains in two rows, summary boxes at left, and a green banner at the bottom listing the six upcoming units.
Oil production is 2.71 MMbpd for 9M26, against the original 2026 forecast from BP 2026-30 of 2.5 (plus or minus 4%) and a new target of 2.7 to 2.8 MMbpd. Drivers are efficiency gains, increased capacity and ramp-ups, and earlier first oil from P-79; factors for 4Q26 are scheduled maintenance shutdowns and a lower work interest in the Búzios production-sharing agreement (about 85 mbpd).
Left: three-bar chart (9M26 actual, original forecast, new forecast with hatched range) and bullet list; right: green hexagon panel listing 4Q26 factors; footnote at the bottom.
Capex for 9M26 was US$ 16.8 billion (US$ billion), split E&P 14.2 (84%), RTM 2.1 (12%), G&LCE and Others small shares, with cash Capex of US$ 14.6 billion. Physical progress covers Búzios P-80, P-82 and P-83 (over 90% of construction), Atapu 2 and Sépia 2 (progress more than doubled), 53 subsea tie-ins, 40 drillings and 38 completions, with 2027 milestones listed.
Donut chart with legend and a cash Capex box at left; a framed physical-progress panel at right with FPSO and subsea/wells columns; a green banner of 2027 milestones across the bottom.
With higher Brent prices the company accelerated project execution: the 2026-30 Business Plan forecast for 2026 Brent was 63 US$/bbl against a 2026 average estimate of 90, with a hatched range up to 100. The text says the plan assumed approximately US$ 60/bbl for 2026 and that persistent geopolitical tensions pushed prices up; the oil production guidance (2.5 to 2.7-2.8 MMbpd) is repeated.
Blue Brent bar chart panel at left; three stacked outlined text boxes at right (Capex initially planned, what changed, how we stepped up execution) with a small production chart.
Cash Capex guidance moves from US$ 16.9 billion in BP 2026-30 to a new 2026 forecast of US$ 21.0 billion (with a hatched range up to 22.0). Manageable operating expenses move from US$ 20.2 billion to US$ 24.2 billion (range up to 25.5), with a -2% planned metric per barrel versus actual 2025; drivers include FX effects, higher execution and production, and logistics expenses.
Two side-by-side rounded panels, Cash Capex on the left and Manageable Operating Expenses on the right, each with a small two-bar chart and bullet drivers.
Operating cash flow (OCF, US$ billion) rises from 35 in BP 2026-30 to a new 2026 forecast of 45, with a hatched range up to 50. Drivers listed are a higher production curve, growth in oil products output and a new level of Brent prices.
Left hexagon-cropped photo of an offshore platform staircase at sunset; right a two-bar chart; a green wedge at the bottom holds three bullets.
A new quarterly record for diesel production at 769 mbpd. Oil products output was 1,790 mbpd in 3Q25, 1,918 in 2Q26 and 1,873 in 3Q26; domestic market sales 1,804, 1,742 and 1,854; imports 314, 156 and 333; exports 1,037, 1,231 and 1,251. Percentage-change bubbles are shown between periods.
A 2x2 grid of small three-bar charts with curved arrow callouts on the left, and a refinery photo (Replan, Paulínia Refinery) in a hexagon on the right.
Brent averaged US$/bbl 69.1 in 3Q25, 104.5 in 2Q26 and 97.0 in 3Q26. Adjusted EBITDA (US$ billion) was 11.7, 18.6 and 16.7 (18.4 in 3Q26 excluding one-off events); net income was 6.0, 10.4 and 7.7 (9.3 excluding one-offs in 3Q26); OCF was 9.9, 12.3 and 12.0.
Four vertical chart panels (Brent, EBITDA, Net Income, OCF) separated by thin dividers, each with three quarterly bars, percentage-change bubbles and legends below.
Gross debt (US$ billion) was 69.8 in 2025, 71.2 in 1Q26, 70.8 in 2Q26 and 70.0 in 3Q26, against 65.0 in the BP 2026-30 average for 2027-2030; net debt fell to 57.8 in 3Q26 from 60.4 in 2Q26. Financial debt was 25.6 and leasing 44.3 in 3Q26, and adjusted cash and cash equivalents reached 12.1. A note cites a make whole on 5.999% Global Notes due 2028 of USD 1.08 billion.
Stacked columns for financial debt and leasing with gross and net debt lines overlaid, a data row for adjusted cash beneath, and a worker photo in a hexagon at left.
Cumulative taxes paid (R$ billion, cash basis) totaled 202.4 in 9M24, 199.9 in 9M25 and 251.3 in 9M26. For 9M26 the components are government take 58.1, federal 97.6, state 94.0 and municipal 1.6.
Stacked column chart with a total line at left and a large hexagon-framed photo of a child at the beach on the right.
Closing slide repeating the title slide: 3Q26 Performance, Webcast, November 11, 2026, with the FPSO Almirante Tamandaré photo noting a production record of 263 mbpd in July 2026.
Identical to the opening slide: hexagon photo on the left, title block and Petrobras logo on the right.
關於此幻燈片和基礎簡報內容的常見問題。
It covers the third quarter of 2026 (3Q26) and the nine months to September 2026 (9M26), presented in a webcast on November 11, 2026, with comparisons to 3Q25 and 2Q26.
It was filed with the SEC as an exhibit to Form 6-K. This gallery page describes the images of the slides from that filing; the slides are rasterized at modest resolution, so small print is not always legible.
It shows record total own production of 3.51 MM boed (2.96 MM boed in the pre-salt), record total operated production of 5.08 MM boed, a monthly oil production record of 2.91 MMbpd in September 2026, and record diesel production of 769 mbpd.
Oil production moves from 2.5 MMbpd (plus or minus 4%) in the BP 2026-30 to a new target of 2.7 to 2.8 MMbpd. Cash Capex moves from US$ 16.9 billion to US$ 21.0 billion, manageable operating expenses from US$ 20.2 billion to US$ 24.2 billion, and OCF from US$ 35 billion to US$ 45 billion, each with a hatched range above the base figure.
Brent averaged US$/bbl 97.0, adjusted EBITDA was US$ 16.7 billion (18.4 excluding one-off events), net income US$ 7.7 billion (9.3 excluding one-offs) and OCF US$ 12.0 billion. Net debt was US$ 57.8 billion and gross debt US$ 70.0 billion at 3Q26.
Cumulative taxes paid on a cash basis were R$ 251.3 billion in 9M26, compared with R$ 199.9 billion in 9M25 and R$ 202.4 billion in 9M24; the slide describes 9M26 as the highest on record.
It has 17 slides: a title slide, a disclaimer, three operational highlights slides, a production section on records, capacity and guidance, investment and guidance slides on Capex, opex and OCF, refining results, financial results, net debt, taxes paid and a closing slide that repeats the title.
Yes, the slides are in English. The slides on this page are provided as images (WebP) taken from the SEC filing, so text is not selectable and some small footnotes may not be readable.

Create Your Own Slides
Turn your ideas into professional presentations in seconds with 2slides AI.
參考專業設計,選擇您的風格,產生具有完美文字渲染的投影片。由 Nano Banana 提供支援—立即開始建立您的簡報。


