
Palantir's Q2 2026 Business Update — a 36-slide quarterly deck covering revenue of $1.94 billion (up 93% year over year), US revenue of $1.57 billion (up 115%), US commercial revenue of $764 million (up 149%), a Rule of 40 score of 155%, GAAP net income of $1.06 billion and GAAP operating margin of 47%, adjusted operating income of $1.19 billion at a 62% margin, adjusted free cash flow of $1.22 billion at a 63% margin, $9.2 billion of cash with no debt, customer-story slides from AIPCon 10 and DevCon 6, and Q3 and full-year 2026 guidance, closing with a nine-page non-GAAP reconciliation appendix.
快速導航
標籤
分享幻燈片
Palantir's Q2 2026 Business Update — a 36-slide quarterly deck covering revenue of $1.94 billion (up 93% year over year), US revenue of $1.57 billion (up 115%), US commercial revenue of $764 million (up 149%), a Rule of 40 score of 155%, GAAP net income of $1.06 billion and GAAP operating margin of 47%, adjusted operating income of $1.19 billion at a 62% margin, adjusted free cash flow of $1.22 billion at a 63% margin, $9.2 billion of cash with no debt, customer-story slides from AIPCon 10 and DevCon 6, and Q3 and full-year 2026 guidance, closing with a nine-page non-GAAP reconciliation appendix.
每張幻燈片頁面的詳細視圖,包括版面、關鍵內容和視覺元素。
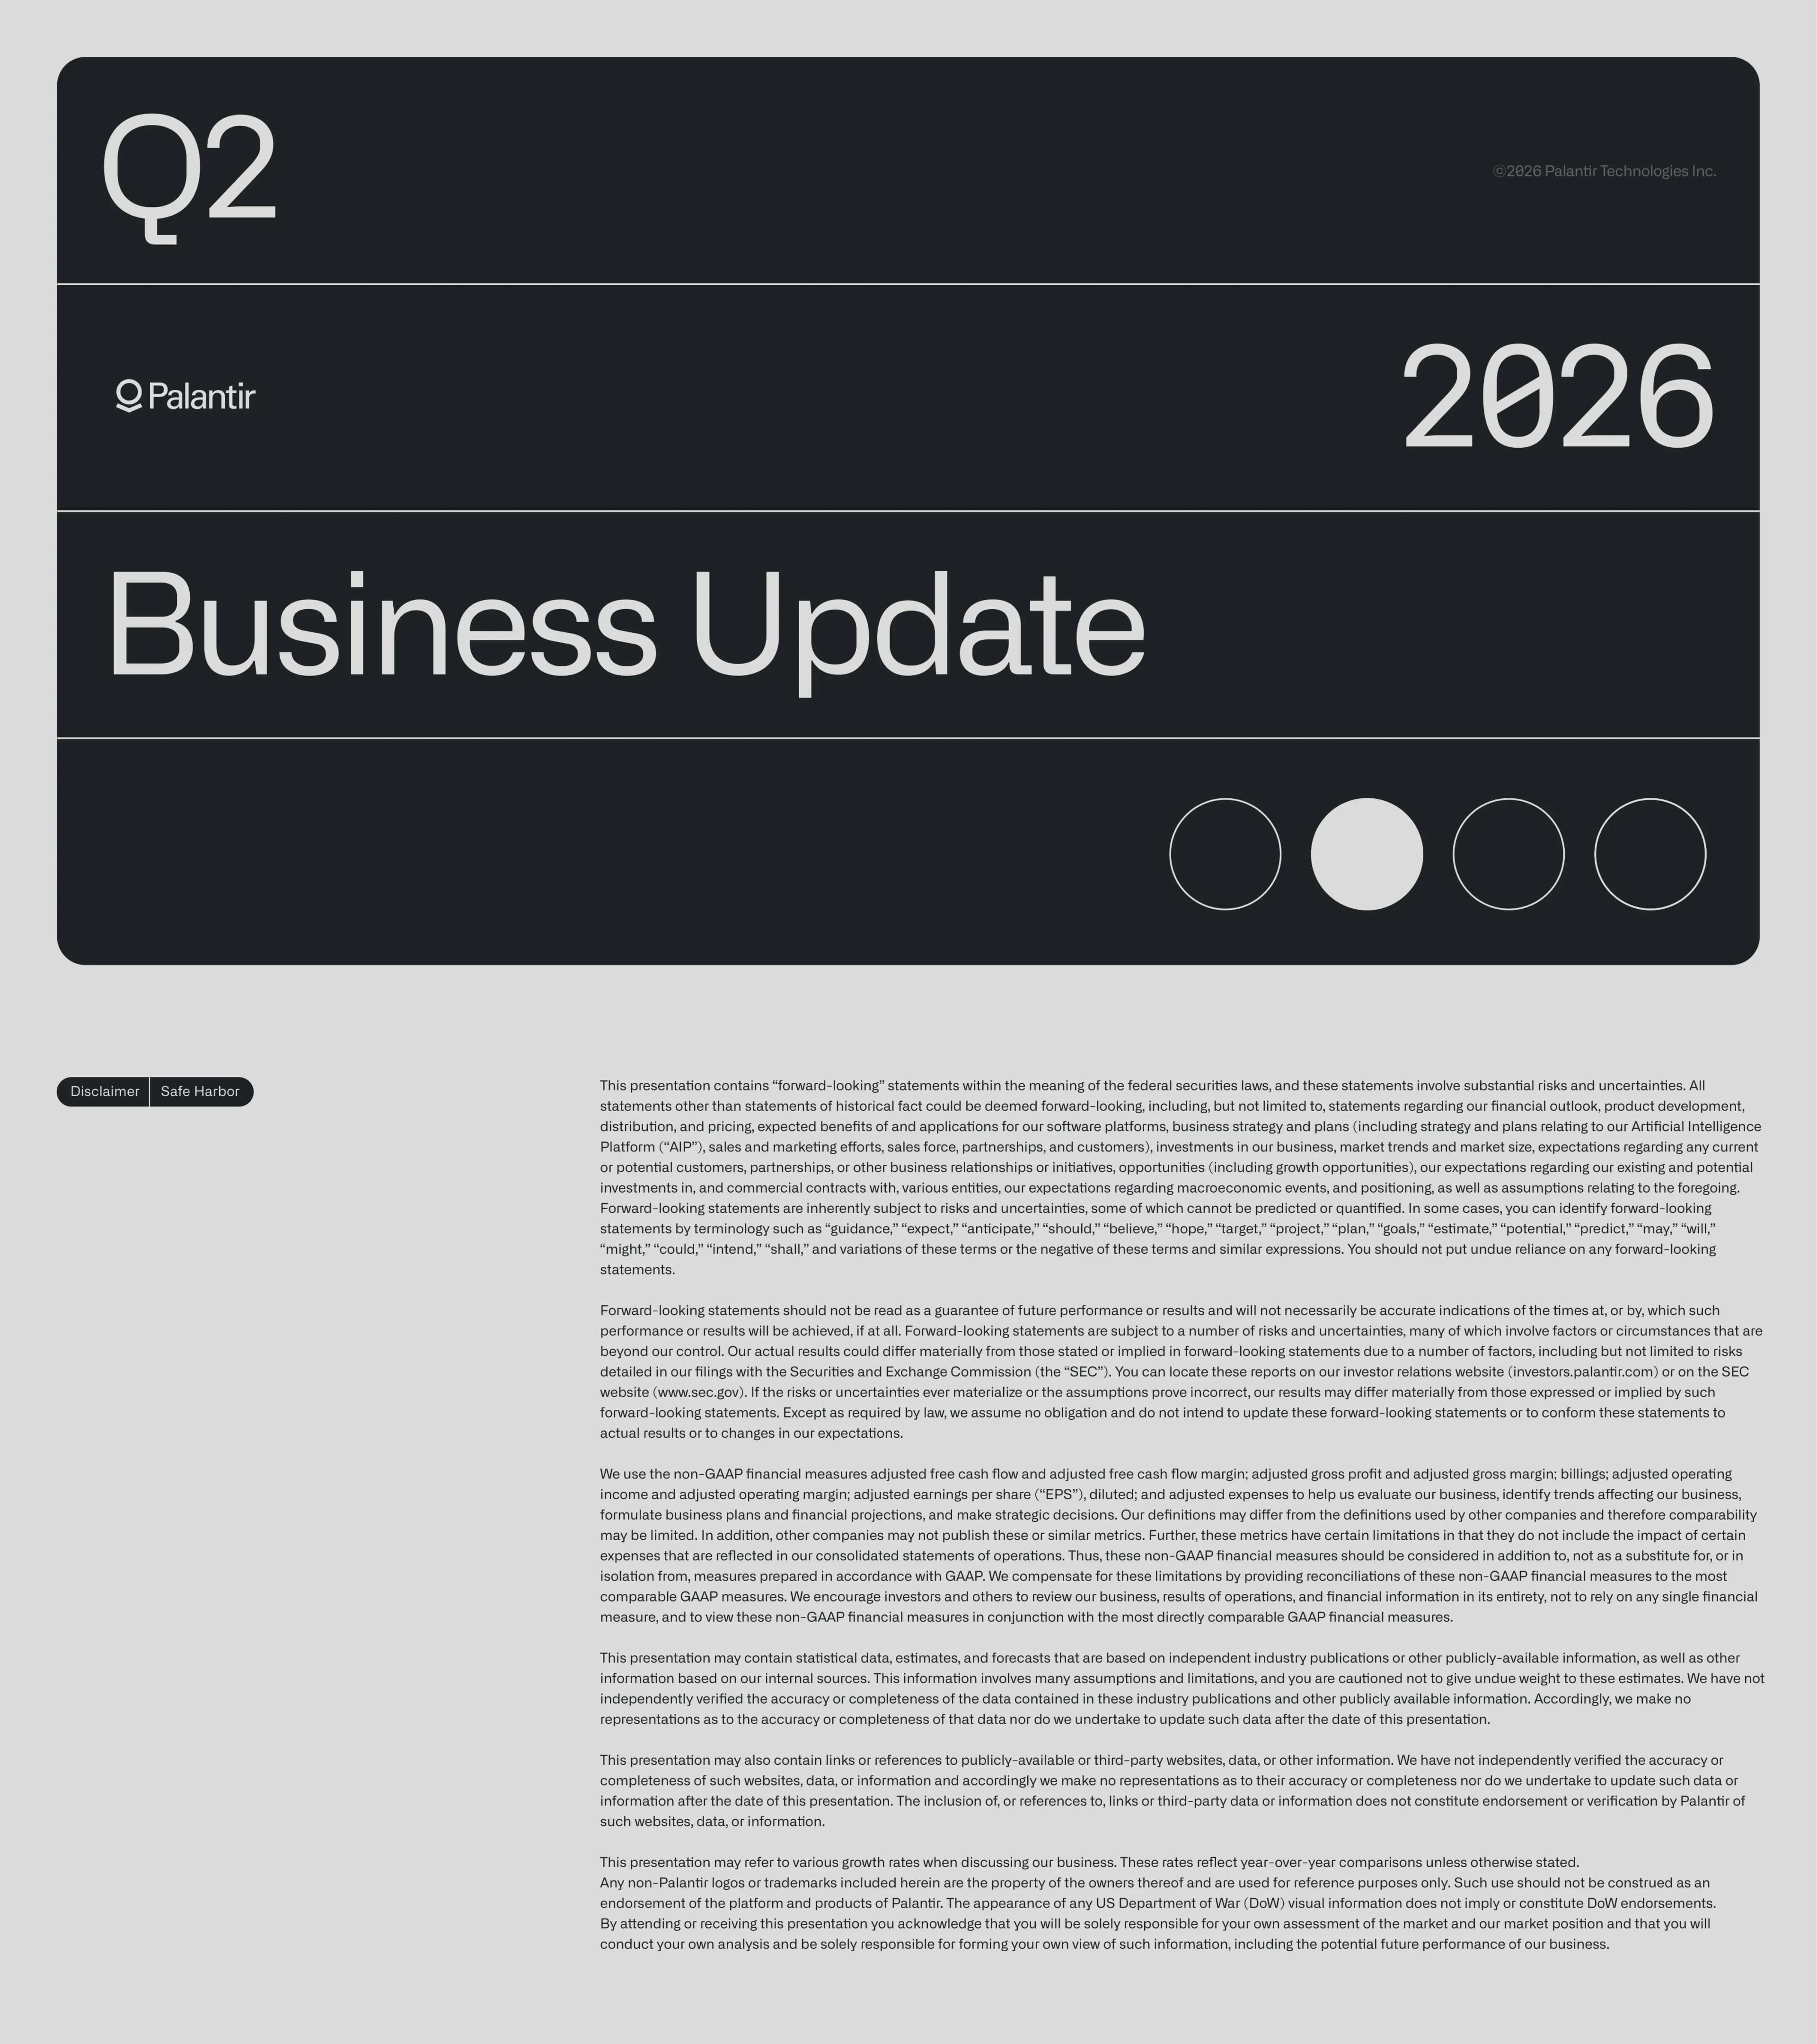
Cover slide for Palantir's second quarter 2026 business update.
Light grey ground with a single large rounded-rectangle card in near-black filling the slide. The card is divided by hairline rules into four bands: 'Q2' top left, the Palantir wordmark and '2026' in the second, 'Business Update' in the third, and four circles — one filled — in the fourth as a progress indicator.
Forward-looking statements notice covering financial outlook, product development, AIP strategy, sales and partnerships; the definitions of the non-GAAP measures used (adjusted free cash flow and margin, adjusted gross profit and margin, billings, adjusted operating income and margin, adjusted EPS diluted, adjusted expenses); a caveat on third-party statistical data; and a note that any appearance of US Department of War visual information does not imply endorsement.
Light grey slide with a small dark pill at the upper left reading 'Disclaimer | Safe Harbor', and six paragraphs of small body text filling the right two-thirds. No graphics.
Scatter plot of year-over-year revenue growth against adjusted operating margin for the top 100 publicly traded companies by market capitalisation as of August 2, 2026, with Palantir highlighted in green at 155%. Named peers include NVDA 153%, LLY 106%, AVGO 106%, TSM 96%, STX 93%, APH 85%, GS 85%, WDC 84%, ANET 82%, CVX 82%, V 82%, JPM 81%, MA 75%, META 71%, MS 70%, LRCX 69%, TXN 65%, GOOGL 65%, MSFT 66%, AAPL 49%, AMZN 36% and others, with Samsung 182%, CXMT 789%, SK hynix 333% and MU 427% shown at the plot boundary. Dashed Rule of 120 and Rule of 160 frontier lines cross the field.
Title at the left on light grey; the right three-quarters is a dark rounded card holding the scatter plot, every point labelled with ticker and score, Palantir ringed in a dashed green circle. Source and methodology notes run down the lower left.
Twelve headline results: US revenue up 115% Y/Y and 23% Q/Q to $1.57 billion; US commercial revenue up 149% Y/Y and 28% Q/Q to $764 million; US government revenue up 90% Y/Y and 18% Q/Q to $809 million; total revenue up 93% Y/Y and 19% Q/Q to $1.94 billion; Rule of 40 score of 155%; 220 deals of at least $1 million closed, 98 of at least $5 million and 73 of at least $10 million; adjusted free cash flow of $1.22 billion at a 63% margin; adjusted operating income of $1.19 billion at a 62% margin; US commercial remaining deal value up 124% Y/Y and 27% Q/Q to $6.24 billion; highest ever quarter of US commercial total contract value at $2.13 billion, up 153% Y/Y; overall TCV up 49% Y/Y to $3.37 billion; adjusted EPS of $0.41 and GAAP EPS of $0.41.
Twelve full-width dark pills stacked down the slide, each opening with an arrow glyph and one sentence, growth figures underlined. A dense definitions footnote runs across the bottom.
The strategic argument: an organisation's most important secrets are its treasure, yet companies are paying misaligned labs to turn that treasure into training data for future models; Palantir's architecture keeps the institution sovereign. Three supporting capabilities — Sovereign AI OS (run AI from on-prem to sovereign cloud to the edge), Multimodal Data Plane (activate AI across any storage, compute and model), and Interoperability (keep data portable with open standards, APIs, metadata, semantics, code and security boundaries).
Dark full-bleed slide. Headline and paragraph at the left over three labelled rows separated by hairlines, each with an arrow and a one-line description, and a 'Learn More' link beneath. The right half holds an isometric exploded render of a stacked architecture — hardware layer, any model, runtime layer, ontology system, agents and applications layer — glowing in blue and violet.
Customer story: Kirkland & Ellis is using AIP to structure decades of institutional knowledge into a proprietary platform built on the firm's own workflows, tradecraft and judgment, compounding across the fundraising lifecycle. Quote from Erica Berthou, Global Executive Committee member of Kirkland & Ellis: 'What used to take days for a lawyer to analyze, discuss, and draft, now happens in minutes. … We think this is a revolutionary change in how our work gets done.'
Dark slide split in half. Left: headline, explanatory paragraph, a pull quote with a vertical rule and attribution in small caps, the Palantir and Kirkland & Ellis logos lock-up, and Learn More / Watch the Keynote links. Right: a square editorial illustration — stacked coins rising over a candlestick chart on saturated blue.
Customer story: nearly 100% of the world's uranium enrichment capacity is controlled by foreign governments; Centrus is using AIP to accelerate its Piketon expansion and restore America's ability to enrich uranium at commercial scale. Quote from Amir Vexler, President and CEO of Centrus Energy: 'The nearly $300 million in savings we have identified to date are only the beginning.'
The customer-story layout repeated — left column of headline, paragraph, pull quote and logo lock-up; right half a photograph of enrichment cascade ductwork with a US flag at the centre.
Partner story: data migration is where enterprise transformations go to die; by embedding AIP across SAP's migration toolchain, Palantir is turning a bottleneck into a launchpad. Quote from Christian Klein, CEO of SAP SE: 'Together with Palantir, we are enabling customers to move to the cloud with speed and confidence through complementary capabilities that accelerate innovation across the enterprise.'
Same split layout; right half a photograph of a container ship loaded with stacked containers.
Customer story: McCarthy, one of America's oldest construction companies, is using AIP to build a connected AI operating system that puts 160 years of construction expertise into the hands of every field team.
Same split layout, this one without a pull quote — a longer paragraph instead. Right half a photograph of a worker on scaffolding at sunset with a US flag behind.
Two conference testimonials. USDA used AIP to turn hundreds of fragmented legacy systems into a single governed Ontology — Sam Berry, Chief Information Officer: 'Within 62 mins of opening, the program broke all prior USDA records for online farmer sign-ups. It delivered over $4.4 billion directly to farmers in the program's first 5 days.' Parts Town is using AIP to transform customer support and field service operations — Bill Gear, Chief Executive Officer: 'The impact of this work extends far beyond technology. The projected value opportunity for our business exceeds 200 basis points of EBITDA margin. That's massive at scale.'
Dark slide, full-width headline, then two equal cards side by side. Each card carries a context line, a large pull quote with the key figure underlined, a stage photograph of the speaker, a name-and-title block, and the customer logo in a grey footer panel.
DevCon 6 product announcements: Apollo x NVIDIA (deploy frontier AI to your sovereign architecture, from AIP to on-prem clusters); AIP Evolve (optimise AI systems with agents that automatically test model swaps and architecture changes); Orchestrator (create bespoke agentic workflows with a reliable execution layer); Agent Engine (build agents as distributed state machines with full visibility into every decision).
Dark slide; headline at the left over four hairline-separated rows, each with a small-caps product name, a green arrow glyph and a one-line description, with a play button and 'Watch the Demos' link below. Right half a photograph of a speaker in front of a green-lit stage graphic.
At the inaugural American Builder Summit, Palantir's American Tech Fellows showed how AI amplifies hard-won tradecraft rather than replacing it, ensuring workers share in the value they create. Three fellows are pictured — Brittany M. (healthcare), Jonah M. (manufacturing) and Kwame A. (defense).
Dark slide with headline and two paragraphs at the left plus a play button and 'Watch Shyam's Opening Remarks' link. Right half: a woodcut-style poster of a worker holding a torch and a flag on a grey ground, above a three-up strip of speaker photographs each captioned with a first name and sector.
Section divider marking the start of the financial section.
The cover construction repeated with 'Financials' in the third band; the second of the four circles is filled to show progress through the deck.
Five US commercial metrics: revenue up 149% Y/Y and 28% Q/Q; customer count up 35% Y/Y and 6% Q/Q; remaining deal value up 124% Y/Y and 27% Q/Q; deals closed of $1 million or greater up 1.7x Y/Y and of $5 million or greater up 1.6x Y/Y; total contract value of $2.13 billion, up 153% Y/Y. A footnote defines a customer as an organisation from which revenue was recognised during the trailing twelve months.
Light grey slide with five grey cards in a two-then-three arrangement, each holding one or two oversized figures with a caption beneath each.
GAAP net income across five quarters: $327 million in Q2 2025, $476 million, $609 million, $871 million and $1.06 billion in Q2 2026.
Headline sentence alone on the left half of a light grey slide; the right half a dark rounded card containing a single white line chart with circular markers, each point labelled, on a broken axis.
GAAP operating income across five quarters: $269 million in Q2 2025, $393 million, $575 million, $754 million and $912 million in Q2 2026.
The previous slide's construction repeated exactly — headline left, single labelled line chart in a dark card right.
Rule of 40 score over eight quarters: 68% in Q3 2024, then 81%, 83%, 94%, 114%, 127%, 145% and 155% in Q2 2026.
A single dark rounded card spanning almost the whole slide, holding one line chart with eight labelled markers, the final point ringed in dashed green. No accompanying text.
US revenue of $733 million in Q2 2025 rising to $1.57 billion in Q2 2026, up 115%, driven by acceleration in US commercial and US government.
Headline left; right a dark card with a two-bar comparison — the prior-year bar drawn as an outline, the current bar filled with a white-to-grey gradient — joined by a dotted line carrying the growth rate.
US commercial revenue of $306 million in Q2 2025 rising to $764 million in Q2 2026, up 149%; US government revenue of $426 million rising to $809 million, up 90%.
Two dark cards side by side, each with its own titled two-bar chart in the same outline-versus-gradient treatment and dotted growth connector.
Worldwide commercial revenue of $451 million in Q2 2025 rising to $945 million in Q2 2026, up 110%; worldwide government revenue of $553 million rising to $990 million, up 79%.
The previous slide repeated at the worldwide level — two dark cards, two two-bar charts, two dotted connectors.
Total revenue of $1.00 billion in Q2 2025 rising to $1.94 billion in Q2 2026, up 93%, driven by the continued acceleration of the US business.
Headline left, single two-bar chart in a dark card right — the same construction as the US revenue slide, at the consolidated level.
Adjusted operating income across five quarters with margins: $464 million at 46% in Q2 2025, $601 million at 51%, $798 million at 57%, $984 million at 60%, and $1.19 billion at 62% in Q2 2026.
Headline left; right a dark card whose own heading states the result, above five bars — four outlined, the last gradient-filled — each labelled with its value and, in small caps above it, its margin.
US commercial customer count on a trailing-twelve-month basis: 485 at June 30, 2025, then 530 (+9%), 571 (+8%), 615 (+8%) and 653 (+6%) at June 30, 2026 — up 35% year over year.
A single full-width dark card holding five bars, four outlined and the last gradient-filled, with sequential growth rates on dotted connectors between them and a bracketed +35% Y/Y spanning the full series above.
Total customer count on a trailing-twelve-month basis: 849, 911 (+7%), 954 (+5%), 1,007 (+6%) and 1,049 (+4%) — up 24% year over year. Commercial customer count: 692, 742 (+7%), 780 (+5%), 832 (+7%) and 870 (+5%) — up 26% year over year.
Two dark cards side by side, each with the same five-bar construction, sequential connectors and spanning Y/Y bracket as the previous slide.
Deal counts for the quarter: 220 deals of at least $1 million, of which 98 were at least $5 million and 73 were at least $10 million.
Light grey slide with '220 deals' set in an oversized display size across the upper left, then two dark cards below, each with a large numeral, a sentence with the threshold underlined, and a dot matrix beneath rendering the count as individual dots.
Cash from operations of $539 million at a 54% margin in Q2 2025 rising to $1.22 billion at a 63% margin in Q2 2026; adjusted free cash flow of $569 million at a 57% margin rising to $1.22 billion at a 63% margin.
Headline left with '$9.2B' set oversized; right a dark card split by a dashed vertical rule into two two-bar panels — cash from operations and adjusted free cash flow — each bar labelled with value and margin.
For Q3 2026: revenue of between $2.160 and $2.164 billion; adjusted income from operations of between $1.292 and $1.296 billion. For full year 2026: revenue of between $8.150 and $8.158 billion; US commercial revenue in excess of $3.424 billion, representing a growth rate of at least 134%; adjusted income from operations of between $4.889 and $4.897 billion; adjusted free cash flow of between $4.5 and $4.7 billion; and GAAP operating income and net income in each quarter of this year.
Two dark cards side by side — Q3 2026 at the left with two arrowed items, FY 2026 at the right with five — each item a label line above the figure set large.
Section divider marking the start of the appendix.
The cover construction a third time with 'Appendix' in the third band and the same four-circle indicator.
Total RPO across five quarters in billions: $2.42, $2.60, $4.08, $4.45 and $4.90, split into short-term RPO of $1.02, $1.14, $1.54, $1.75 and $2.09 and long-term RPO of $1.40, $1.46, $2.54, $2.70 and $2.81. Billings of $1.10, $1.23, $1.49, $1.75 and $2.07 billion. Net dollar retention was 157% in Q2 2026. Footnotes define net dollar retention and RPO, including the practical expedient for contracts with original terms of twelve months or less.
Three stacked dark cards on light grey — a three-row RPO table, a single-row billings table, and a one-sentence card for net dollar retention — with definition footnotes beneath.
Year-over-year revenue growth across eight quarters: 30%, 36%, 39%, 48%, 63%, 70%, 85% and 93%. Adjusted operating margin: 38%, 45%, 44%, 46%, 51%, 57%, 60% and 62%. Rule of 40: 68%, 81%, 83%, 94%, 114%, 127%, 145% and 155%.
One dark card holding a three-row table across eight quarter columns, with a rule separating the two components from the sum.
Cash flow from operating activities of $539,251 thousand in Q2 2025 and $1,216,167 thousand in Q2 2026; add cash paid for employer payroll taxes related to stock-based compensation of $37,152 and $18,746; less cash used to purchase property and equipment of $(7,634) and $(14,554); giving adjusted free cash flow of $568,769 and $1,220,359 thousand, at margins of 57% and 63%.
One dark card with a two-column reconciliation, Add and Less blocks indented under the GAAP line, a rule above the adjusted total, and the margin as the final row.
Q2 2026 gross profit of $1,638,594 thousand plus stock-based compensation of $30,889 thousand gives adjusted gross profit of $1,669,483 thousand and an adjusted gross margin of 86%.
A single-column dark card — the shortest reconciliation in the appendix — with one addition line and a rule above the total.
Income from operations across five quarters: $269,317, $393,256, $575,394, $753,998 and $912,004 thousand. Adding stock-based compensation of $159,971, $172,318, $196,405, $201,592 and $265,209 thousand and employer payroll taxes related to it of $35,097, $34,966, $26,666, $27,955 and $17,259 thousand gives adjusted operating income of $464,385, $600,540, $798,465, $983,545 and $1,194,472 thousand, at margins of 46%, 51%, 57%, 60% and 62%.
One dark card with a five-column reconciliation, two indented adjustment rows, a rule above the adjusted total and the margin row beneath.
Q2 2026 net income attributable to common stockholders of $1,061,890 thousand, plus stock-based compensation of $265,209 and related employer payroll taxes of $17,259, less income tax effects and adjustments of $(297,357), gives adjusted net income of $1,047,001 thousand; over 2,568,694 thousand weighted-average diluted shares that is adjusted diluted EPS of $0.41. A footnote states the income tax effect uses an estimated long-term annual effective tax rate of 23.0%.
One dark card with a single period column, three adjustment lines, and three consecutive ruled total rows — adjusted net income, share count, adjusted EPS.
Revenue across five quarters of $1,003,697, $1,181,092, $1,406,802, $1,632,583 and $1,935,464 thousand, plus change in contract liabilities of $98,439, $44,456, $81,900, $117,027 and $136,481 thousand, giving billings of $1,102,136, $1,225,548, $1,488,702, $1,749,610 and $2,071,945 thousand.
One dark card with a three-row, five-column table and a rule above the billings total.
Total expenses of $734,380 thousand in Q2 2025, $878,585 in Q1 2026 and $1,023,460 in Q2 2026; less stock-based compensation of $(159,971), $(201,592) and $(265,209) and related employer payroll taxes of $(35,097), $(27,955) and $(17,259); giving adjusted expenses of $539,312, $649,038 and $740,992 thousand.
One dark card with a three-column reconciliation — the only appendix table that shows three non-consecutive periods rather than a five-quarter run — with a Less block indented and a rule above the total.
關於此幻燈片和基礎簡報內容的常見問題。
The full 36-slide Palantir Q2 2026 Business Update as a PDF, plus a page-by-page preview. This one is PDF only — no PowerPoint version is included, because the source file is too large for our conversion step. The PDF itself is the original Palantir published.
The source PDF is 15.5 MB, over the 15 MB ceiling of the conversion tool used to produce the editable versions. Rather than skip the deck, we publish the PDF as-is. Everything on the page — the page-by-page analysis, the previews, the download — works the same; there is just no .pptx attached.
Revenue of $1.94 billion, up 93% year over year; US revenue $1.57 billion, up 115%; US commercial revenue $764 million, up 149%. GAAP net income was $1.06 billion with a 47% GAAP operating margin; adjusted operating income was $1.19 billion at a 62% margin; adjusted free cash flow was $1.22 billion at a 63% margin. The company ended the quarter with $9.2 billion in cash and no debt.
It adds year-over-year revenue growth to operating margin; 40% is the conventional bar for a healthy software company. Palantir reports 155% — 93% growth plus a 62% adjusted operating margin. Slide 3 plots it against the top 100 companies by market cap so the claim can be checked against named peers rather than taken on assertion.
For Q3 2026, revenue of $2.160–$2.164 billion and adjusted income from operations of $1.292–$1.296 billion. For full year 2026, revenue of $8.150–$8.158 billion, US commercial revenue above $3.424 billion (at least 134% growth), adjusted income from operations of $4.889–$4.897 billion, adjusted free cash flow of $4.5–$4.7 billion, and GAAP operating income and net income in every quarter.
It is the best model here for a company that wants its deck to look designed. The pattern is copyable: one metric per slide, a headline sentence on the left and a single chart in a dark rounded card on the right, customer proof as full editorial spreads with named quotes, and every adjusted number reconciled in the appendix.
Contrast discipline. Light grey ground, near-black cards, white charts — and nothing else. Prior-period bars are drawn as outlines while the current period is filled with a gradient, so the eye finds the present without a colour key. Growth rates ride on dotted connectors instead of sitting in a legend. The one accent colour, a green, appears twice in 36 slides, both times to mark Palantir's own position.
Most charts show five quarters, Q2 2025 through Q2 2026; the Rule of 40 charts run eight, back to Q3 2024. Palantir's fiscal year matches the calendar year, so Q2 2026 is the quarter ended June 30, 2026.
Original PDF published by Palantir alongside the Q2 2026 results.

Create Your Own Slides
Turn your ideas into professional presentations in seconds with 2slides AI.
參考專業設計,選擇您的風格,產生具有完美文字渲染的投影片。由 Nano Banana 提供支援—立即開始建立您的簡報。
Your AI Agent for slides. Save time, shine faster with intelligent presentation creation.




© 2026 2slides. All rights reserved.