
所屬合集: 顧問公司簡報範例
Oliver Wyman Airline Economic Analysis (AEA), State of the Industry: Q2 2026 edition. A 56-page published consulting report deck by Oliver Wyman (a Marsh business) reviewing second-quarter 2026 global airline financial results, with a special-topic US Carrier Annual Financial Review of 2025 DOT Form 41 data, regional deep dives (North America, Latin America, Europe, Asia/Pacific, Africa/Middle East/India) and a carrier-by-carrier appendix.
以這份簡報的封面作為風格參考,用您自己的內容產生幻燈片。 也可以在下方任選一頁,以它的版面作為參考。
快速導航
標籤
分享幻燈片
Oliver Wyman Airline Economic Analysis (AEA), State of the Industry: Q2 2026 edition. A 56-page published consulting report deck by Oliver Wyman (a Marsh business) reviewing second-quarter 2026 global airline financial results, with a special-topic US Carrier Annual Financial Review of 2025 DOT Form 41 data, regional deep dives (North America, Latin America, Europe, Asia/Pacific, Africa/Middle East/India) and a carrier-by-carrier appendix.
每張幻燈片頁面的詳細視圖,包括版面、關鍵內容和視覺元素。
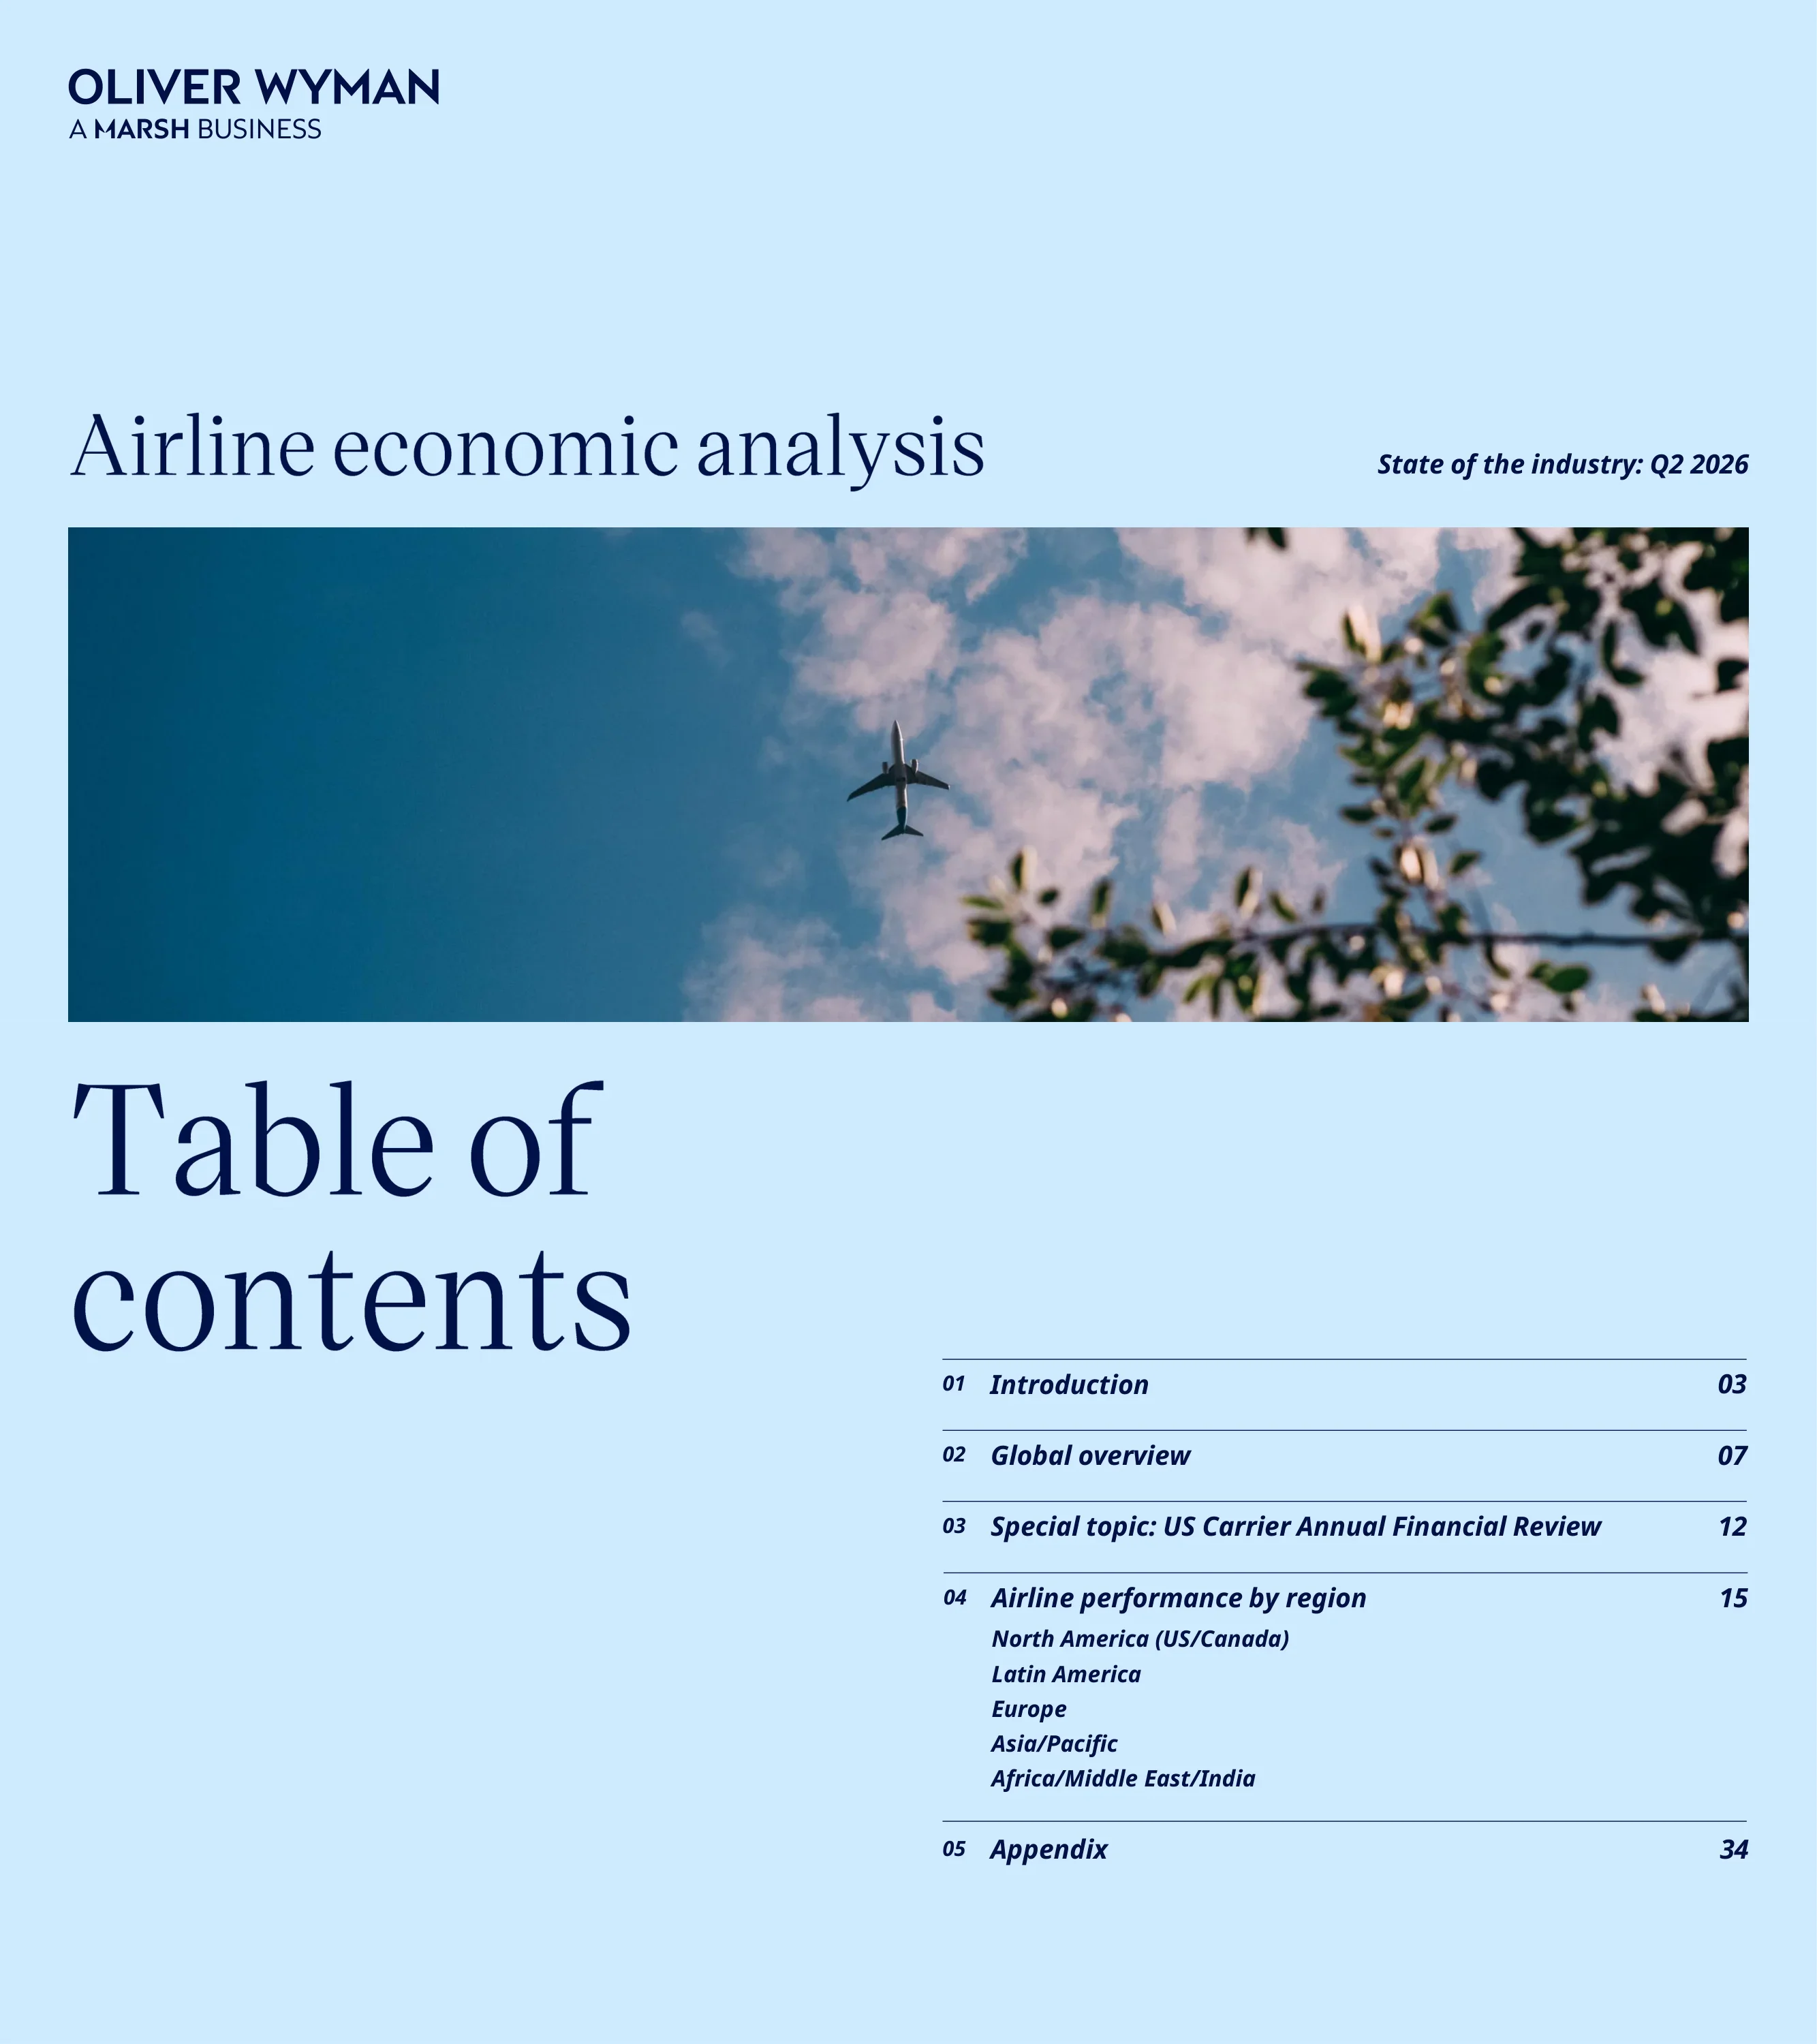
Cover page with the Oliver Wyman (A Marsh Business) logo, the title 'Airline economic analysis' and the subtitle 'State of the industry: Q2 2026'.
Light-blue background, logo top-left, large serif title above a full-width photo band; edition label right-aligned in bold italic.
Five sections: 01 Introduction (p.3), 02 Global overview (p.7), 03 Special topic: US Carrier Annual Financial Review (p.12), 04 Airline performance by region (p.15) covering North America (US/Canada), Latin America, Europe, Asia/Pacific and Africa/Middle East/India, and 05 Appendix (p.34). Page references in the contents do not match the final page numbering of the deck.
Oversized serif 'Table of contents' on the left, ruled numbered list with page numbers on the right.
Global airlines showed resilience in Q2 2026 despite a sharp fuel-cost increase and geopolitical uncertainty: worldwide capacity +3.3%, global operating margin ~4.1%, industry revenue +11.7%, industry expense +19.1%. Q2 marked a pivot from growth to shock management as Middle East conflict disrupted Gulf hubs and airspace and the jet-fuel shock reset 2026 economics. European and Asian carriers with direct long-haul options benefited from displaced connecting demand; priorities are schedule reliability, redeploying capacity to durable origin-and-destination demand, and flexible rebooking. Closing question: can carriers adapt as both the economics of flying and the geography of connecting traffic are reshaped.
Three columns: shaded KPI panel with four big-number tiles, a narrative text column with bolded key phrases, and a traveller photo; full-width pull quote with a yellow accent bar at the bottom.
Each region is presented in three sections: 1) financial results summary (operating revenue, expense, earnings, margin, ASMs, RASM, CASM), 2) results by business model (full-service vs. lower-cost, including ultra-low-cost and value), 3) production review (ASMs, gauge, stage, fleet, utilization). Scope is an index of select carriers per region; Africa/Middle East/India lacks enough data for a comparable index. Data come from CapIQ, carrier earnings releases, OAG, Oxford Economics, the US EIA, and OAG/AWIN for capacity.
Matrix table: three column headers (the three sections) by three row labels (What we report, Scope of reporting, Where we get data) with bullets in each cell; footnote on index construction.
Worldwide real GDP grew 3.2% YoY; geopolitical events kept fuel elevated, driving a 15.4% CASM increase; the index grew capacity 3.3%, revenue 11.7% and earned a 4.1% operating margin; RASM grew 8.2% vs. CASM 15.4%. Map shows operating margins: North America 3.8%, Latin America 2.2%, Europe 5.7%, Asia/Pacific 5.1%, World 4.1% (Africa/Middle East insufficient data). Table of YoY RASM/CASM/margin change: North America 12.0%/18.5%/-5.21 pts; Europe -0.7%/4.3%/-4.56; Latin America 14.4%/26.4%/-9.28; Asia/Pacific 7.4%/15.0%/-6.26; World 8.2%/15.4%/-5.97.
Left bullet column; right side stacks a world map with margin callout boxes over a ruled data table.
Section break introducing the Global overview chapter.
Light-blue full-bleed slide, serif section title top-left, oversized numeral '02' bottom-right.
Action subtitle: 4.1% margin on 3.3% capacity growth; positive, single-digit margins across regions. Margin was up 2.1 points from the prior quarter but down 6.0 points from Q2 2025; expenses grew faster than revenue (+19.1% vs +11.7%). YoY capacity change: Latin America and Caribbean 5.9, Asia/Pacific 4.7, US and Canada 3.8, World 3.3, Europe 3.2. Revenue/expense growth: North America 16.3%/23.0%, Europe 2.5%/7.7%, Latin America 21.2%/33.9%, Asia/Pacific 12.5%/20.4%, World 11.7%/19.1%. Latin America had the highest capacity growth but lowest margin (2.2%).
Left column of 'Summary of Q2 results' and 'Q2 in context' bullets; right side has a margin world map, a horizontal capacity bar chart and a YoY metrics table.
Action subtitle: CASM growth outpaced RASM growth across all regions; Europe was the sole region with RASM decline YoY. Two bubble charts plot RASM growth and CASM growth (YoY %, y-axis 0-40) against capacity growth (x-axis 2-7%), bubble size showing capacity, for North America, Europe, Latin America, Asia/Pacific and World, with a reference line separating growth from decline.
Two side-by-side bubble charts with matching axes and annotated growth/decline zones.
Action subtitle: continued growth in personal spending, income and airline revenue despite sharply higher fuel costs. Global GDP grew 3.2% while airline revenue grew 11.7-11.8%; fuel was 45% higher than Q2 2025 ($3.04 vs $2.09 per gallon). Airline revenue vs GDP: North America 16.3 vs 1.8, Europe 2.5 vs 1.9, Latin America 21.2 vs 2.4, Asia/Pacific 12.5 vs 3.3, Africa/ME/India 7.0 vs 5.2, World 11.7 vs 3.2. Spending vs disposable income: North America 5.6/4.1, Europe 7.6/6.3, Latin America 13.8/16.2, Asia/Pacific 7.5/7.8, Africa/ME/India 6.7/6.7, World 7.3/6.8.
Left text summary; right stack of two clustered bar charts and a fuel-price line chart from Jan 2021 to Jul 2026 with a bracket annotation.
Action subtitle: global margin at 4.1%, regional margins lower than prior quarters, Europe highest at ~6%. Q2 2026 margins: North America 4% (Allegiant 9%, Delta 8%, United 6%, Southwest 3%, American 3%, Alaska -3%, Air Canada -3%, JetBlue -5%, Frontier -9%); LATAM 2% (Copa 9%, LATAM 5%, Aeromexico 4%, Azul -9%, Volaris -12%); Europe 6% (IAG 16%, Ryanair 13%, Finnair 9%, Air France-KLM 5%, easyJet 4%, Lufthansa -2%, Norwegian -5%, Wizz Air -12%); Asia/Pacific 5% (Cathay Pacific 10%, EVA 8%, Thai 5%, ANA 3%, JAL 2%, Vietnam Airlines -2%); IMEA 0% (El Al 13%, Air Arabia 3%, IndiGo 2%, Turkish -3%, Pegasus -5%).
Single wide column chart split into five regional panels by vertical rules, airline names rotated below; network vs value/LCC carriers colour-coded.
Section break introducing the US Carrier Annual Financial Review special topic.
Light-blue divider with serif title, italic subtitle and oversized numeral '03'.
2025 recap based on US DOT Form 41: full-service carriers led profitability, with Delta and United at 9% and 8% margins and American at 2.8%; Alaska and Southwest had modest profits while JetBlue and Hawaiian lost money; among ULCCs Sun Country and Allegiant were profitable, Spirit and Frontier were not, and Spirit was 34% of ULCC revenue. Lower-cost carriers grew ancillary revenue 18%. FSC capacity grew 3.4%; LCCs lost their labor-cost advantage, with both groups at 6.5 cents labor cost per ASM; fuel cost per ASM fell 9-10% for all groups; ex-fuel CASM rose 2.6% (FSC), 4.6% (LCC) and 6.3% (ULCC). The page notes Middle East unrest drove fuel sharply higher in the first half of 2026.
Two narrative text columns with a carrier-group definitions block, plus an aerial photo of an aircraft at the gate on the right.
Action subtitle: cargo/transport outpaced slower passenger revenue growth. 2025 FSC revenue was $177.3B (+2.4%) on 3.4% ASM growth: passenger $127.4B (+1.2%, 71.9%), cargo $3.5B (+4.4%, 2.0%), transport $32.1B (+7.3%, 18.1%), other $14.3B (+2.3%, 8.1%).
Stacked area chart of quarterly revenue by source 2022-2025 on the left, revenue table beneath, summary text column on the right.
Action subtitle: domestic load factor down 2.2 points over 2024. FSC domestic RASM fell 2.4% in 2025 (stage length +1.3%) and international RASM fell 1.2% (stage -2.1%); domestic load factor dropped to 83.5% and international rose 0.2 points to 83.1%. Transport revenue is excluded from unit metrics.
Two stacked line charts (RASM in cents, load factor in %) by quarter 2022-2025 with direct line labels; summary column on the right.
Action subtitle: ancillary revenue (other) grows 18%. LCC revenue was $51.3B (+1.6%) on 0.9% capacity growth: passenger $41.8B (-0.4%, 81.3%), cargo $0.4B (+2.1%, 0.8%), transport $3.4B (+2.6%, 6.7%), other $5.7B (+18.2%, 11.1%). The table header reads '2024 operating revenue by source' while the row is labelled 2025.
Stacked area chart, revenue table and right-hand summary, mirroring the FSC page.
Action subtitle: domestic load factor below 80% during 2025. LCC domestic RASM rose 0.7% (stage +1.8%) and international RASM rose 0.2% (stage +0.4%); both declined in Q3 2025. Domestic load factor fell 2.2 points to 79.7%, the lowest annual average since the pandemic; international fell 0.8 points to 80.9%.
RASM and load-factor line charts stacked on the left with summary bullets on the right.
Action subtitle: Spirit's struggles dragged group down. ULCC revenue fell 8.3% to $11.2B on 9.2% lower capacity: passenger $6.7B (-7.5%, 60.2%), cargo $0.2B (+41.4%, 1.4%), transport $0.3B (-1.1%, 2.6%), other $4.0B (-11.2%, 35.8%).
Stacked area chart, revenue table and summary column, matching the other carrier-group pages.
Action subtitle: RASM continued recent decline trend, until fourth quarter. ULCC domestic RASM rose 0.7% to 10.2 cents with stage length flat at 928 miles; international RASM also rose 0.7% with stage +0.9%. Domestic load factor fell 1.4 points to 79.7%; international load factor declined to 71.7%, the lowest since post-pandemic recovery.
Stacked RASM and load-factor line charts with right-hand summary.
Action subtitle: FSC unit revenue down in domestic and Atlantic regions. Revenue mix was largely unchanged 2024-2025 (FSC domestic 67.0% to 66.8%, Atlantic 16.9% to 17.1%, Latin 9.8% to 9.4%, Pacific 6.4% to 6.7%; LCC domestic 90.4% to 90.6%; ULCC domestic 92.2% to 92.7%). RASM 2024 to 2025: domestic FSC 18.0 to 17.6 (-2.4%), LCC 14.6 to 14.7, ULCC 10.1 to 10.2; Latin FSC 17.2 to 16.4 (-4.9%), LCC 12.6 to 12.4 (-1.7%), ULCC 8.6 to 8.7; Atlantic FSC 16.6 flat (+0.1%), LCC 13.6 (+0.4%); Pacific FSC 14.6 to 14.9 (+1.5%), LCC 8.9 to 10.4 (+16.9%).
Stacked 100% columns by carrier group on top, paired 2024/2025 RASM bars by region below with red/green change labels; summary at right.
Action subtitle: 2025 fuel savings offset increases in most other areas, but the joy ride is over. FSC cost per ASM 2024 to 2025: labor 6.3 to 6.5 (+4%), fuel and oil 3.5 to 3.2 (-10%), aircraft maintenance 1.8 to 1.8 (+2%), ownership 0.9 (-7%), transport 2.5 to 2.6 (+4%), all other 2.6 (+3%). Fuel savings cut CASM by 0.3 cents while labor added 0.2 cents.
Quarterly cost-line chart over 2022-2025 on top, paired YoY bars for 11 cost categories below, summary at right.
Action subtitle: rising labor cost could be exposed with rising fuel costs. LCC labor cost per ASM rose from 6.1 to 6.5 cents (+6%) in 2025; fuel and oil fell 3.2 to 2.8 (-10%); non-aircraft depreciation +16%, transport +11%, landing fees +8%; other categories broadly flat.
Same template as the FSC unit-cost page: line chart, paired category bars, summary column.
Action subtitle: rising labor and aircraft costs outpace other groups. ULCC labor per ASM rose 3.0 to 3.3 cents (+10%); fuel fell 2.7 to 2.5 (-9%); aircraft maintenance 0.8 to 1.0 (+14%) and ownership 1.5 to 1.7 (+13%), together about 0.4 cents more; non-aircraft depreciation +25%, food +33%, ads and promo +17%, all other -8%.
Line chart of cost categories by quarter, paired YoY bars, summary text.
Action subtitle: can ULCCs return to profitability without Spirit. Quarterly 2023-2025 lines for operating margin, RASM and CASM by Full Service, LCC, ULCC and Total show full-service carriers consistently earning the highest margin since the pandemic and ULCCs consistently unprofitable, while RASM and CASM stayed consistent by business model (stage-length adjusted to 1,100 miles).
Three stacked small-multiple line charts sharing a time axis, legend at bottom, summary at right.
Action subtitle: FSC increases revenue 5.1% during 2024; LCC up 3.5%; ULCC down 1% YoY. Quarterly revenue-mix columns show FSC quarterly revenue of roughly $36-46B with passenger at 71-75%, transport 16-18%, other 8% and cargo 2%; LCC quarterly revenue of $11-13B with passenger 80-84%; ULCC about $3B per quarter with passenger 58-62% and other 33-39%. Quarter labels on the axes are partly inconsistent in the source.
Three rows of 12 stacked percentage columns (one row per carrier group) with total revenue above each bar and a source-type legend.
Action subtitle: increases in labor cost have eroded the historic U/LCC advantage. Quarterly unit cost 2023-2025 in US cents: FSC total around 18.9-20.0 with labor rising from 5.9 to 6.8; LCC total 14.6-16.1 with labor rising from 5.7 to 6.7; ULCC total 10.2-11.9 with labor rising from 2.8 to 3.5 and fuel falling.
Three rows of 12 stacked cost columns (labor, fuel, aircraft ownership, maintenance, all other) with totals above.
Section break introducing regional performance results.
Light-blue divider with two-line serif title and numeral '04'.
Sub-section break: North America, overview of regional trends.
Light-blue divider with region name, italic subtitle and numeral '04.1'.
Action subtitle: margin declines amongst rising costs. North American margin fell 5.2 points from 9.0% to 3.8% on 3.8% capacity growth; revenue +16.3%, operating expense +23.0%, operating profit -51.2%; RASM rose 12.0% from 18.2 to 20.4 cents while CASM rose 18.5% from 16.6 to 19.6 cents.
Left bullet summary; right top YoY change column chart (ASM, revenue, expense, profit); right bottom paired Q2 2025/Q2 2026 bars for margin, RASM and CASM with positive/negative impact colours.
Action subtitle: value/LCC carriers had a smaller margin decrease, though FSC margins were more than 5 times higher. Full-service: ASM +4.5%, revenue +15.8%, expense +23.6%, profit -51.5%, margin 10.5% to 4.4% (-6.1 ppt), RASM 19.2 to 21.3 (+10.8%), CASM 17.2 to 20.4 (+18.3%). Value/LCC: ASM +1.3%, revenue +19.0%, expense +20.1%, profit -42.4%, margin 1.8% to 0.8% (-0.9 ppt), RASM 14.4 to 16.9 (+17.4%), CASM 14.1 to 16.7 (+18.5%).
Left bullets; right side two horizontal bands (full-service, value/LCC), each with YoY columns and paired margin/RASM/CASM bars.
Action subtitle: slight decrease in capacity originating from North America driven largely by decreases in cycles and gauge. Q2 2025 vs Q2 2026: gauge 131 to 130 seats (-0.9%), stage 912 to 908 miles (-0.4%), ASMs 429 to 428 billion (-0.2%), fleet 8,821 to 8,953 (+1.5%), cycles per day 3.3 (-1.1%), flight hours per day 7.3 (+0.1%).
Left bullets; right a 2x3 grid of paired bar charts, one per production metric, with coloured change labels.
Sub-section break: Latin America, overview of regional trends for Central/South America.
Light-blue divider with numeral '04.2'.
Action subtitle: weakest margins across global regions, opposite of the trend in recent quarters. Margin dropped from 15.9% in the previous quarter and from 11.5% a year ago to 2.2% (-9.3 ppt YoY, the largest of any region) despite the highest capacity growth (+5.9%); revenue +21.2%, expense +33.9%, operating profit -76.7%; RASM 12.3 to 14.0 cents (+14.4%) vs CASM 10.9 to 13.7 (+26.4%), likely due to fuel.
Standard regional template: bullets left, YoY columns and paired margin/RASM/CASM bars right.
Action subtitle: full-service carriers remained profitable, unlike value/LCC carriers, despite large cost increases. FSC: ASM +9.1%, revenue +23.4%, expense +37.8%, profit -55.4%, margin 15.4% to 5.6% (-9.9 ppt), RASM 13.2 to 14.9 (+13.1%), CASM 11.1 to 14.1 (+26.3%). Value/LCC: ASM -2.2%, revenue +13.7%, expense +23.0%, profit -537.9%, margin -1.8% to -10.1% (-8.3 ppt), RASM 9.9 to 11.6 (+16.3%), CASM 10.1 to 12.7 (+25.9%).
Two-band business-model comparison with bullets on the left.
Action subtitle: capacity growth driven by fleet growth, despite reduced cycles. ASMs 124 to 127 billion (+2.6%); fleet 1,867 to 1,968 (+5.4%); stage 781 to 790 miles (+1.2%); gauge 150 seats (-0.1%); cycles per day 3.9 to 3.7 (-4.5%); flight hours per day 7.4 to 7.3 (-2.1%).
Bullets left; 2x3 grid of paired production bars right.
Sub-section break: Europe, overview of regional trends.
Light-blue divider with numeral '04.3'.
Action subtitle: expense growth outpaced revenue gains, compressing margin by 4.6 ppt YoY. Operating margin fell to 5.7% (chart shows 10.3% in Q2 2025; the bullet text says 10.6%); RASM -0.7% to 18.6 cents vs CASM +4.3% to 17.6 cents; capacity +3.2%, revenue +2.5%, operating expense +7.7%, operating profit -43.1%.
Standard regional financial template.
Action subtitle: value/LCC retained higher margins despite a steeper decline. Full-service: ASM -0.4%, revenue +6.1%, expense +8.9%, profit -53.7%, margin 4.5% to 1.9% (-2.5 ppt), RASM 20.7 to 22.1 (+6.6%), CASM 19.8 to 21.7 (+9.4%). Value/LCC: ASM +6.2%, revenue -1.3%, expense +6.2%, profit -40.0%, margin 16.3% to 9.9% (-6.4 ppt), RASM 17.1 to 15.9 (-7.1%), CASM 14.3 flat.
Two-band business-model comparison with left bullets.
Action subtitle: capacity growth driven primarily by fleet expansion and increased gauge. ASMs 414 to 420 billion (+1.4%); fleet 7,172 to 7,415 (+3.4%); gauge 168 to 170 (+0.9%); stage 940 to 938 miles (-0.2%); cycles per day 3.7 to 3.5 (-4.8%); flight hours per day 8.6 to 8.2 (-5.5%).
Bullets left; 2x3 paired-bar grid right.
Sub-section break: Asia/Pacific, overview of regional trends.
Light-blue divider with numeral '04.4'.
Action subtitle: margins compressed as cost growth outpaced revenue and capacity. Margin fell 6.3 ppt from 11.3% to 5.1%; CASM +15.0% (17.1 to 19.7 cents) vs RASM +7.4% (19.3 to 20.7); revenue +12.5% and expense +20.4% vs capacity +4.7%; operating profit -49.7%. No business-model split due to limited value/LCC data.
Standard regional financial template.
Action subtitle: overall capacity decline despite considerable increase in fleet size. ASMs 569 to 553 billion (-2.8%); cycles per day 3.5 to 3.2 (-8.2%); flight hours per day 8.2 to 7.6 (-6.8%); fleet 8,611 to 9,041 (+5.0%); stage 868 to 876 miles (+1.0%); gauge 174 to 173 (-0.4%).
Bullets left; 2x3 paired-bar grid right.
Sub-section break: Africa/Middle East & India, overview of regional trends.
Light-blue divider with numeral '04.5'.
Action subtitle: strong operating margin of 20% was a slight decrease versus the prior fiscal year as cost growth outpaced revenue growth. Comparing Q2 2025-Q1 2026 with Q2 2024-Q1 2025: margin 20.9% to 20.1% (-0.8 ppt); ASM +5.0%, revenue +4.8%, expense +5.9%, operating profit +0.9%; RASM 12.9 (-0.2%), CASM 10.2 to 10.3 (+0.8%). Larger ME airlines only report fiscal-year results.
Standard regional template with an explanatory note on reporting cadence.
Action subtitle: double-digit margins across the board, though slightly lower than the prior year. Full-service: ASM +3.3%, revenue +4.9%, expense +5.7%, profit +2.1%, margin 21.9% to 21.3%, RASM 14.3 to 14.5 (+1.5%), CASM 11.2 to 11.4 (+2.3%). Value/LCC: ASM +11.6%, revenue +4.0%, expense +6.9%, profit -14.6%, margin 13.3% to 10.9% (-2.4 ppt), RASM 7.4 to 6.9 (-6.8%), CASM 6.4 to 6.2 (-4.2%).
Two-band business-model comparison with left bullets.
Action subtitle: capacity decrease driven by decline in all productivity metrics except fleet growth. IMEA capacity fell 15.5% (ASMs 217 to 183 billion); fleet 3,639 to 3,829 (+5.2%); flight hours per day 8.0 to 6.6 (-17.5%); cycles per day 3.0 to 2.4 (-17.3%); stage 1,067 to 1,018 miles (-4.6%); gauge 173 to 168 (-3.0%).
Bullets and a timing note on the left; 2x3 paired-bar grid on the right.
Section break introducing the appendix.
Light-blue divider with numeral '05'.
Explains that the AEA is Oliver Wyman's report on the financial state of the airline industry, published annually for about 15 years as a US-focused written report, now moving to a quarterly, global, slideshow-style release. Comparison table: release schedule annual to quarterly; coverage US emphasis to global; scope airline industry and macroeconomics to added granularity with proprietary tools; format written report to slideshow; deep dives retained and spread through the year; special topics released as merited.
Left bullets; right prior-vs-new comparison table; pull quote at the bottom pointing to oliverwyman.com.
Airlines in the global index by region: North America (Air Canada, Alaska, Allegiant, American, Delta, Frontier, JetBlue, Southwest, United); Latin America (Azul, Aeromexico, Copa, LATAM, Volaris); Europe (Air France-KLM, easyJet, Finnair, IAG, Lufthansa, Norwegian, Ryanair, Wizz Air); Africa/Middle East/India (Air Arabia, El Al, IndiGo, Pegasus, Turkish, Emirates, Etihad and Qatar annually); Asia/Pacific (ANA, Cathay Pacific, EVA, JAL, Thai Airways, Vietnam Airlines). Dots mark full-service vs value/LCC.
Five-column ruled list with colour-dot carrier-type markers and a bottom pull quote.
Q2 2026 vs Q2 2025 YoY by airline (ASM, revenue, expense, op. profit, earnings, op. margin ppts, margin ppts, RASM, CASM). Examples: Delta 1%, 19%, 24%, -23%, -25%, -4, -5, 17%, 23%; United 3%, 16%, 24%, -46%, -17%, -6, -2, 13%, 21%; American 5%, 16%, 23%, -61%, -88%, -5, -4, 10%, 17%; Allegiant -6%, 37%, 34%, 73%, 93%, 2, 9, 45%, 42%; JetBlue op. profit -570%; Alaska ASM +27%, RASM -13%.
Full-width ruled data table with grouped header.
YoY table for Aeromexico (ASM 2%, revenue 13%, expense 30%, op. profit -73%, op. margin -13 ppts, CASM 28%), Azul (ASM -11%, op. profit -1187%, margin -58 ppts), Copa (ASM 17%, revenue 26%, expense 45%), LATAM (revenue 27%, expense 39%, RASM 16%, CASM 27%) and Volaris (op. profit -344%, CASM 26%).
Full-width ruled data table.
YoY table: Air France-KLM (revenue 7%, op. profit -36%), easyJet (revenue -1%, op. profit -66%), Finnair (op. profit +332%, op. margin +6 ppts), IAG (revenue -2%, op. profit -18%, CASM 0%), Lufthansa (op. profit -298%), Norwegian Air Shuttle (op. margin -17 ppts), Ryanair (ASM 7%, RASM -8%), Wizz Air (ASM 22%, op. profit -748%, RASM -16%).
Full-width ruled data table.
YoY table: Air Arabia (ASM -25%, op. profit -85%, CASM 49%), El Al (revenue 27%, op. profit 40%, earnings 103%), IndiGo (expense 24%, op. profit -88%, op. margin -12 ppts), Pegasus (op. margin -21 ppts, CASM 37%), Turkish (revenue 20%, expense 40%, op. profit -127%).
Full-width ruled data table.
YoY table: ANA (ASM 6%, op. profit -50%), Cathay Pacific (ASM 10%, revenue 25%, op. profit +11%, earnings +71%), EVA Airways (op. profit -50%, CASM 21%), JAL (revenue -2%, op. profit -78%), Thai Airways (op. margin -15 ppts, CASM 32%), Vietnam Airlines (revenue 36%, expense 57%, CASM 46%).
Full-width ruled data table.
Exchange rates used, with change vs Q2 2025: AUD 1.45 (-5%), BRL 5.18 (-5%), CAD 1.42 (4%), CNY 6.79 (-5%), USD per EUR 1.14 (-3%), INR 94.67 (10%), KWD 0.31, MXN 17.49 (-7%), NZD 1.77 (7%), NOK 9.93 (-2%), QAR 3.64, SAR 3.75, SGD 1.29 (1%), KRW 1542 (14%), TWD 31.84 (6%), THB 33.27 (2%), TRY 46.65 (17%), AED 3.67, USD per GBP 1.33 (-3%), VND 26271 (1%).
Four-column ruled reference table.
Firm description (Oliver Wyman, a Marsh business; Marsh advises clients in 130 countries with $27 billion annual revenue and 95,000+ colleagues), regional phone numbers, authors Tom Stalnaker (Global Head of Transportation and Advanced Industrials), Khalid Usman, Grant Alport, Scott Laurence (Partners), Aaron Taylor (Senior Manager), Andrew Buchanan (Vice President), contributor Kuba Lipowski, plus copyright 2026 and a legal disclaimer.
Dense text page with three-column author grid and full-width disclaimer.
Closing page with the Oliver Wyman, A Marsh Business logo; no other text.
Light-blue full-bleed page with logo left-centre.
關於此幻燈片和基礎簡報內容的常見問題。
It is a 56-page published report deck from Oliver Wyman (a Marsh business) that reviews second-quarter 2026 airline financial results. It covers a global index of carriers, macro indicators and fuel, a special US Carrier Annual Financial Review of 2025, results for five regions, and appendix tables for each carrier.
The global index earned a 4.1% operating margin, down 6.0 points YoY, as expenses rose 19.1% against 11.7% revenue growth on 3.3% more capacity. Jet fuel averaged $3.04 per gallon versus $2.09 a year earlier (+45%), pushing CASM up 15.4% versus 8.2% RASM growth. Latin America had the weakest margin (2.2%, down 9.3 points) and Europe the highest (about 5.7%). IMEA capacity fell 15.5% as Middle East conflict disrupted Gulf hubs.
Oliver Wyman's transportation practice publishes it. The authors include Tom Stalnaker, Khalid Usman, Grant Alport, Scott Laurence, Aaron Taylor and Andrew Buchanan. It was an annual, US-focused written report for about 15 years and is now a quarterly, global, slideshow-style release published on oliverwyman.com.
Using DOT Form 41 data for 2025, it shows full-service carriers leading profitability (Delta 9%, United 8%, American 2.8% margins), FSC revenue of $177.3B (+2.4%), LCC revenue of $51.3B with ancillary revenue up 18.2%, and ULCC revenue down 8.3% to $11.2B as Spirit struggled. It also shows lower-cost carriers losing their labor-cost advantage, with FSC and LCC labor both at 6.5 cents per ASM.
Every content slide pairs a descriptive title with an italic action subtitle that states the takeaway, such as 'CASM growth outpaced RASM growth across all regions'. A left-hand bullet summary supports the charts on the right, and every chart is sourced. Each region repeats the same three-page module (financial results, business model, production review), and there are KPI tiles in the executive summary, numbered section dividers and appendix tables. Together these make it a useful model for chart-heavy business reviews.
World maps with margin callouts, horizontal and clustered bar charts, bubble charts that plot unit revenue and cost against capacity, a fuel-price line chart, stacked area and stacked percentage columns for revenue mix, stacked cost-driver columns, paired before/after bars with green and red impact labels, and full-width carrier data tables.
Start from your own analysis document or outline. 2Slides can turn a document, report or outline into a slide deck, and you can then apply the same structure: an executive summary with KPI tiles, action titles, a repeated section module and an appendix. Keep one message per slide and put the takeaway in the subtitle.
The original PDF is published by Oliver Wyman at https://www.oliverwyman.com/content/dam/oliver-wyman/v3/airline-economic-analysis-q2-2026.pdf. Oliver Wyman retains copyright, and the report says it may not be reproduced or redistributed without the firm's written permission.
Original PDF of the quarterly airline economics report deck.

Create Your Own Slides
Turn your ideas into professional presentations in seconds with 2slides AI.
參考專業設計,選擇您的風格,產生具有完美文字渲染的投影片。由 Nano Banana 提供支援—立即開始建立您的簡報。


