
所屬合集: 投資人簡報案例 · 日本上市公司法說會簡報範例
Mitsubishi Materials H1 FY2026 Earnings Presentation is the Japanese-language supplementary earnings briefing (2027年3月期 第2四半期 決算補足説明資料) from Mitsubishi Materials Corporation, released on TDnet, the Tokyo Stock Exchange timely-disclosure service, on 11 November 2026. It covers the first half (April to September 2026) of the fiscal year ending March 2027, with record first-half profit, a raised full-year forecast, profit bridges by segment, cash flow, and a reference section of quarterly data.
以這份簡報的封面作為風格參考,用您自己的內容產生幻燈片。 也可以在下方任選一頁,以它的版面作為參考。
快速導航
標籤
分享幻燈片
Mitsubishi Materials H1 FY2026 Earnings Presentation is the Japanese-language supplementary earnings briefing (2027年3月期 第2四半期 決算補足説明資料) from Mitsubishi Materials Corporation, released on TDnet, the Tokyo Stock Exchange timely-disclosure service, on 11 November 2026. It covers the first half (April to September 2026) of the fiscal year ending March 2027, with record first-half profit, a raised full-year forecast, profit bridges by segment, cash flow, and a reference section of quarterly data.
每張幻燈片頁面的詳細視圖,包括版面、關鍵內容和視覺元素。
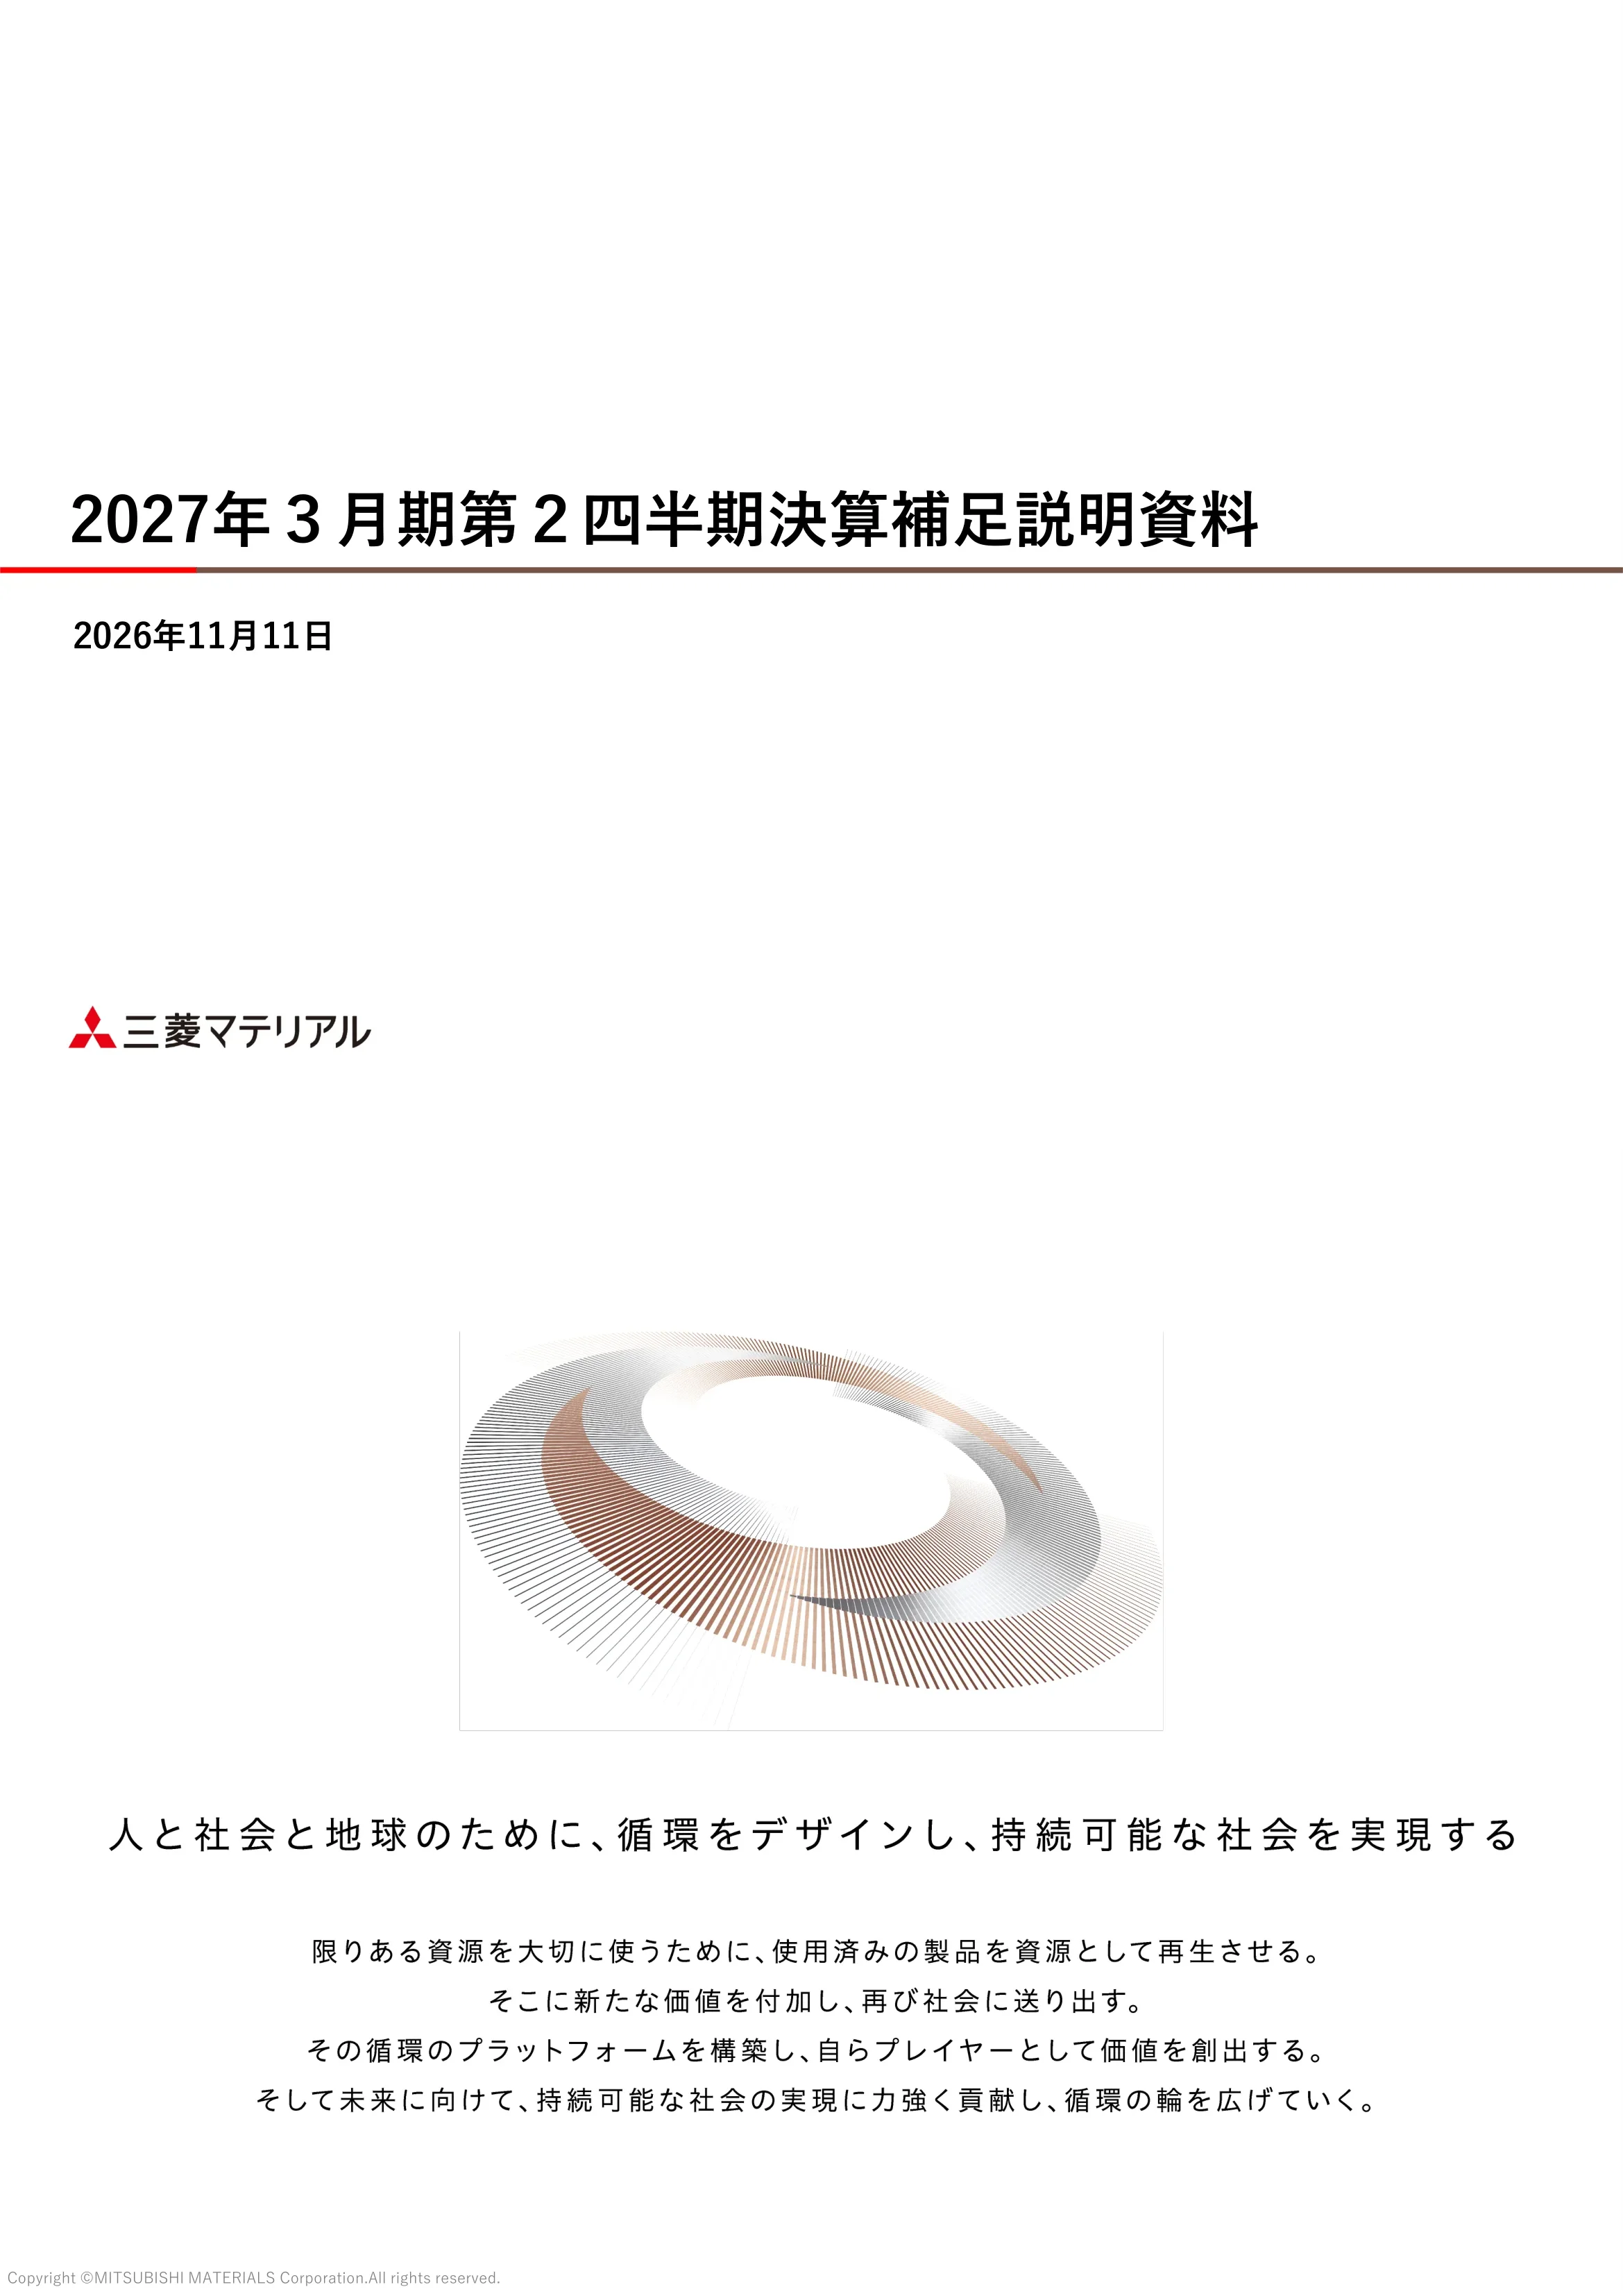
Cover slide titled 2027年3月期第2四半期決算補足説明資料, dated 11 November 2026, from Mitsubishi Materials (三菱マテリアル). It introduces the first-half results and forecast update.
Minimal white cover with a left-aligned bold title above a red-and-brown rule, the date beneath, and the company logo at bottom left.
A purpose statement reads roughly: for people, society and the planet, design circulation and realize a sustainable society. Four lines explain the idea of regenerating used products as resources, adding new value, building a platform for that cycle, and widening the circle of circulation.
Centered page with a large decorative image on top, a spaced-out headline in the middle and four lines of body text below.
Four sections are listed with page numbers: 1 Executive Summary (p.4), 2 Results for Q2 of FY ending March 2027 (p.7), 3 Full-Year Forecast for FY ending March 2027 (p.11), 4 Reference Information (p.16).
Plain numbered list with large bold section names on the left and page references in a second column.
Automotive demand in Japan and Southeast Asia was firm, with the company's copper products and cemented carbide in a recovering trend, and semiconductor demand stayed strong on AI. The yen is weaker year on year but trending stronger recently, copper is at a high level, and APT (tungsten intermediate) prices are high but showing signs of adjustment. The company is advancing its 2026 to 2028 medium-term strategy, citing a tungsten scrap processing capacity increase at Japan New Metals, the integration of domestic cemented carbide sales, 17 executive site visits, and joint tungsten and carbide work on APT price swings.
Two stacked panels, each with an olive label block on the left (Business Environment/Assumptions; Medium-Term Plan Progress) and bullet text on the right, with footnotes citing disclosures of 9 September, 7 October and 28 October 2026.
H1 net sales were 12,474 (¥100 million), up 4,174; operating profit 1,165 (up 1,056, up 943 excluding inventory valuation); ordinary profit 1,579 (up 1,412, up 1,299 excluding inventory valuation); net profit 1,208 (up 1,153), the highest ever for a first half. The full-year forecast is raised to sales 24,500 (+500 versus the previous forecast), operating profit 1,650 (+350), ordinary profit 2,200 (+400), net profit 1,600 (+200). The dividend forecast is held at 116 yen per share a year, with shareholder returns to be decided after reviewing investment plans and financial discipline.
Two stacked panels with olive labels (H1 results, full-year forecast), each with a headline sentence followed by a right-aligned list of key figures with year-on-year or forecast-change notes in smaller type.
H1 underlying improvement from management effort is +369 (¥100 million), driven by passing through floating sales prices, better realized efficiency and raw-material mix to cover cost increases, and capturing demand with stable procurement. The left bridge goes from 167 prior-year H1 ordinary profit to 1,579, with +1,043 from special factors (tungsten market +436, inventory valuation +112, FX +47, dividend timing +305). The right bridge shows full-year free cash flow rising from 490 (6 August forecast) to 2,140 (11 November forecast) via +400 ordinary profit, +910 working capital and +340 investment cash flow and other.
Left half has a numbered explanation box above a waterfall chart with callouts; right half has a numbered box above a second waterfall chart for FCF.
Compares H1 of the prior year with H1 of FY ending March 2027 (¥100 million): net sales 8,299 to 12,474 (+4,174); operating profit 109 to 1,165 (excluding inventory valuation 162 to 1,106); ordinary profit 167 to 1,579; extraordinary items minus 77 to plus 91; net profit attributable to owners 54 to 1,208. Dividends received rose 24 to 345 and equity-method income 91 to 136. Market inputs: dollar 146 to 159 yen, euro 168 to 184 yen, copper 438 to 622 cents/lb, gold 3,367 to 4,392 $/oz, palladium 1,081 to 1,360 $/oz, APT 465 to 3,046 $/MTU. A note says extra retirement payments were booked as extraordinary losses owing to the scale-down at Kosaka smelting after stopping copper concentrate processing.
Headline text over two side-by-side tables: financial results on the left and exchange rate and metal price assumptions on the right, with the current-year column highlighted.
A waterfall from H1 prior-year ordinary profit of 167 to 1,579 (1,522 excluding inventory valuation). Operating profit change is +1,056: FX +102, sales-price differential +1,120 (tungsten +868, copper premium revision +51, cemented carbide price normalization +113), cost and other price differential minus 383 (tungsten raw material price rise minus 366), volume +54, other operating +162. Non-operating change is +356: dividends received +321, equity-method +45, other minus 11. Underlying difference excluding inventory valuation is +1,299.
Headline commentary on operating and ordinary profit above a full-width waterfall with grey callout boxes for each major driver and bracket bars summarizing totals.
Ordinary profit by segment (¥100 million, prior-year H1 to current H1): Materials area 41 to 954; Smelting and Resource Recycling 19 to 893; Copper Products 1 to 106; Products area 72 to 260; Cemented Carbide 58 to 184; High-Performance Products 13 to 75; Resources 33 to 395; Renewable Energy minus 8 to 12; Other 28 to minus 43; total 167 to 1,579 (+1,412). The headline notes a +502 effect from selling low-price tungsten inventory before the price surge, +55 FX inventory effect, +40 cemented carbide pricing, and volume gains of +17 in copper products and +32 in high-performance products from semiconductor demand.
Four summary lines on top, then a large matrix with segments as rows and drivers (FX, price, cost, volume, other, dividends, equity-method, other) as columns, with red boxes highlighting the key cells.
Total assets were 29,976 (¥100 million) at end of September 2026 versus 29,997 at end of March, slightly lower as loans of gold and other items fell with a metal price decline (gold 4,608 to 4,176 $/oz). Net assets rose 7,529 to 8,628, equity 7,361 to 8,383, and the net D/E ratio improved from 0.72 to 0.56 as net interest-bearing debt fell from 5,290 to 4,735. The equity ratio is 28.0% (44.3% excluding deposits received for gold).
Three stacked bar charts: assets split into current and non-current, liabilities and net assets, and equity versus net interest-bearing debt with a red line for net D/E.
The 11 November forecast versus 6 August (¥100 million): sales 24,000 to 24,500; operating profit 1,300 to 1,650 (1,265 to 1,622 excluding inventory valuation); ordinary profit 1,800 to 2,200; extraordinary items 39 to 0; net profit 1,400 to 1,600. ROIC rises 13.7% to 16.7% and ROE 18.5% to 20.1%. Assumptions: dollar 159 yen, euro 182 yen, copper 606 cents/lb, gold 4,196 $/oz, palladium 1,230 $/oz, APT 2,773 $/MTU. Sensitivities for the second half onward: 1 yen on the dollar moves operating profit by 2.0, on the euro by 0.9, and 10 cents/lb on copper moves ordinary profit by 9.4.
Headline commentary above two tables: forecast comparison with ROIC and ROE on the left, and market assumptions plus a sensitivity table on the right.
Ordinary profit forecast rises from 1,800 to 2,200 (¥100 million), or +410 excluding inventory valuation (1,764 to 2,175). Operating profit +350: FX minus 3, sales-price differential +265 (cemented carbide price normalization +201, smelting by-product prices +29), cost differential +116 (tungsten raw-material +242, cemented carbide raw-material rise minus 124), volume minus 6, other minus 21. Non-operating +50: dividends received +84 (mine dividends +89), equity-method +18, other minus 53.
Commentary above a waterfall chart between two pairs of total bars, with grey callout boxes and bracket bars for operating and non-operating subtotals.
Ordinary profit forecast by segment (¥100 million, 6 August to 11 November): Materials area 1,150 to 1,326 (+175); Smelting and Resource Recycling 1,084 to 1,244; Copper Products 90 to 111; Products area 266 to 388; Cemented Carbide 185 to 267; High-Performance Products 80 to 121; Resources 458 to 601; Renewable Energy 15 to 16; Other minus 90 to minus 133; total 1,800 to 2,200 (+400). Highlights: tungsten raw-material differential +242, cemented carbide price effect +77, and a +89 update to mine dividend outlook on higher copper and a weaker yen.
Three summary lines above a segment-by-driver change matrix, with red boxes on the most important cells.
Ordinary profit is expected to fall from 1,579 in H1 to 620 in H2, a change of minus 959 (¥100 million). Smelting and Resource Recycling is minus 543, including Naoshima smelter expansion work minus 77, scheduled furnace repair minus 28, fading of realized-efficiency gains minus 120, and lower tungsten low-price inventory effect and others minus 135. Copper Products minus 102 (inventory valuation from H2 copper price conditions), Cemented Carbide minus 102 (raw material rises), High-Performance minus 30, Resources minus 189 (Los Pelambres dividend received in H1), Renewable Energy minus 8, Other +15.
Headline text above a descending waterfall of segment contributions, with grey callouts explaining Smelting, Copper Products, Cemented Carbide and Resources.
Free cash flow (FCF) forecast is raised from 460 (13 May forecast) to 490 (6 August) and then to 2,140 (11 November), in ¥100 million. From May to August: ordinary profit +1,070, working capital minus 1,070, investment CF and other +30. From August to November: ordinary profit +400, working capital +910 (Smelting and Recycling +510, Cemented Carbide +320, High-Performance +150), investment CF and other +340, a total of +1,650. Shareholder returns will be decided after reviewing investment plans and financial discipline.
A single two-stage waterfall running left to right, with callout boxes on the two working-capital steps and arrow bands marking the cumulative FCF changes.
Section divider for the reference material that follows: segment overviews, UBE Mitsubishi Cement, cash flow history, quarterly trends and operating data.
Mostly blank page with the section title 参考情報 above the red-and-brown rule and a page number at bottom right.
H1 net sales rose from 5,881 to 9,421 (¥100 million), operating profit from 29 to 890 and ordinary profit from 19 to 893, due to selling low-price tungsten inventory before the surge, better realized efficiency, FX inventory effects and raw-material mix. Full-year forecast: sales 18,172 to 17,661, operating profit 1,102 to 1,265, ordinary profit 1,084 to 1,244, on tungsten raw-material differentials and higher by-product prices such as sulfuric acid.
Split page: H1 results on the left and the full-year forecast on the right, each with a table highlighted by a red frame and a driver bridge table beneath it.
H1 sales rose from 1,555 to 2,378 (¥100 million), operating profit from 7 to 113 (53 excluding inventory valuation) and ordinary profit from 1 to 106, from copper-price inventory valuation, price normalization and higher volumes. Full-year forecast: sales 4,554 to 5,106, operating profit 107 to 126, ordinary profit 90 to 111, helped by revised copper price assumptions and pricing.
Left-right split of H1 results and full-year forecast, each with a summary table and a driver bridge, current columns outlined in red.
H1 sales rose from 691 to 884 (¥100 million), operating profit from 55 to 189 and ordinary profit from 58 to 184, driven by the weak yen, price normalization against raw-material rises, automotive demand recovery and temporary demand. Full-year forecast: sales 1,662 to 1,807, operating profit 189 to 275, ordinary profit 185 to 267, with temporary demand fading but price normalization continuing.
Mirror of the other segment pages: results on the left, forecast on the right, with a red-framed table and driver bridge under each.
H1 sales rose from 1,094 to 1,516 (¥100 million), operating profit from 15 to 75 and ordinary profit from 13 to 75, from a temporary increase in copper products for smelters and higher volumes of semiconductor seal products. Full-year forecast: sales 2,847 to 3,037, operating profit 93 to 130, ordinary profit 80 to 121, from price revisions and volume growth in AI and semiconductor products.
Same two-column structure with summary tables and driver bridges, current columns outlined in red.
UBE Mitsubishi Cement consolidated sales were 2,675 to 2,809 (¥100 million, prior-year H1 to current H1), operating profit 255 to 216, ordinary profit 271 to 219 and net profit 130 to 120, with Mitsubishi Materials' equity-method income 60 to 56. Domestic cement demand fell 1,535 to 1,450 (10,000 t) and U.S. cement volume 81 to 69 (10,000 st). Commentary says domestic business grew despite fuel costs and overseas sales rose on the weak yen, while operating profit fell. The bottom commentary is cut off at the slide edge.
Income statement table on the left, operating metrics table on the right, a small balance sheet reference line, and a commentary box across the bottom.
Free cash flow (¥100 million) over five fiscal years: FY March 2023 plus 11 (operating CF 451, investing CF minus 439), FY2024 minus 516 (513 and minus 1,029), FY2025 minus 204 (588 and minus 793), FY2026 prior year plus 46 (396 and minus 350), and the 11 November forecast for FY ending March 2027 of 2,140 (operating CF 2,030, investing CF 110). The commentary credits higher ordinary profit and working-capital compression and repeats that shareholder returns await further review.
Two bullet points above a combined chart of operating and investing CF bars with a red FCF line across five years.
A table of quarterly sales, operating profit and ordinary profit (¥100 million) by segment across the prior fiscal year and the current one. Current-year totals: Q1 sales 5,970, Q2 6,504, H1 12,474, H2 forecast 12,025, full-year forecast 24,500. Operating profit is 329, 835, 1,165, 484 and 1,650; ordinary profit 519, 1,060, 1,579, 620 and 2,200. Covers Materials, Smelting and Recycling, Copper Products, Products, Cemented Carbide, High-Performance, Resources, Renewable Energy and Other.
A dense matrix with segments down the side and quarter, half and full-year columns across two fiscal years; each segment has three rows for sales, operating profit and ordinary profit.
Full-year forecast by segment (¥100 million), 6 August versus 11 November, with change. Total sales 24,000 to 24,500 (+500), operating profit 1,300 to 1,650 (+350), ordinary profit 1,800 to 2,200 (+400). Materials area ordinary profit 1,150 to 1,326, Smelting and Recycling 1,084 to 1,244, Copper Products 90 to 111, Products area 266 to 388, Cemented Carbide 185 to 267, High-Performance 80 to 121, Resources 458 to 601, Renewable Energy 15 to 16, Other minus 90 to minus 133.
Single wide table with three column groups (previous, current, change), each with sales, operating profit and ordinary profit, and a dark total row.
Quarterly tables for the prior and current fiscal year. Current H1: electrolytic copper production 161 thousand t and sales 146 thousand t (full-year forecast 286 and 256); gold production 7 t; silver 102 t; copper products sales volume 63 thousand t (forecast 132). Market data for current H1: dollar 159 yen, euro 184 yen, copper 622 cents/lb, gold 4,392 $/oz, palladium 1,360 $/oz and APT 3,046 $/MTU; APT was 3,069 in Q1 and 3,023 in Q2, versus 1,758 in the prior-year Q4.
Two stacked tables, production and sales on top and metal prices and FX below, each with quarter, half, full-year and forecast columns.
Mine dividends (¥100 million): current H1 total 343 (Los Pelambres 305, Escondida 37), with an H2 forecast of 109 and full-year forecast of 453 (378 and 74). Equity-method investment income: current H1 136 (Mantoverde S.A., 30% held, 36; other 100), H2 forecast 182 and full-year forecast 319. The prior year totals were 229 for mine dividends and 212 for equity-method income.
Two stacked tables with quarterly columns, each with per-asset rows and a darker totals row.
Shows operating and ordinary profit with and without inventory valuation effects for Smelting and Resource Recycling, Copper Products and the company total (¥100 million). Total current H1: operating profit 1,165 with +59 valuation effect, giving 1,106 excluding it; ordinary profit 1,579 with +56, giving 1,522. Full-year forecast: operating profit 1,650 (+27 effect, 1,622 excluding), ordinary profit 2,200 (+24, 2,175). H2 forecast effect is minus 32.
A quarterly matrix where each segment block has rows for profit, the italic valuation effect, and profit excluding the effect.
Contact details for the Mitsubishi Materials IR office (address in Marunouchi, Chiyoda-ku, Tokyo, an IR email address, and the corporate website), plus a link to sign up for IR email alerts. The disclaimer says forward-looking statements reflect information available at publication, actual results may differ materially due to risks and uncertainties, and unauthorized reproduction of content, photos and charts is prohibited.
Grey contact box in the upper half with centered text and a link, and a black-header disclaimer block with three centered lines below.
關於此幻燈片和基礎簡報內容的常見問題。
It is a Japanese-language earnings deck from Mitsubishi Materials Corporation (2027年3月期 第2四半期 決算補足説明資料, a supplementary earnings briefing material), released on TDnet, the Tokyo Stock Exchange timely-disclosure service, on 11 November 2026. All slide text is in Japanese; the figures are in yen using 100 million yen (億円) as the unit.
It covers the first half (April to September 2026) of the fiscal year ending March 2027, which this page calls FY2026, together with an updated full-year forecast for the same fiscal year.
Net sales were 12,474 (¥100 million), operating profit 1,165, ordinary profit 1,579 and net profit attributable to owners 1,208. The deck describes the profit as the highest ever for a first half, helped by higher tungsten, copper and gold prices, a weaker yen, and stronger automotive and semiconductor demand.
Compared with the 6 August forecast, sales rise by 500 to 24,500, operating profit by 350 to 1,650, ordinary profit by 400 to 2,200 and net profit by 200 to 1,600 (¥100 million). The dividend forecast is unchanged at 116 yen per share a year, and free cash flow is forecast at 2,140.
Yes. Operating and ordinary profit are repeatedly shown with and without inventory valuation effects, for example H1 ordinary profit of 1,579, or 1,522 excluding the effect, and slide 27 gives the quarterly detail.
Smelting and Resource Recycling, Copper Products, Cemented Carbide Products, High-Performance Products, Resources, Renewable Energy and Other, grouped into a Materials area and a Products area. A separate slide covers the UBE Mitsubishi Cement affiliate.
Yes. It uses numbered executive summary pages, waterfall charts with callouts for profit bridges, two-column results-versus-forecast segment pages, and dense reference tables. Its consistent olive and brown palette makes it a good example of a Japanese manufacturer's results briefing.
No. It is a company disclosure. The closing slide says the forward-looking statements are based on information available at the publication date and actual results may differ materially.

Create Your Own Slides
Turn your ideas into professional presentations in seconds with 2slides AI.
參考專業設計,選擇您的風格,產生具有完美文字渲染的投影片。由 Nano Banana 提供支援—立即開始建立您的簡報。


